

Management Implications
The overriding water-exchange process impacting herbicide concentration exposure time (CET) relationships in run-of-the-river reservoirs, such as Noxon Rapids Reservoir in northwest Montana, is operational reservoir discharge schedules. During summer months, Noxon Rapids Reservoir dam discharge is greatly reduced in late night/early morning hours due to low energy demand on the regional electric grid in contrast to daytime/early evening hours, which are associated with peak power demand in the region. To date, there is limited research investigating precision timing of submersed herbicide applications in hydrodynamic reservoirs such as Noxon Rapids, and more specifically targeting low-flow periods and avoidance of herbicide applications when dam operations are increased to meet hydroelectric power requirements. Herbicide applications targeting low-flow periods may drastically increase CETs and improve control, as our data show. Furthermore, to mitigate short herbicide exposure times, CET relationships of the systemic herbicide triclopyr and the faster-acting contact herbicide endothall are presented for Myriophyllum spicatum (Eurasian watermilfoil). This herbicide combination may reduce the necessary exposure time and still provide long-term control.
Introduction
Over the past 30 yr, operational-scale treatments around the United States have verified that the linkage of water-exchange, herbicide concentration and exposure time (CET) relationships, and application techniques greatly improve herbicide efficacy (Getsinger et al. Reference Getsinger, Fox and Haller1996, Reference Getsinger, Turner, Madsen and Netherland1997, Reference Getsinger, Netherland, Grue and Koschnick2008, Reference Getsinger, Skogerboe, Madsen, Wersal, Nawrocki, Richardson and Sterberg2013; Getsinger and Netherland Reference Getsinger and Netherland1997; Getsinger et al. Poovey et al. Reference Poovey, Getsinger and Skogerboe2004). Based on these field verifications, new standards are being developed for management of submersed weeds in areas of high water exchange. Controlling Eurasian watermilfoil (Myriophyllum spicatum L.) in flowing systems has been inconsistent and unpredictable. Therefore, there is considerable interest in developing cost-effective and efficacious operational strategies for run-of-the-river reservoirs.
Submersed herbicide applications in these flowing systems are typically subject to more extreme environmental variables than applications in lakes. Most notably, run-of-the-river reservoirs have dynamic water-exchange processes that impact aqueous distribution of herbicides, resulting in reduced chemical exposure times against target plants and unacceptable control. Herbicide CET relationships have been developed specifically for M. spicatum using triclopyr ([(3, 5, 6-trichloro-2-pyridinyl) oxy] acetic acid) and endothall (7-oxabicyclo [2.2.1] heptane-2, 3-dicarboxylic acid) alone (Netherland and Getsinger Reference Netherland and Getsinger1992; Netherland et al. Reference Netherland, Green and Getsinger1991). Small-plot and whole-lake studies have verified these CET relationships and documented the efficacy range for herbicide rates, as well as selectivity for controlling M. spicatum populations with little to no harm to native plant communities (Getsinger et al. Reference Getsinger, Turner, Madsen and Netherland1997, Reference Getsinger, Petty, Madsen, Skogerboe, Houtman, Haller and Fox2000; Madsen et al. Reference Madsen, Wersal, Getsinger and Skogerboe2010; Poovey et al. Reference Poovey, Getsinger and Skogerboe2004; Wersal et al. Reference Wersal, Madsen, Woolf and Eckberg2010).
The common water-exchange process impacting aqueous herbicide dissipation and CET relationships in Noxon Rapids Reservoir is operational dam discharge schedules. To date, there is limited research investigating precision timing of submersed herbicide applications in hydrodynamic reservoirs such as Noxon Rapids, as related to discharge schedules. Herbicide applications targeting low-flow (minimal discharge) periods (i.e., 2100 to 0800 hours) may greatly increase CETs and improve control, whereas applications during times of high water flow (accelerated discharge) would shorten CETs and reduce treatment efficacy.
Furthermore, to mitigate short herbicide exposure times, CET relationships should be developed for combining a systemic herbicide such as triclopyr with a faster-acting herbicide such as endothall. This combination may offer the long-term control of triclopyr, but can also reduce the contact time needed for improved control by the addition of the faster-acting endothall (Madsen et al. Reference Madsen, Wersal, Getsinger and Skogerboe2010). The combination may also provide control of the invasive monocot, curlyleaf pondweed (Potamogeton crispus L.), which is susceptible to endothall but not typically affected by label rates of triclopyr (Netherland et al. Reference Netherland, Skogerboe, Owens and Madsen2000; Poovey et al. Reference Poovey, Skogerboe and Owens2002). There have been limited field assessments on CET relationships when these two herbicides are combined. Therefore the objectives of this study were to (1) utilize water-exchange information, driven by reservoir operations and discharge patterns, to predict the aqueous distribution and dissipation of herbicides; (2) develop prescriptive herbicide and application timing recommendations to maximize CET for control of M. spicatum and P. crispus; and (3) evaluate the response of the native submersed aquatic plant community after herbicide application.
Materials and Methods
Study Site Description
Noxon Rapids Reservoir
Noxon Rapids Reservoir (47.960528°N, 115.734372°W), located in northwestern Montana, is one of several large run-of-the-river impoundments on the Lower Clark Fork River system. The reservoir is over 48 km in length (30 linear miles), with its upstream boundary at the town of Thompson Falls, MT. The reservoir has a surface area of ∼ 3,100 ha (7,700 ac), with its widest fetch at 4 km. The average depth of the reservoir is 20 m, with a maximum depth of approximately 77 m, and the reservoir is designed to hold up to 493,392,000 m3 (400,000 acre-ft) of water. The primary function of Noxon Rapids Reservoir is for hydroelectric power generation, and daily dam operations are dependent upon power demands in the regional power grid. Water discharge from the dam during summer months is on average 2.1 m3 s−1 during nighttime hours (2100 to 0800 hours), followed by a rapid increase in water release with a peak discharge of approximately 765 m3 s−1 between 0900 to 1000 hours, which is associated with peak power demand in the region. Dam discharge stabilizes but remains high (up to 708 m3 s−1) until 2100 hours, when discharge levels decrease substantially.
The littoral zone of 800 ha has been defined from surveys using water transparency and depth distribution of submersed plants (Madsen and Cheshier Reference Madsen and Cheshier2009; Wersal et al. Reference Wersal, Madsen and Cheshier2009). These surveys documented a species-rich aquatic plant community with more than 17 species reported in the reservoir. Dominant submersed native plant species included elodea (Elodea canadensis Michx.), sago pondweed [Stuckenia pectinata (L.) Börner], leafy pondweed (Potamogeton foliosus Raf.), and coontail (Ceratophyllum demersum L.). Invasive species were a relatively small component of the plant community, with P. crispus occurring most frequently at 20% of surveyed points, followed by M. spicatum at 12.3% of littoral points, and flowering rush (Butomus umbellatus L.) at 2.3% of points. In 2008, it was estimated that there were 162 ha of P. crispus, 100 ha of M. spicatum, and 19 ha of B. umbellatus. A subsequent survey conducted in 2009 reported that M. spicatum covered an estimated 147 ha; indicating that this species was expanding within the reservoir (Wersal et al. Reference Wersal, Madsen and Cheshier2009).
Plot Description
Two plots were selected to evaluate water-exchange processes and the efficacy of M. spicatum and P. crispus control in Noxon Rapids Reservoir. Each plot was located in open water, at a minimum distance of 500 m from the nearest shoreline (Figure 1). Plot 1 (treatment) represented an open-water treatment and Plot 2 (nontreated) served as the nontreated reference to Plot 1.
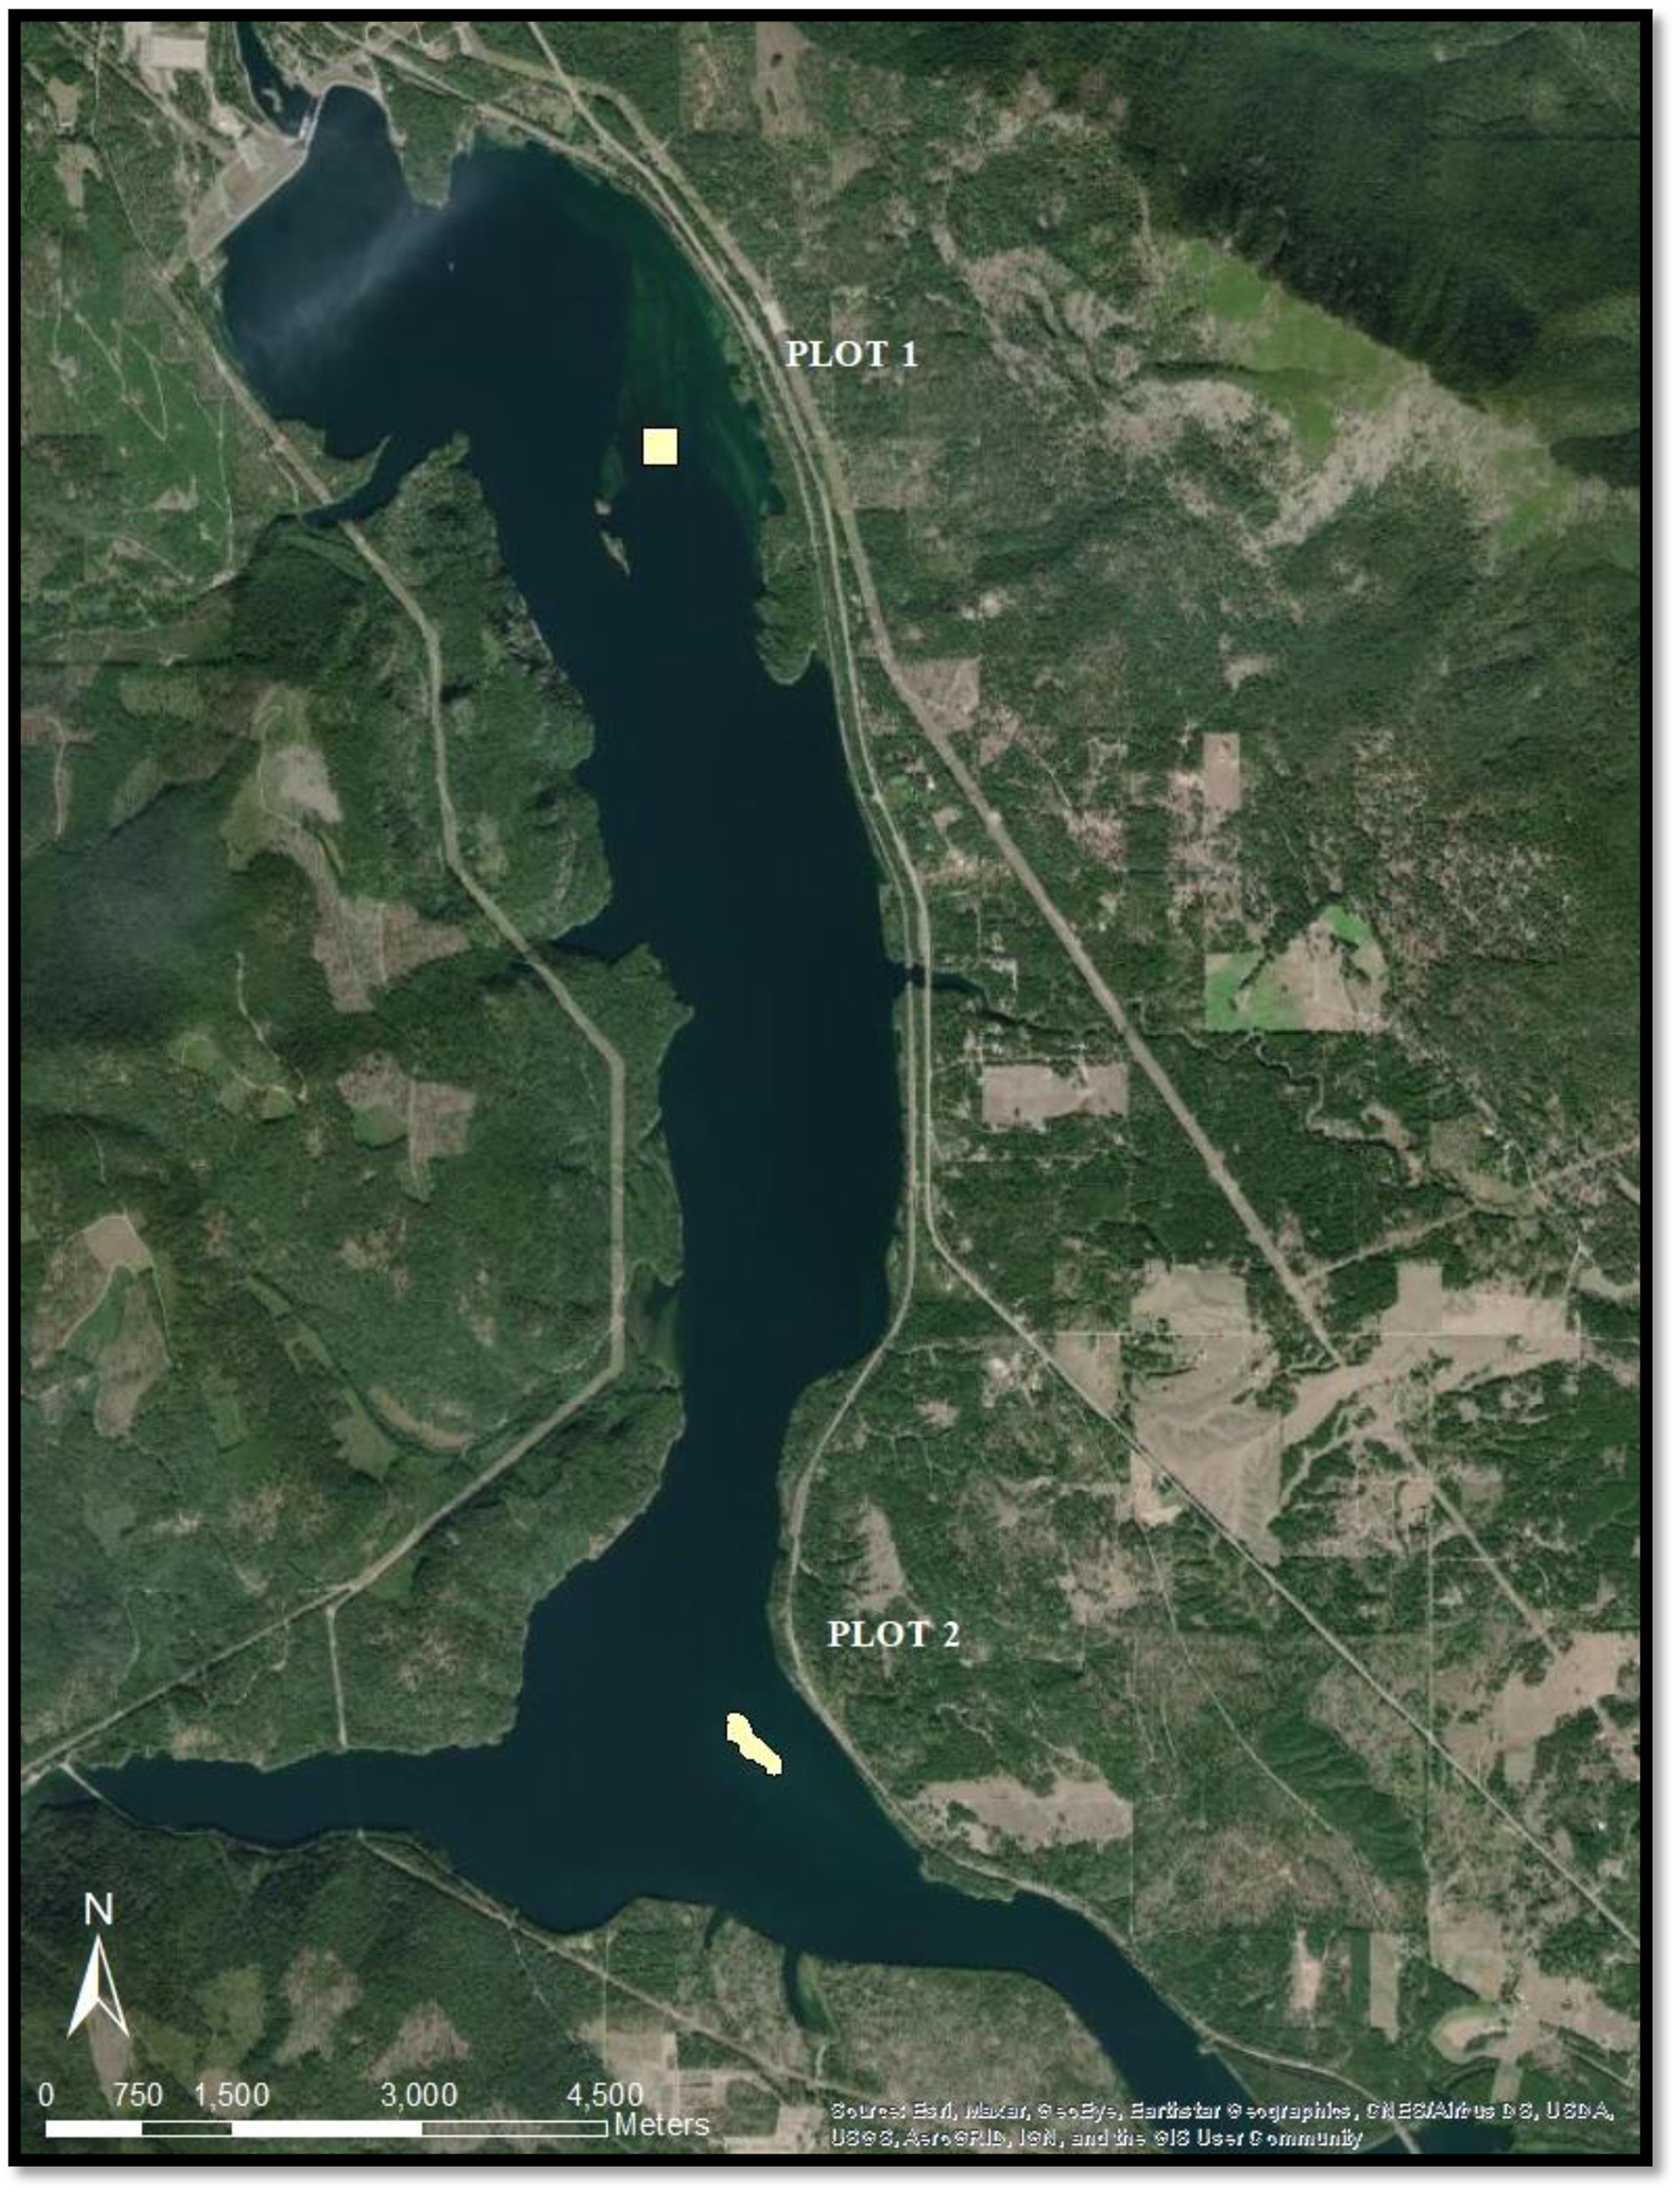
Figure 1. Location of treatment plot (Plot 1) and nontreated plot (Plot 2) at Noxon Rapids Reservoir, MT.
The treatment plot was 8.2 ha, nearly square in shape (283 by 285 m) and located on a littoral shelf (mean depth was 2.9 m, depth range 1.3 to 3.9 m) in open water. The plot was southeast and upstream of the dam and fore-bay area. Fifteen sampling stations were established for dye measurements and herbicide residue monitoring: 5 internal stations within the treatment plot and 10 external stations located 75 to 260 m from the plot boundaries (Figure 2).
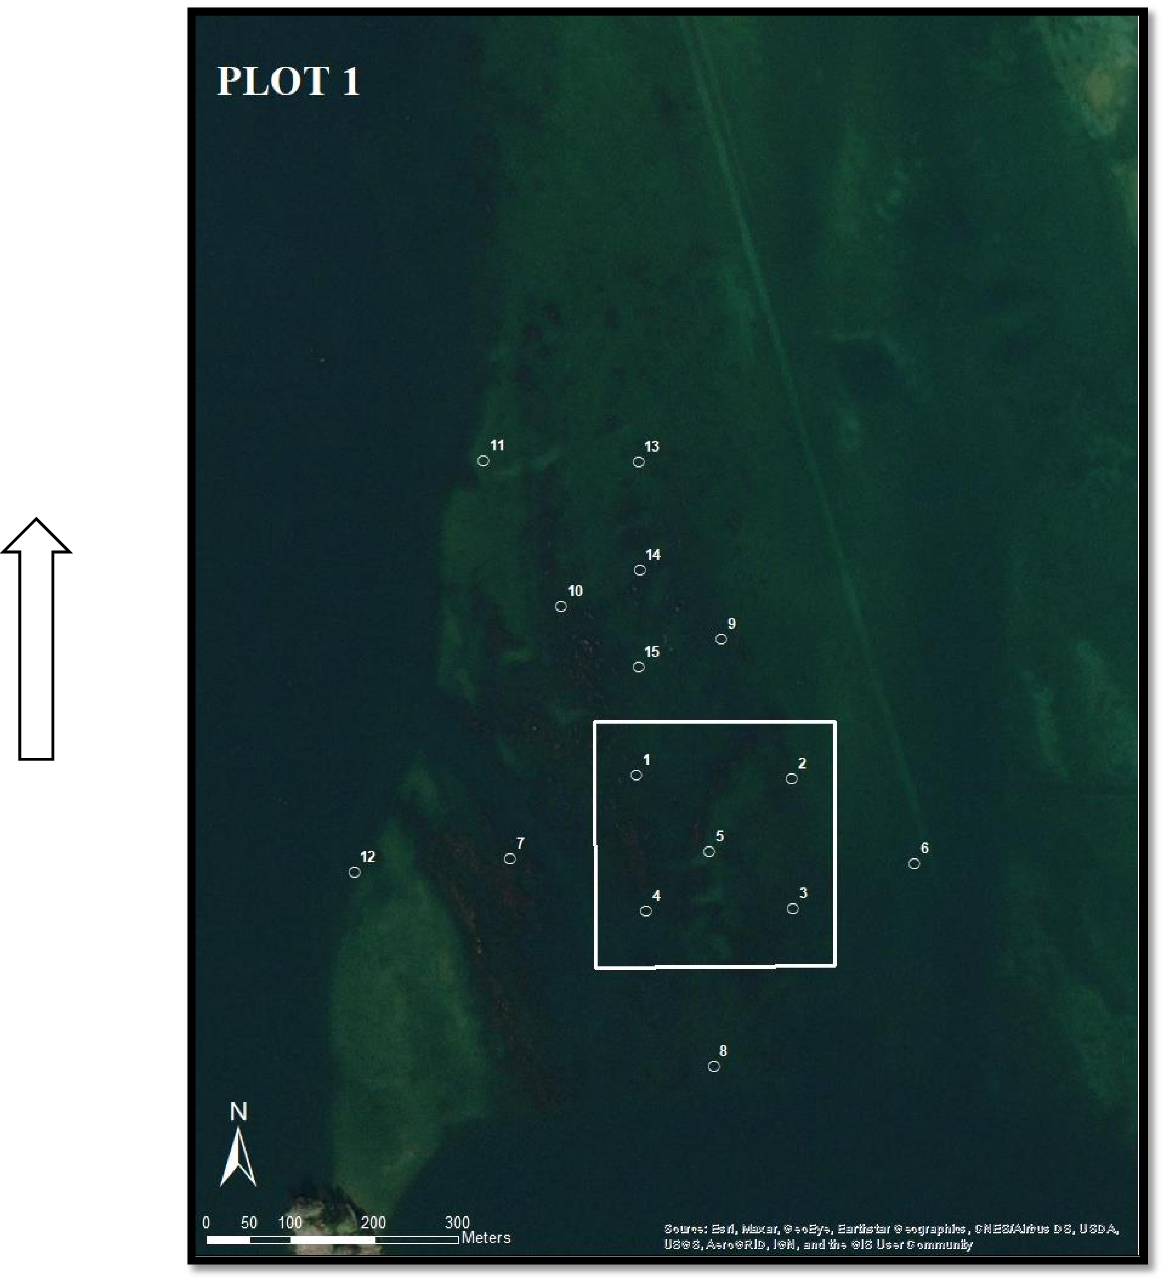
Figure 2. Internal and external rhodamine WT (RWT) dye and herbicide residue sampling stations in the treatment plot.
The nontreated plot was 9.6 ha (565 by 170 m) and located 6.75 km upstream from the treatment plot. The nontreated plot was situated on a shallow bar (mean depth was 2.7 m, depth range 1.6 to 3.9) in open water approximately 500 m from the eastern shoreline and 1,500 m from the confluence of the tributary Marten Creek. The nontreated plot served as the reference for the aforementioned treatment plot and therefore there were no internal or external sampling stations established, as the plot would not be receiving any application of dye or herbicide.
Rhodamine WT Dye and Herbicide Residue Studies
Water exchange was measured in situ with fluorometric instrumentation (AquaFluor Handheld Fluorometer, Turner Designs, 1995 N 1st Street, San Jose, CA 95112-4220) using the inert tracer dye, rhodamine WT (RWT). This liquid dye is routinely used in water-tracing studies in the Pacific Northwest by federal and state agencies. At concentrations used (10 µg L−1), the pink-colored dye is practically invisible to the human eye but can be measured using the calibrated fluorometers at concentrations as low as 0.1 µg L−1. RWT dye was applied to the treatment plot at two different times.
The first application was with RWT dye–only on the morning of July 23, 2009, during high dam discharge. The dye application began at 0833 hours and was completed at 0932 hours, wind was from the south at 3.6 to 4.1 m s−1, and the average water flow at the dam was 425.4 m3 s−1. RWT dye was measured in the water column at three depths: 0.3 m below the surface (S), middepth (M), and 0.3 m above the lake bottom (B) at each sampling station. Posttreatment water-sampling events were conducted immediately after the entire plot had been treated, denoted as 0 h after treatment (HAT), and at 1, 3, and 6 HAT.
A second application followed several days later in the early morning hours of July 30, 2009, during a minimum dam discharge period, and involved a simultaneous application of RWT dye plus a combination of liquid herbicides. The application began at 0200 hours to coincide with minimum dam discharge. Treatment during the minimum discharge period (nighttime) ensures that water-exchange processes are greatly reduced and potential herbicide CET relationships are increased in the targeted treatment area. The treatment plot was divided into three separate and equal application zones to accommodate herbicide tank capacity and to ensure safety of the personnel making the application during nighttime hours. The RWT dye plus herbicide mixes were delivered evenly over each zone via a boat enabled with global positioning system (GPS) technology until the entire plot was treated. Transects were followed to ensure even distribution of the herbicide and dye mixtures. The treatment process for each zone lasted approximately 50 min, and the total application process lasted 4 h 22 min (start: 0200 hours; end: 0622 hours). Both applications were conducted using a variable-depth injection system (LittLine®, Clean Lakes, Inc., P.O. Box 3548 Couer d’Alene, ID 83816). This application process simulated an operational-scale liquid aquatic herbicide treatment, with the injection system calibrated to deliver product to the depth zone containing the targeted submersed plants. Water samples were collected at 0, 1, 3, 6, 8, 10, 12, 24, 33, and 48 HAT to determine dye concentrations.
Dye Data Analysis
Water-exchange (RWT dye) half-lives for the treatment plot were determined using Sigma Plot 9.0 (Systat Software, 2107 North First Street, Suite 360, San Jose, CA 95131). Water-exchange data were subjected to regression analysis using a sigmoid function to estimate half-life within the treatment plot. Water-column distribution of dye is presented as a mean percentage of dye measured in three depth zones (surface, middle, and bottom), as described earlier. Dye dissipation modeling was conducted spatially using the Kriging function in ArcGIS (380 New York Street, Redlands, CA 92373). Kriging was used because directional and distance data were spatially correlated due to the repeated sampling of the same points inside and outside the treated plot.
Herbicide Residues
The liquid herbicides endothall (Aquathol® K, United Phosphorus, 630 Freedom Business Center, Suite 402, King of Prussia, PA 19406) and triclopyr (Kraken®, Phoenix Environmental Care, PO Box 370 Valdosta, GA 31603) were applied to the treatment plot at rates designed to achieve selective control of the target plants, M. spicatum and P. crispus. Application rates were based upon results of the initial water-exchange evaluations and previously developed herbicide CET relationships (Getsinger et al. Reference Getsinger, Turner, Madsen and Netherland1997; Netherland and Getsinger Reference Netherland and Getsinger1992; Netherland et al. Reference Netherland, Green and Getsinger1991; Poovey et al. Reference Poovey, Skogerboe and Owens2002, Reference Poovey, Getsinger and Skogerboe2004; Skogerboe and Getsinger Reference Skogerboe and Getsinger2002). These nominal rates were 1,850 µg L−1 triclopyr (40% maximum allowable rate) and 2,500 µg L−1 endothall (50% maximum allowable rate).
Following treatment, RWT dye was measured using the same fluorometric techniques as in the RWT dye–only applications, with water samples simultaneously collected from the fluorometer pump discharge stream and used for herbicide residue analysis. The pump was allowed to run for 30 s before sample collection to ensure proper flushing of the hose and to avoid cross contamination of residue samples. These water residue samples were collected in wide-mouth, brown, opaque, HPDE plastic 60-ml bottles, then fixed with 3 drops of 34.5% muriatic acid to prevent biological degradation of the sample before analysis. Samples were stored on ice and in the dark until shipment to the analytical laboratory. Dye measurements and herbicide residue samples were collected in the water column at the three aforementioned depths at each station. Samples collected from the treatment plot at 0, 1, 3, 6, 8, 10, 12, 24, 33, and 48 HAT yielded a total of 450 water residue samples.
Herbicide Residue Analysis
Water residue samples were frozen immediately upon receipt at the U.S. Army Engineer Research and Development Center, Environmental Laboratory in Vicksburg, MS. At least 48 h before analysis, samples were transferred to a refrigerator (4 C) to thaw. Samples and analytical test kits were removed from refrigeration at least 1 h before analysis to ensure they were at room temperature. The RaPID Assay® Endothall Test Kit and the RaPID Assay® Triclopyr Test Kit (Strategic Diagnostics Incorporated [SDIX], 111 Pencader Drive, Newark, DE 19702) were used to quantify endothall acid and triclopyr residues, respectively. Both kits utilize the principles of enzyme-linked immunosorbent assay to quantify residues.
An aliquot of the sample was mixed with diluent for a total sample volume of 1 ml. Samples were commonly diluted at either a 10:1 or 20:1 concentration for endothall samples and diluted at a 500:1 concentration for triclopyr samples. An aliquot of each sample was added to disposable test tubes along with an enzyme conjugate, followed by the addition of paramagnetic particles. The samples were incubated for either 20 min (endothall) or 30 min (triclopyr), after which a magnetic field was applied to the tubes. The magnetic field secured the paramagnetic particles to the side of the test tube, thus allowing for any unbound reagents to be decanted. The presence of endothall or triclopyr was detected by adding the enzyme substrate (hydrogen peroxide) and chromogen (3,3′,5,5′-tetramethylbenzidine), thus generating a colored product. The solution was incubated for 15 min (endothall) or 20 min (triclopyr) and then stopped with the addition of acid. The level of color development was inversely proportional to the concentration of either endothall or triclopyr in the water, because the enzyme-conjugated herbicide analogue competed with the unlabeled herbicide for antibody sites.
For both herbicides, the actual quantification was achieved by first producing a standard curve using standards provided with each test kit. One group of nine standards was analyzed with each set. Computer software furnished with the kit system provided a means of obtaining the curve and calculating results. The standard curve was constructed using linear regression after a log/logit transformation of the concentration and absorbance values. If the kit standards had lower than a 0.990 correlation, then the results were not deemed acceptable. All unknown samples were analyzed against standard curves. A new curve was constructed for each set of samples analyzed. Absorbance (450 nm) was measured in each tube using an RPA-I Photoanalyzer™ (SDIX). At least one sample was spiked with a known concentration of herbicide, and the percent recovery was determined. If the percent recovery was outside acceptable parameters as deemed by the test kit procedures, then the test was repeated. The average percent error was 2.41 ± 1.23 (SD) for all samples analyzed. Herbicide concentration data were subjected to regression analysis using a sigmoid function to estimate half-life within the treatment plot.
Aquatic Plant Surveys
Point-Intercept Assessments
Before the RWT dye plus herbicide application, pretreatment point-intercept surveys were conducted on July 25, 2009, using a 50-m grid to assess the plant community in both the treated and nontreated plots. This initial assessment was identified as the 0 wk after treatment (WAT) sampling interval. Similar surveys were conducted on September 5, 2009 (5 WAT), and July 23, 2010 (52 WAT) to assess short-term and long-term treatment efficacy on M. spicatum and P. crispus, in addition to selectivity on the native plant community. Survey methods were similar to those utilized during other projects in the Pacific Northwest (Madsen and Cheshier Reference Madsen and Cheshier2009; Madsen and Wersal Reference Madsen and Wersal2009; Madsen et al. Reference Madsen, Wersal and Woolf2015; Wersal et al. Reference Wersal, Madsen and Cheshier2009, Reference Wersal, Madsen, Woolf and Eckberg2010) and are considered standard for this type of project (Madsen and Wersal Reference Madsen and Wersal2017). In total, 36 and 38 points were surveyed in Plots 1 and 2, respectively. The surveys were conducted by boat using a Dell Latitude E 6400 XFR (1 Dell Way, Round Rock, TX 78682) ruggedized computer outfitted with a Trimble AgGPS106™ (935 Stewart Drive, Sunnyvale, CA 94085) GPS receiver to navigate to each point. Survey accuracy was 1 to 3 m, depending on satellite reception. At each survey point, a weighted thatch rake was deployed twice to determine the presence of plant species. Spatial data were recorded electronically using FarmWorks Site Mate® software (PO Box 250, Hamilton, IN 46742). The software allowed for in-field geographic and attribute data collection. Data were recorded in database templates using specific pick lists constructed exclusively for this project. Site Mate® provided an environment for displaying geographic and attribute data and enabled navigation to specific locations on the lake.
Data Analysis
Plant species presence was averaged over all points sampled and multiplied by 100 to calculate percent frequency. Changes in the occurrence of plant species between the pretreatment, 5 WAT, and 52 WAT surveys were determined using a Cochran-Mantel-Haenszel test, controlling for time (Stokes et al. Reference Stokes, Davis and Koch2000; Wersal et al. Reference Wersal, Madsen, McMillan and Gerard2006, Reference Wersal, Madsen, Woolf and Eckberg2010). This test assesses the differences in the correlated proportions within a given data set between variables that are not independent, in this case sampling the same points within a plot over time. Mean species richness, native species richness, and nonnative species richness were calculated for each plot and subjected to a mixed model procedures analysis with plot as a repeated-measures variable (Littell et al. Reference Littell, Milliken, Stroup and Wolfinger1996). The model determined differences in species richness within a given plot among sampling times. If a significant treatment effect was observed, means were separated using least-squares means and grouped using the LSD method. All analyses were conducted using SAS® analytical software (SAS Institute, 100 SAS Campus Drive, Cary, NC 27513), at a P < 0.05 significance level.
Results and Discussion
RWT Dye
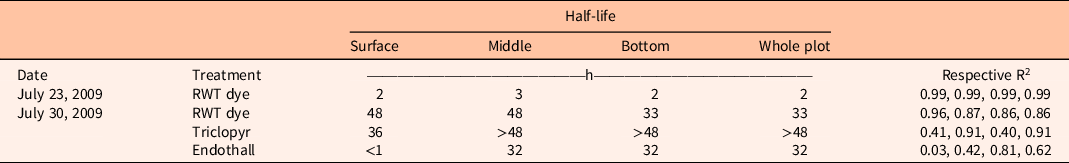
The whole-plot RWT dye half-life in the treatment plot during the RWT dye–only treatment (July 23, 2009) was very short, 2 h, with little variation measured in the water column (Table 1). The percentage of dye detected at 0, 1, and 3 HAT was relatively consistent (30% to 40% of dye in the water column) across all sampling depths. At 6 HAT, a greater percentage of dye (72%) was detected at the bottom depth compared with 18% and 10% detection at the middle and surface depths, respectively. A steady southerly wind (3.6 to 4.1 m s−1) during the application process, reservoir discharge patterns at time of treatment, proximity of the plot to the dam, and location of the plot away from protected shorelines were factors that impacted bulk water-exchange processes and subsequent rapid dissipation of dye from the treatment area. Water discharge at Noxon Rapids Dam is essentially zero during early morning hours (0330 to 0830 hours) but accelerates rapidly from 0900 to 1100 hours (0 to 623 m3 s−1) and remains high (623 to 708 m3 s−1) until 2100 hours. This initial and large pull of water through the dam, reflecting the rapid increase in midmorning power demand, coincided with the dye application period (0833 to 0932 hours) and was most likely the major factor affecting rapid water exchange in the plot. Because discharge remains high for upward of 12 h, water movement (flow) patterns in the plot would continue to be high, and short water-exchange half-lives and a limited herbicide contact time around target plants would be expected under these conditions.
Table 1. Calculated water-exchange half-lives for rhodamine WT (RWT) dye and triclopyr and endothall herbicides at surface, middle, and bottom depth zones and whole plot (calculated across depths) in Noxon Rapids Reservoir, MT, July 2009. a

a Dye and herbicide concentration data were subjected to regression analysis using a sigmoid function to estimate half-life within the treatment plot.
In an effort to extend potential herbicide contact time, the July 30, 2009, application of dye plus herbicide was strategically timed between 0230 and 0630 hours to coincide with minimum dam discharge patterns. This approach extended the whole-plot RWT dye half-life to 33 h, a nearly 15-fold increase compared with the RWT dye–only treatment (2-h half-life) on July 23, 2009 (Table 1). Aqueous distribution of dye suggested that the variable-depth application technique successfully injected product into the lower portions of the water column. The low-flow conditions during the July 30 dye plus herbicide application resulted in a greater percentage of RWT being distributed lower in the water column (Figures 3 and 4). Six of the 10 sampling periods documented 70% to 92% of measured dye at the bottom sampling depth and ∼70% to 95% of dye detected at the mid plus bottom depths during all sampling periods (1 to 48 HAT). These patterns indicate that dye levels are remaining within the treated plot for prolonged periods, for example, at 33 HAT, there was still 7 to 8 µg L−1 of dye in the bottom third of the water column in the treatment plot (Figure 4). The long residence time of dye in the treatment plot should translate into an extension of herbicide contact times around target plants and acceptable efficacy.
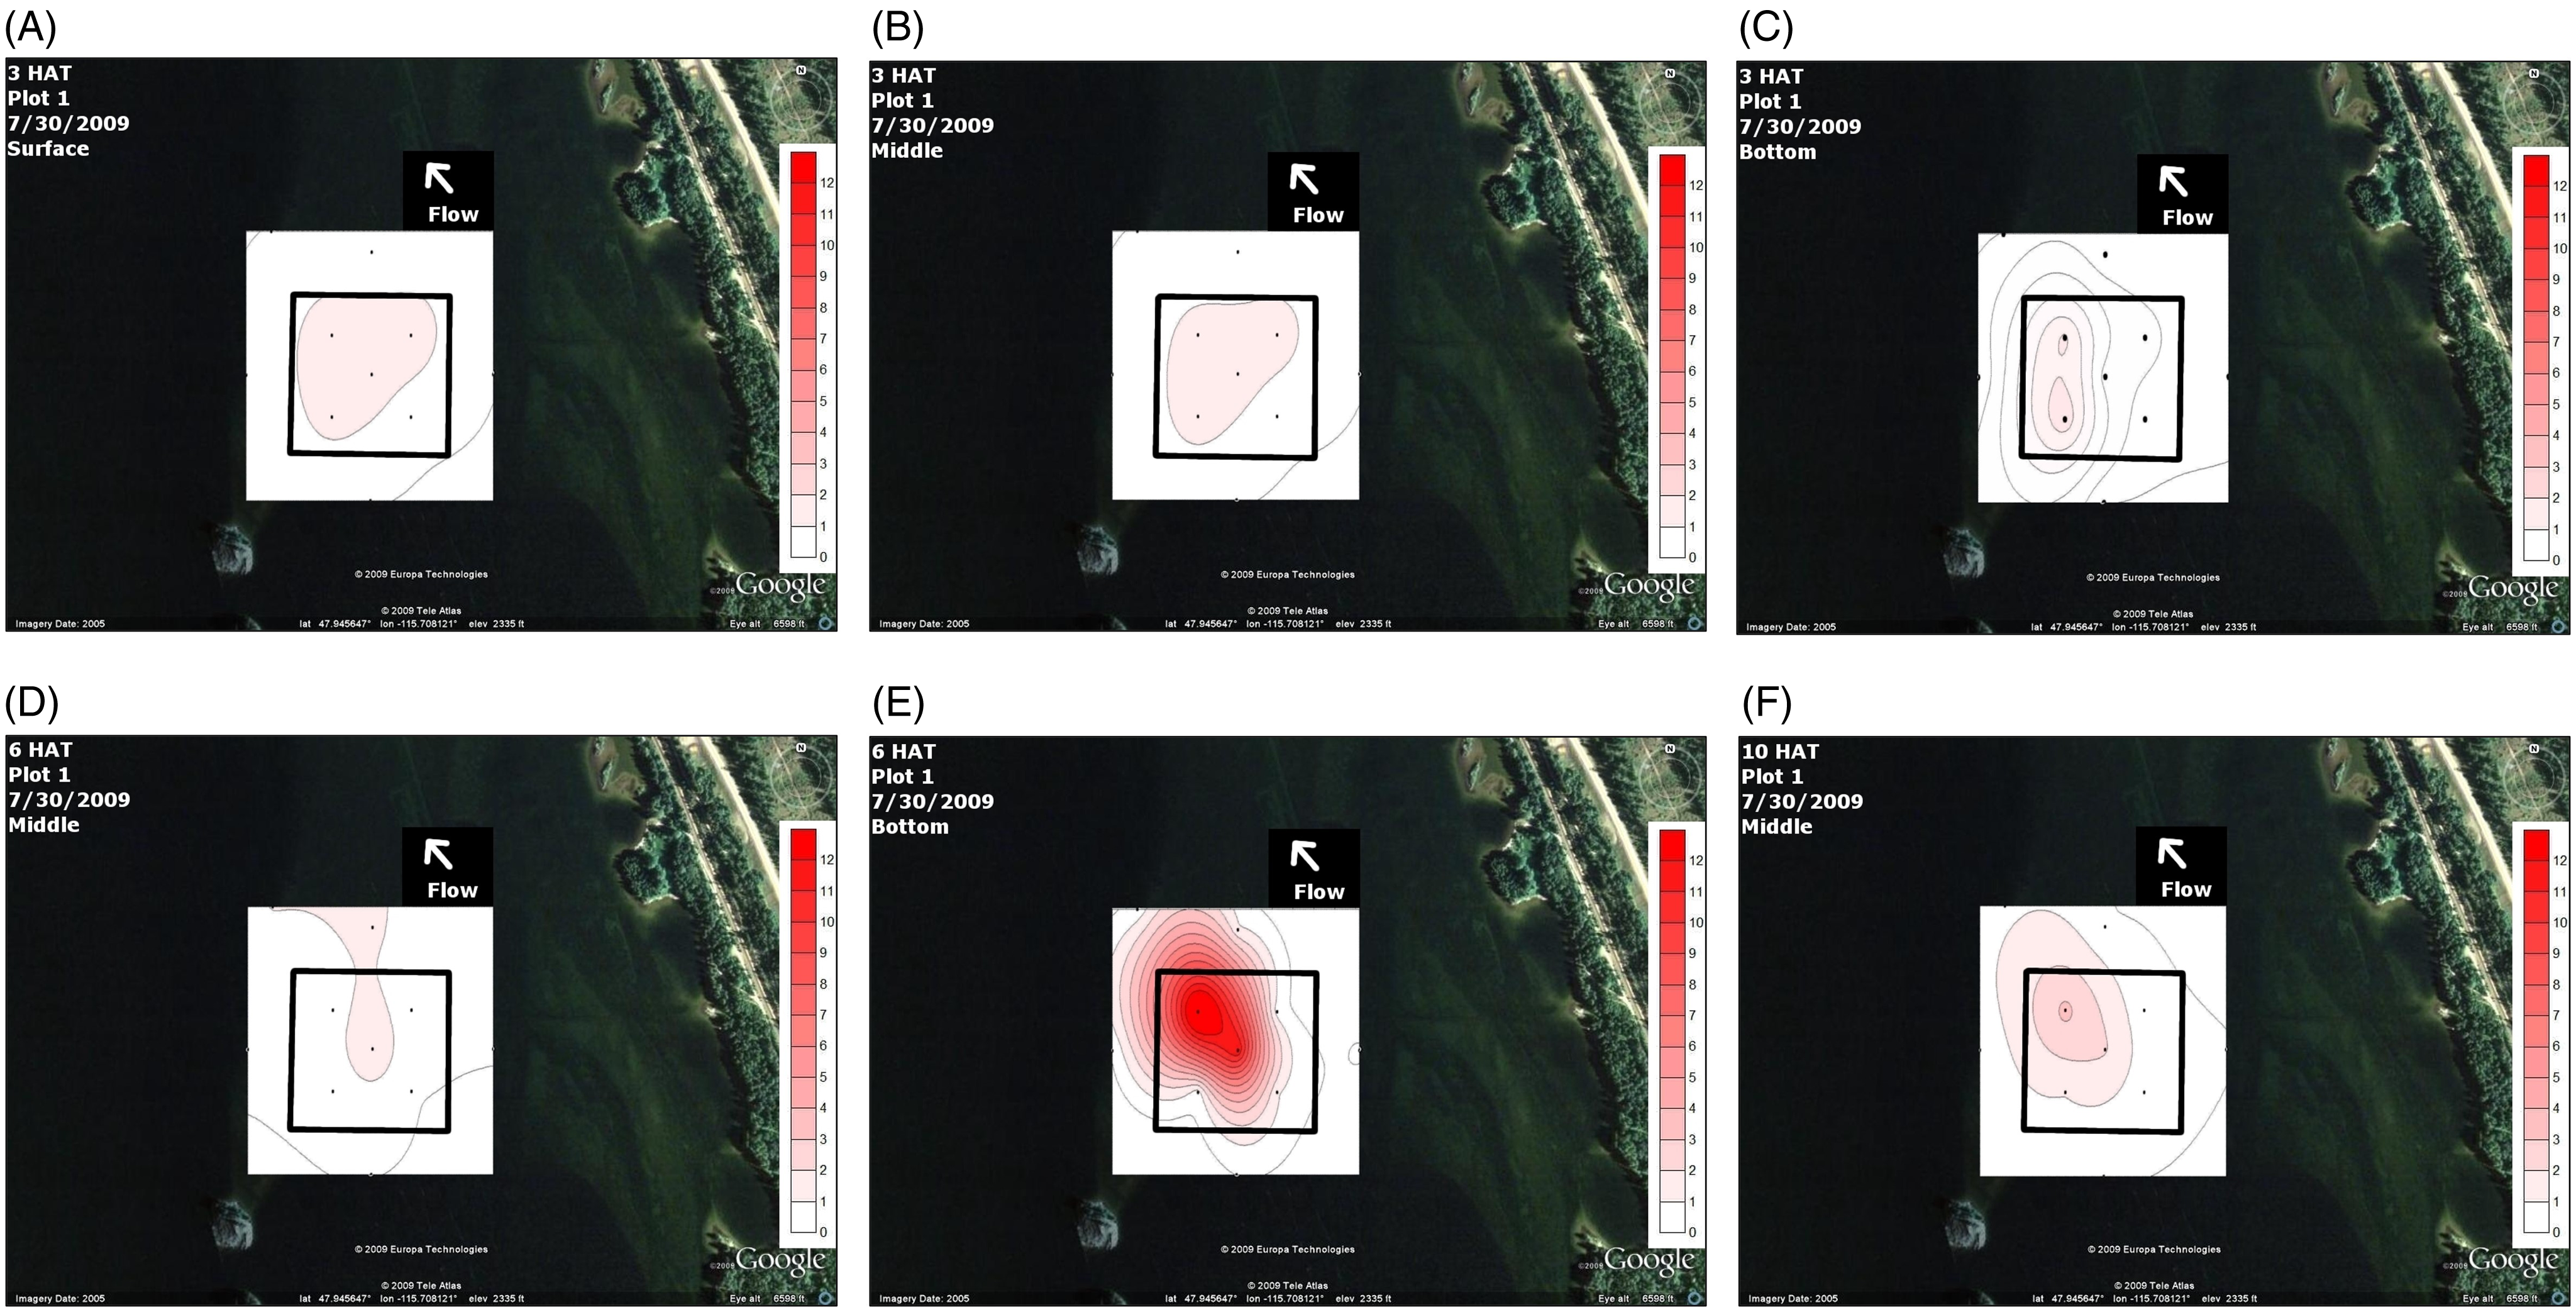
Figure 3. Dye dissipation modeling from July 30, 2009, in the treatment plot, from select times and water-column locations: 3 h after treatment (HAT) surface (A), 3 HAT middle (B), 3 HAT bottom (C), 6 HAT middle (D), 6 HAT bottom (E), and 10 HAT middle (F). Target dye concentration was 10 µg L−1, and the scale in each figure panel ranges from 0 µg L−1 (white) to 12 µg L−1 (red) to show changes in dye concentration through time.
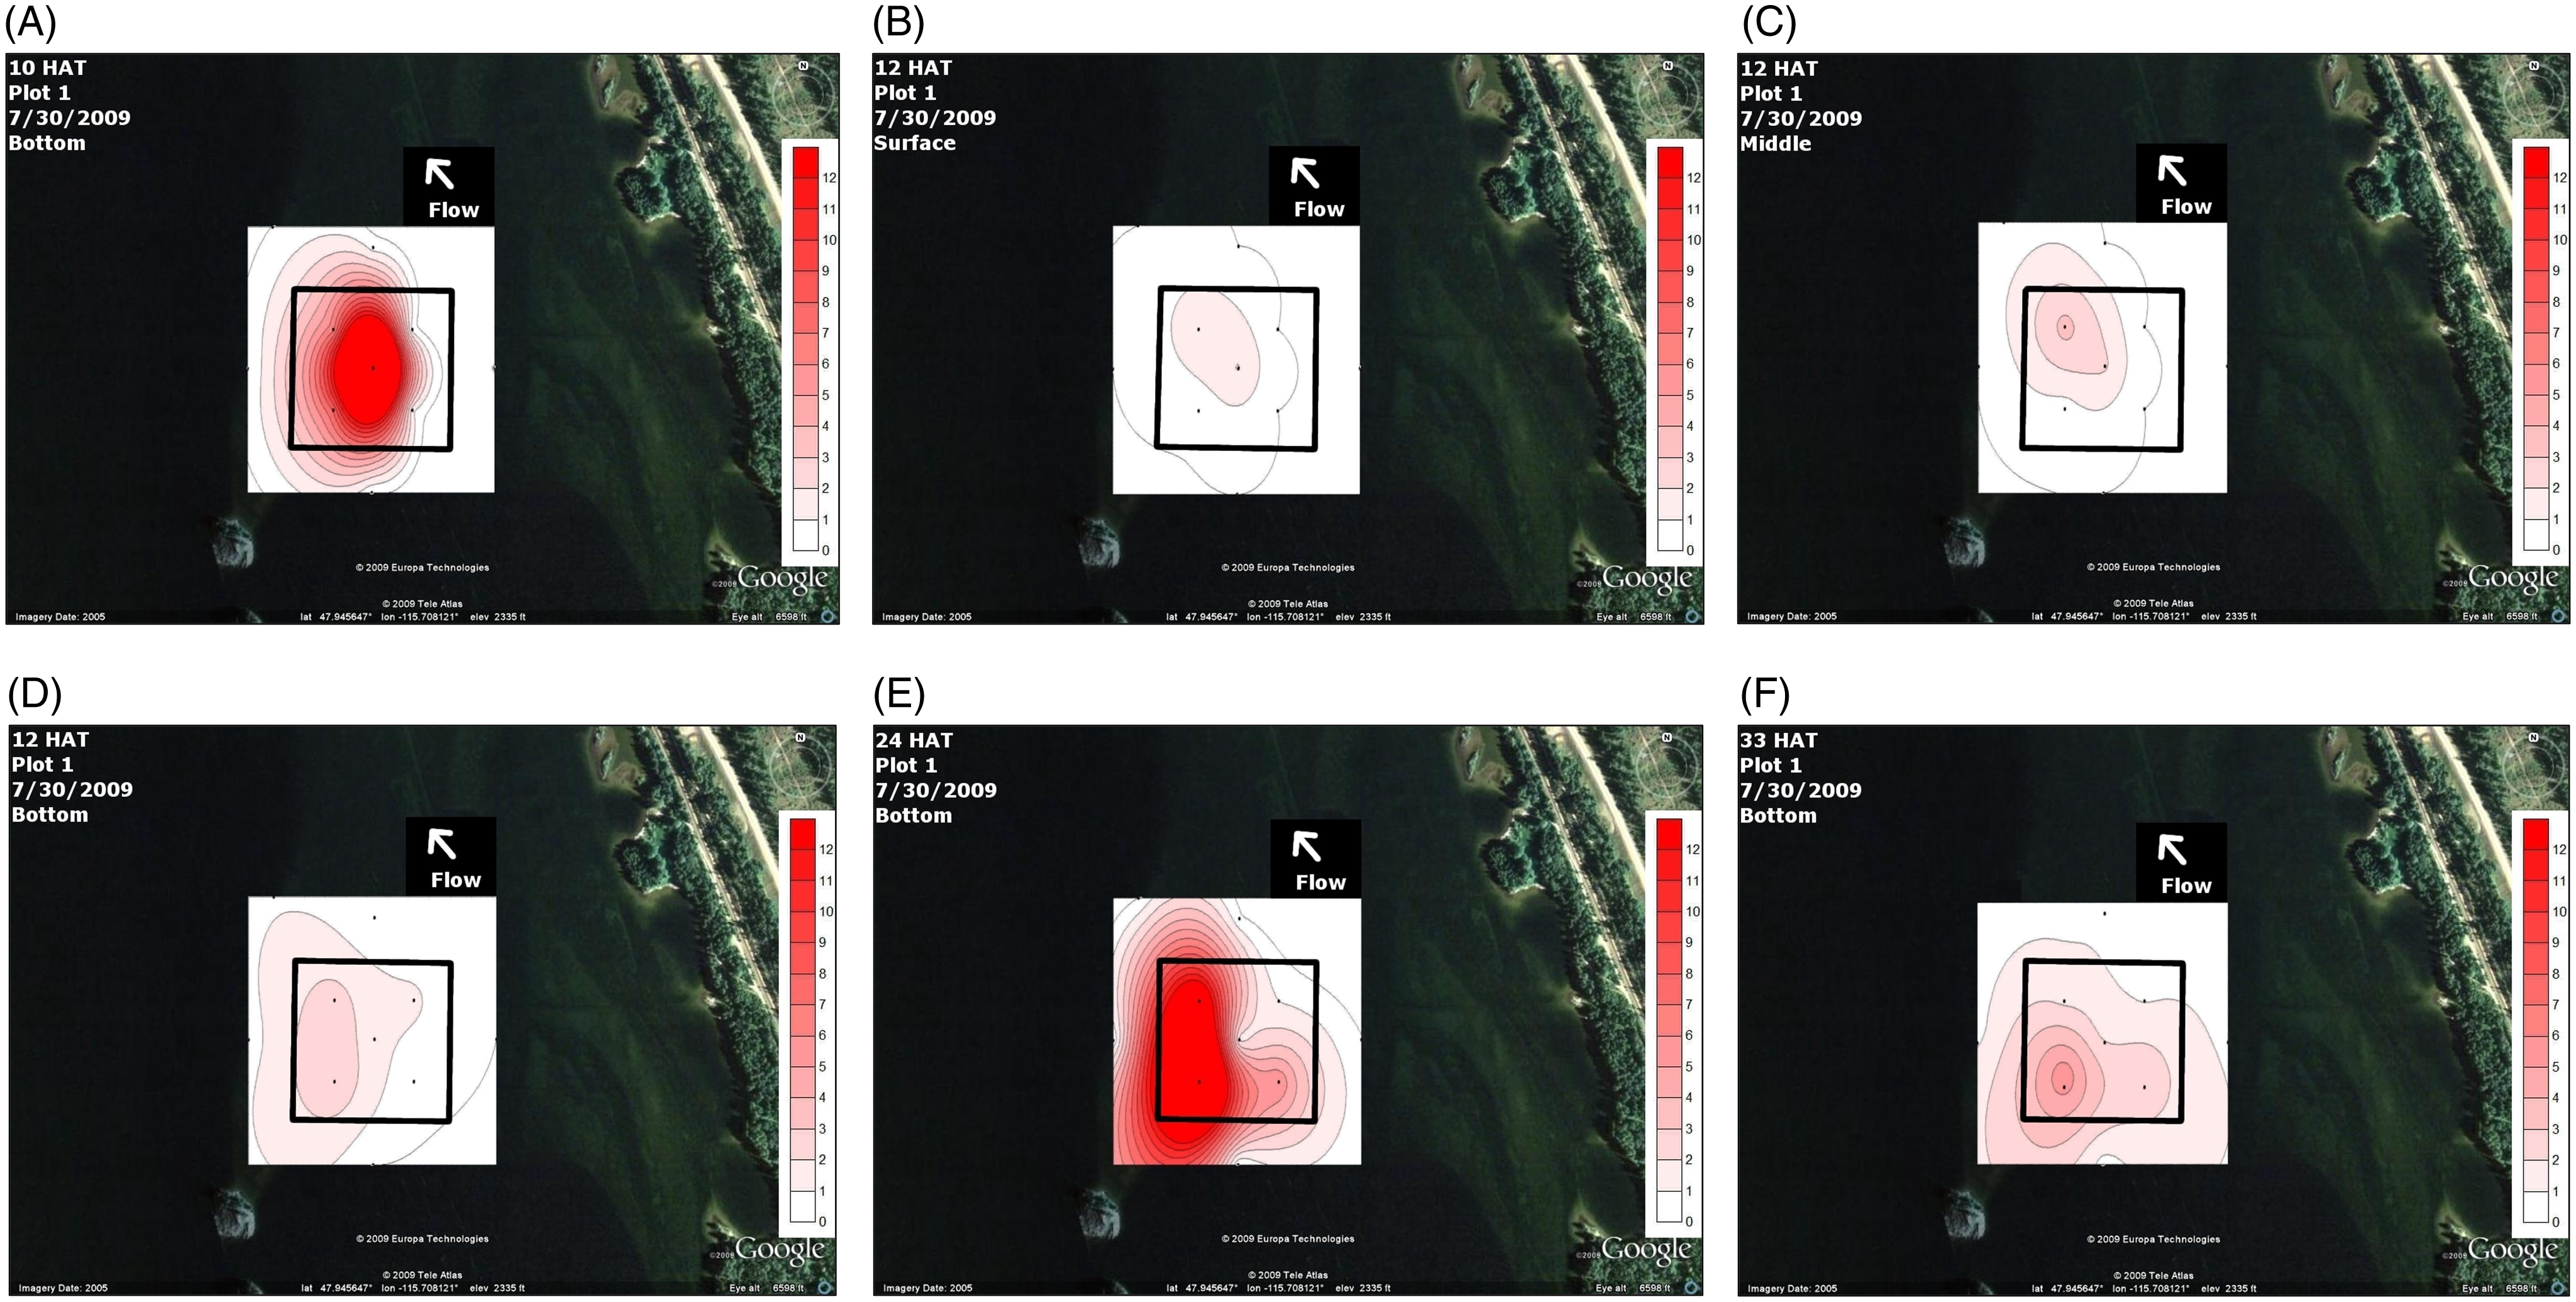
Figure 4. Dye dissipation modeling from July 30, 2009, in the treatment plot, from select times and water-column locations: 10 h after treatment (HAT) bottom (A), 12 HAT surface (B), 12 HAT middle (C), 12 HAT bottom (D), 24 HAT bottom (E), and 33 HAT bottom (F). Target dye concentration was 10 µg L−1, and the scale in each figure panel ranges from 0 µg L−1 (white) to 12 µg L−1 (red) to show changes in dye concentration through time.
Herbicide Residues
Mean aqueous triclopyr concentrations measured within the treatment plot from 0 to 48 HAT ranged from 214 ± 25 to 1,243 ± 36 µg L−1, with most sampling events showing levels between 500 and 1,000 µg L−1 or 27% to 54% of the nominal application rate of 1,850 µg L−1 (Table 2). In addition, triclopyr residue patterns were similar to those exhibited by the RWT dye (Turner et al. Reference Turner, Getsinger and Netherland1994). Previous studies have shown a strong correlation between triclopyr and RWT dissipation when applied simultaneously to surface waters (Fox et al. Reference Fox, Haller, Getsinger and Petty2002; Getsinger et al. Reference Getsinger, Turner, Madsen and Netherland1997). When averaged by water-column depth, mean triclopyr residues were 2.1 to 2.4 times higher in the bottom zone (1,239 ± 336 µg L−1) than residues measured in the middle (582 ± 92 µg L−1) and surface (507 ± 77 µg L−1) zones (Table 2). Depth stratification of triclopyr residues was consistent across the sampling periods. The aqueous residue distribution pattern indicates that the variable-depth injection technique was successful in applying most of the product into the lower portion of the water column within the treatment plot. As a result, herbicide rates would be greater around plant stands growing in the lower half of the water column for at least 48 h under these conditions.
Table 2. Mean (±1 SE) triclopyr and endothall herbicide concentrations (µg L−1) determined for hours after treatment (HAT) by depth (bottom, middle, surface) within the treatment plot in Noxon Rapids Reservoir, MT, July 2009.
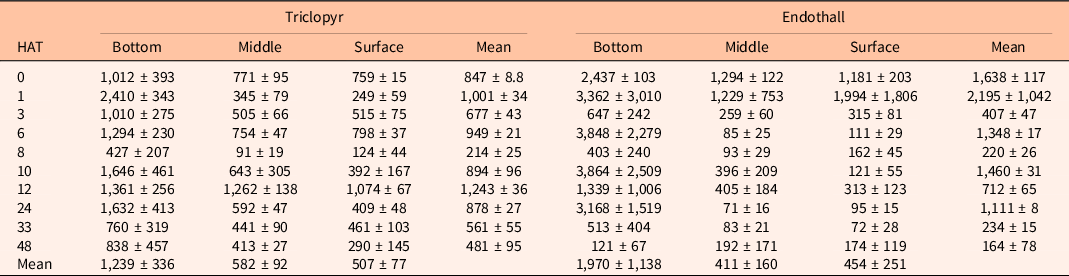
Calculated half-lives for triclopyr in the treatment plot were 36 h for surface, and >48 h for middle, bottom, and whole plot (Table 1). Based on triclopyr CET relationships from previous work (Getsinger et al. Reference Getsinger, Turner, Madsen and Netherland1997; Netherland and Getsinger Reference Netherland and Getsinger1992), the residue exposure period within the plot should provide adequate control of M. spicatum. Triclopyr residues measured at 0 to 24 HAT outside the plot were also similar to dye dissipation patterns. During this time period, mean triclopyr concentrations ranged from 7 ± 1 to 42 ± 31 µg L−1, or 0.5% to 3% of the maximum concentration measured within the treatment plot. Several hydraulic factors accounted for low levels of triclopyr outside of the plot. Bulk water-exchange and mixing processes occurring within the plot would dilute and transport residues away from the plot, as the treated water mixed with nontreated water. In addition, the extremely large area and volume of nontreated water surrounding the relatively small plot of treated water would further dilute triclopyr concentrations, as residues were continuing to move away from the plot.
External triclopyr residues generally peaked at 6 to 8 HAT. Although there was little flow-induced water exchange in the plot until dam discharge increased at 0900 hours, the higher residue levels (100 to 150 µg L−1) were measured in stations that were downstream from the southern plot boundary. These low levels of triclopyr would not be expected to impact plant populations, including the targeted invasive species (Netherland and Getsinger Reference Netherland and Getsinger1992).
Endothall
Mean aqueous endothall concentrations measured within the treatment plot from 0 to 48 HAT ranged from 164 ± 78 to 2,195 ± 1,043 µg L−1, with most sampling events showing levels between 400 and 1,500 µg L−1 or 16% to 60% of the target application rate of 2,500 µg L−1 (Table 2). Endothall residue patterns were similar to those exhibited by the RWT dye, and previous work has shown a strong correlation between endothall and RWT dissipation when applied simultaneously to surface waters (Fox et al. Reference Fox, Haller and Getsinger1993).
When plotted by water-column depth, mean endothall residues were 4.8 times higher in the bottom zone (1,970 ± 1,138 µg L−1) than residues measured in the middle (411 ± 160 µg L−1) and surface (454 ± 251 µg L−1) zones (Table 2). This depth stratification of residues continued for the sampling period and mimicked the depth stratification pattern measured for RWT dye and triclopyr. Similar to triclopyr, the aqueous endothall residue distribution pattern indicates that the variable-depth injection technique was able to administer the product into the lower portion of the treatment plot water column. Thus, endothall concentrations would be highest in and around plant stands growing in the lower portion of the water column for at least 48 h under these conditions.
Calculated half-lives for endothall in the treatment plot were <1 h for surface and ∼32 h for middle, bottom, and whole plot (Table 1). Based on endothall CET relationships from previous work (Madsen et al. Reference Madsen, Wersal, Getsinger and Skogerboe2010; Netherland et al. Reference Netherland, Green and Getsinger1991; Skogerboe and Getsinger Reference Skogerboe and Getsinger2002, Reference Skogerboe and Getsinger2006), the residue exposure period within the plot should provide fair to adequate control of M. spicatum. However, the combination of endothall and triclopyr used in this study should improve efficacy on M. spicatum (Madsen et al. Reference Madsen, Wersal, Getsinger and Skogerboe2010). The endothall rates utilized in this study have previously been shown to provide acceptable control of P. crispus in mesocosm and field evaluations (Skogerboe and Getsinger Reference Skogerboe and Getsinger2002, Reference Skogerboe and Getsinger2006; Skogerboe et al. Reference Skogerboe, Poovey, Getsinger, Crowell and Macbeth2008). Aqueous endothall residues outside the treatment plot at the external sampling stations were somewhat similar to RWT dye dissipation patterns. From 0 to 24 HAT, mean endothall concentrations ranged from 0 to 614 ± 6 µg L−1, or 0% to 28% of the maximum concentration measured within the treatment plot. Endothall residues recorded outside the treatment plot peaked at 3 to 10 HAT, while there was little flow-induced water exchange within the plot. These lower levels of endothall would not be expected to impact plant populations, including the targeted invasive species.
Water flow in run-of-the-river reservoirs is complex, and the dye and herbicide concentrations (i.e., increased half-lives) were impacted by a number of factors. The plant mat at the time of application was dense, with M. spicatum and P. crispus forming canopies at the water surface. The dense plant growth likely slowed water flow through the mat, thereby increasing residence time of dye/herbicide in the treatment plot. Water flow is not unidirectional in these systems, and flow is influenced by bottom morphology and shoreline morphology, both of which can impact the velocity and direction of water flow. Most notably, once the dam is closed and not pulling water, it causes the water to back up into upstream areas. The back-and-forth movement of water can occur over multiple hours and can move dye/herbicide in and out of a treatment area over time. This flow pattern could explain why concentrations were lower at one sampling time and higher during another. The back-and-forth movement of water in the vicinity of the treatment would also help keep the dye/herbicide in the treatment plot for a longer period of time, thereby increasing the half-life. Additionally, the application system that was used was designed to deliver the chemical to just off the reservoir bottom and under the plant mat. Injecting the dye/herbicide at the bottom during minimal dam discharge increased the residence time within the treatment plot, as the dye/herbicide was protected by the plant mat and not subject to rapid dilution and mixing that would have occurred if herbicide was applied to the upper water column, or when dam discharge was at its peak. Herbicide residue data showed that concentrations were higher in the bottom third of the water column, and these concentrations persisted for a longer period when the herbicide was injected at the bottom during times of minimal dam discharge.
Aquatic Plant Surveys
Treatment Plot
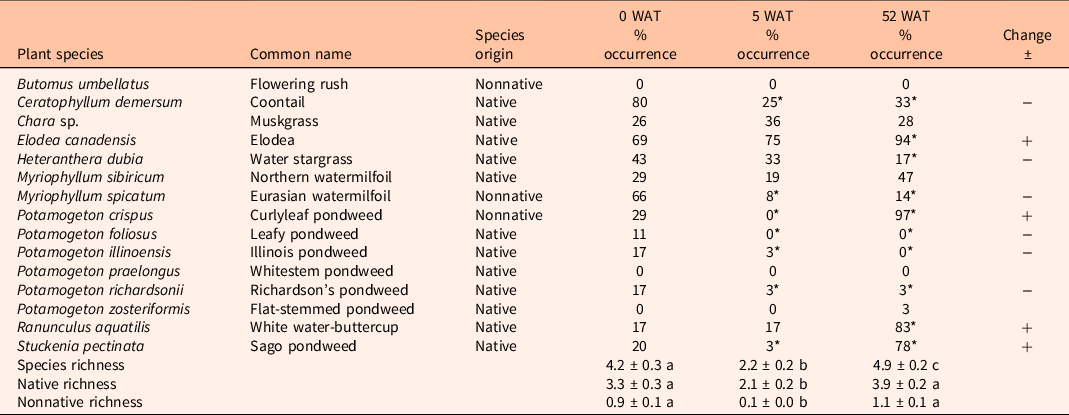
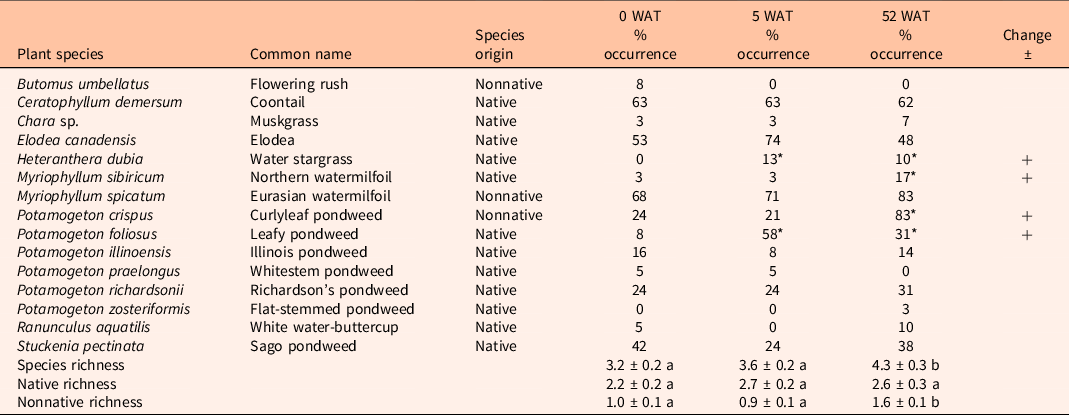
The presence of M. spicatum in the treatment plot significantly declined from 66% before herbicide treatment to 8% at 5 WAT and 14% at 52 WAT. This represented 88% and 80% reduction in the presence of M. spicatum at 5 and 52 WAT, respectively (Table 3). The locations of remaining M. spicatum after treatment were primarily along the southwestern boundary of the plot (data not shown). Herbicide residues and dye dissipation patterns indicated adequate concentrations in the lower portion of the water column; however, some plants survived the treatment or became reestablished following treatment. It is likely that these areas represent the most suitable places for plant growth and would be most easily reinfested following herbicide applications, as these points are on the edge of the plot and in shallower water, making them more susceptible to fragment establishment. Furthermore, the shallower depth would allow for greater light availability at the benthos to support plant growth.
Table 3. Aquatic plant occurrence in the treatment plot (Plot 1, triclopyr + endothall), Noxon Rapids Reservoir, MT, 2009 to 2010. a

a Differences between sampling events were determined at a P < 0.05 significance level using a Cochran Mantel Haenszel test. An asterisk indicates a significant change from the pretreatment occurrence for each species. Mean species richness (±1 SE) data were separated using the LSD method; values within a row sharing the same letter are not different at P < 0.05 significance level.
Despite evidence of recolonization, an 80% reduction in the presence of M. spicatum was achieved out to 52 WAT. While M. spicatum had greatly declined by 5 WAT, there were also impacts to the native plant community during this time (Table 3). The decline in the presence of native plants is attributed to the herbicide application, as similar declines in aquatic plants were not observed in the nontreated reference plot (Table 4). By 52 WAT, the presence of native plant species in the treatment plot, most notably E. canadensis, white water-buttercup (Ranunculus aquatilis L.), and S. pectinata, increased, indicating that native species were recolonizing areas previously occupied by M. spicatum or other species that declined in the plot. Recovery of these species has been documented in other Pacific Northwest reservoirs following herbicide applications (Getsinger et al. Reference Getsinger, Turner, Madsen and Netherland1997; Madsen and Wersal Reference Madsen and Wersal2009; Wersal et al. Reference Wersal, Madsen, Woolf and Eckberg2010).
Table 4. Aquatic plant occurrence in the nontreated plot (Plot 2), Noxon Rapids Reservoir, MT, 2009 to 2010. a
a Differences between sampling events were determined at a P < 0.05 significance level using a Cochran Mantel Haenszel test. An asterisk indicates a significant change from the pretreatment occurrence for each species. Mean species richness (±1 SE) data were separated using the LSD method; values within a row sharing the same letter are not different at P < 0.05 significance level.
The presence of the native pondweeds Illinois pondweed (Potamogeton illinoensis Morong), P. foliosus, and Richardson’s pondweed [Potamogeton richardsonii (Benn.) Rydb.], were significantly reduced at 5 WAT, and significant reductions in these native pondweeds were sustained when evaluated at 52 WAT. The reduction was most likely caused by endothall, which can be phytotoxic to pondweeds. In Lake Pend Oreille (downstream from Noxon Rapids Reservoir), P. foliosus declined after treatments of 2,4-D combined with endothall (Madsen et al. Reference Madsen, Wersal and Woolf2015). The presence of the native northern watermilfoil (Myriophyllum sibiricum Kom.) within the treatment plot throughout the duration of the study suggests that M. sibiricum might have been more tolerant to the herbicides and concentrations in this study than M. spicatum. Similar results were observed for M. sibiricum in Lake Pend Oreille, where there was no difference (P = 0.14) in the presence of M. sibiricum in treated (any herbicide) locations (3.1%) and in nontreated locations (6.6%) (Madsen et al. Reference Madsen, Wersal and Woolf2015). Myriophyllum sibiricum also increased from 3% during the pretreatment survey to 17% during the 52 WAT survey in the nontreated reference plot (Table 4).
Total species richness in the treatment plot increased from 4.2 species per point during pretreatment surveys to 4.9 species per point by 52 WAT. Although there were some impacts detected on the non-target plant populations at 5 WAT, the native plant community recovered by 52 WAT. There was a decrease in nonnative species richness at 5 WAT, largely due to reductions in M. spicatum. However, there was no difference in nonnative species richness at 52 WAT when compared with the pretreatment survey, a result driven by the widespread occurrence of P. crispus in 2010. Potamogeton crispus had a frequency of occurrence of 29% at 0 WAT, which was reduced to 0% at 5 WAT. However, the plant was found at 97% of sample points in the treatment plot at 52 WAT, indicating that the reduction may be attributed to the short-term efficacy of endothall. Potamogeton crispus senesces in mid- to late summer, oversummers as a turion on the sediment surface, and does not rely on seed production to recolonize like P. illinoensis and P. richardsonii (Woolf and Madsen Reference Woolf and Madsen2003).
The herbicide applications were conducted after P. crispus had initiated turion production; therefore, even if the plants were ultimately killed by the endothall, viable turions had already been produced and deposited on the sediment awaiting fall sprouting conditions. In order to significantly reduce P. crispus levels and eliminate turion production, innovative strategies must be evaluated for applications earlier in the growing season or in late fall when turions begin to sprout. However, two problems must be overcome: (1) water flows are high during spring months, greatly reducing herbicide exposure times, which may result in little or no control; and (2) the seasonal phenology of P. crispus may be delayed depending upon water temperatures, which will ultimately limit the applicability of some methods and herbicides. Therefore, late fall evaluations may be the most opportune time to control P. crispus with herbicides in the Lower Clark Fork River system.
Nontreated Plot
The presence of plants in the nontreated plot had minimal variation between the initial survey and the 52-wk survey (Table 4). The consistent occurrence of M. spicatum in the nontreated plot indicates that reductions in the treatment plot were due to the herbicide application and not natural senescence. Myriophyllum spicatum was found during the 5- and 52-wk surveys at points where it was absent during the initial survey, but this was not a major expansion. Native species occurrence remained relatively constant throughout the duration of the study. Potamogeton crispus occurrence in the nontreated plot remained similar from the initial survey (24%) to the 5-wk survey (21%). However, by the 52-wk survey, the presence of P. crispus had increased to 83% in the nontreated plot. These results confirm the need of a thorough understanding of the life history of this species for management strategies to be effective in Pacific Northwest reservoirs. Total species richness in this plot also increased from the initial survey to the 52-wk survey, most likely due to the increased presence of nonnative species such as P. crispus.
Although native species richness did not change in the nontreated plot over the duration of the study, the longer nonnative species such as Myriophyllum spicatum are left unmanaged, the greater the probability of impacts to the native plant community. In Lake George, NY, M. spicatum spread from 30% coverage to more than 95% coverage at a monitoring site (Madsen et al. Reference Madsen, Sutherland, Bloomfield, Eichler and Boylen1991). The increase in M. spicatum coverage resulted in a significant decline in native plant species density (Madsen et al. Reference Madsen, Sutherland, Bloomfield, Eichler and Boylen1991). The occurrence of native species was also reduced in the presence of M. spicatum in Waneta Lake and Lamoka Lake, NY (Madsen et al. Reference Madsen, Stewart, Getsinger, Johnson and Wersal2008). Aquatic plant surveys in Lake Pend Oreille, ID, indicated total species richness was significantly less in nontreated areas than in areas that had received herbicide applications the previous year (Madsen and Wersal Reference Madsen and Wersal2009; Madsen et al. Reference Madsen, Wersal and Woolf2015; Wersal et al. Reference Wersal, Madsen, Woolf and Eckberg2010). These studies suggest that there may be a trade-off in short-term effects of herbicides on the native plant community (Getsinger et al. Reference Getsinger, Turner, Madsen and Netherland1997) or long-term reductions in native species from the growth of M. spicatum.
The water-exchange processes associated with run-of-the-river hydroelectric power reservoirs presents a unique challenge for managing nuisance aquatic plants species via submersed herbicide applications. The results of this study indicate that when applications of RWT dye plus herbicide were strategically timed to coincide with minimum dam discharge patterns, the whole-plot RWT dye half-life resulted in nearly a 15-fold increase compared with the RWT dye–only treatment during peak dam discharge. This approach highlights the linkage of in situ water-exchange information with trends in dam operations, water discharge schedules, and herbicide CET data for improved efficacy and selectivity in the management of M. spicatum and P. crispus. Future operational-scale research on run-of-the-river reservoirs and hydrodynamic systems is needed to further support these findings.
Acknowledgments
The project was conducted as part of the Aquatic Plant Control Research Program (APCRP) and was funded through appropriations from the Department of the Army Appropriation No. 96X3122, Construction General, the Sanders County Eurasian Watermilfoil Task Force, and the Aquatic Ecosystem Restoration Foundation. This research was supported in part by the U.S. Department of Agriculture–Agricultural Research Service. Mention of trade names or commercial products in this publication is solely for the purpose of providing specific information and does not imply recommendation or endorsement by the U.S. Department of Agriculture. Additional logistical support and cooperation for this work were provided by the Sanders County Eurasian Watermilfoil Task Force, Sanders County Commissioners, Montana State University Extension Service/Sanders County, Montana Department of Agriculture, Avista Utilities, Montana Fish Wildlife and Parks, Noxon Cabinet Shoreline Coalition, Green Mountain Conservation District, U.S. Forest Service, Confederated Salish and Kootenai Tribe, Tri-State Water Quality Council, Sanders County Weed District, U.S. Army Engineer District, Seattle, Clean Lakes, Inc., and Aquatic Ecosystem Restoration Foundation. United Phosphorous Ltd. provided the aquatic herbicides for the project. Cygnet Enterprises Northwest, Inc., provided herbicide transportation and storage for the project. Special thanks are extended to Brian Burky, John Halpop, Celestine Duncan, Heidi Sedivy, David Sisneros, Tom McNabb, Tom Moorhouse, and Jill Winfield. This work is dedicated to the memory of Barb Mullin, a pioneer and leader in invasive plant management activities in Montana for many years.
Conflicts of interest
No conflicts of interest have been declared.