

Management Implications
By altering biomass structure, invasion of nonnative grasses has changed fuels and fire behavior in drylands. Modeling fuels and many other features of nonnative plants requires estimates of biomass, which can be time-consuming or infeasible to measure directly. As an alternative, this study developed regression equations to estimate biomass from the rapid, nondestructive measure of plant cover for Bromus rubens (red brome), a pervasive, nonnative annual grass in the Mojave Desert, USA. For every doubling of B. rubens cover, predicted B. rubens biomass increased by 78% to 144% among sites. In applying the equations to estimate fire-risk thresholds of hazardous fuels using cover, a provisional threshold of 100 g m−2 of B. rubens biomass required for fire spread was exceeded at 19%, 25%, and 45% B. rubens cover among sites. The equations, and suggested refinements in future work, may be helpful for rapidly estimating fuel loads and assessing effectiveness of invasive plant management, including levels required to keep fuels below wildfire spread risk thresholds. Accompanying the equations, a photographic guide showing cover classes and their associated biomass is provided.
Introduction
As a key measure of ecosystems, plant biomass is needed to model features such as productivity, forage availability, carbon storage, and fuel loads (Chieppa et al. Reference Chieppa, Power, Tissue and Nielsen2020). In invasive plant science and management, biomass estimates for nonnative plants can quantify species dominance, how invasions alter ecosystem productivity, and effectiveness of management actions such as reducing hazardous fuels produced by nonnative plants (Casady et al. Reference Casady, van Leeuwen and Reed2013). However, measuring biomass is time-consuming, typically can only be done in small areas, and requires destructive sampling (Axmanová et al. Reference Axmanová, Tický, Fajmonova, Hájková, Hettenbergerová, Li, Merunková, Nejezchlebová, Otýpková, Vymazalová and Zelený2012). Destructive sampling can be undesirable for many reasons, including possible alteration of habitats under study. Double sampling, by sampling an easier-to-measure proxy correlated with a variable of interest, can enable constructing allometric equations for estimating variables harder to measure directly, such as biomass (Ónodi et al. Reference Ónodi, Kertész, Kovács-Láng, Ódor, Botta-Dukát, Lhotsky, Barabás, Mojzes and Kröel-Dulay2017). Being comparatively fast and nondestructive to measure, plant cover could be an ideal proxy for estimating biomass. Not all species are suited for estimating biomass from cover, however, and consistency of cover–biomass relationships varies among species (e.g., Humphrey Reference Humphrey1985; MacDonald et al. Reference MacDonald, Burke, Chen and Prepas2012; Tausch Reference Tausch1989). As a result, assessing which species and growth forms have reliable cover–biomass relationships, developing new biomass equations for species without known relationships, and refining existing equations (e.g., tailoring to site factors or climatic variability) represent an active research area (e.g., Chieppa et al. Reference Chieppa, Power, Tissue and Nielsen2020; Ónodi et al. Reference Ónodi, Kertész, Kovács-Láng, Ódor, Botta-Dukát, Lhotsky, Barabás, Mojzes and Kröel-Dulay2017; Rudgers et al. Reference Rudgers, Hallmark, Baker, Baur, Hall, Litvak, Muldavin, Pockman and Whitney2019).
Cover–biomass equations could be useful in modeling potential fire behavior in ecosystems where invasive plants are altering biomass structure and, in turn, changing fire behavior. One such ecosystem is the desert Southwest of North America, where widespread invasion by nonnative perennial and annual grasses has changed the amount, spatial continuity, and characteristics of biomass and resulting fuel (Casady et al. Reference Casady, van Leeuwen and Reed2013). In the Mojave Desert, for example, increases in the nonnative annual red brome (Bromus rubens L.) correlated with increasing wildfire extent at low- to mid-elevations previously considered to be fuel-limited and not to have burned extensively (Brooks et al. Reference Brooks, Minnich, Matchett, van Wagtendonk, Sugihara, Stephens, Thode, Shaffer and Fites-Kaufman2018). These wildfires devastate native mature shrubland communities (Van Linn et al. Reference Van Linn, Nussear, Esque, DeFalco, Inman and Abella2013). Rao and Allen (Reference Rao and Allen2010) proposed a provisional threshold of 100 g m−2 of B. rubens fuel required for fire spread in these ecosystems, while noting uncertainties and a need for further modeling of fuels and fire behavior in grass-invaded desert ecosystems. Accurate estimates of biomass as fuel are required for these fire-modeling purposes, including among sites and years differing in productivity. The objective of this study was to assess the feasibility of developing cover–biomass regression equations for B. rubens at three sites, including one measured for three consecutive years, and to evaluate sensitivity of results to using cover classes as opposed to using simulated random distribution of integer cover within classes.
Materials and Methods
Focal Invasive Species
Bromus rubens is native to shrubland and steppe habitats of southern Europe, northern Africa, and southwestern Asia (Brooks Reference Brooks, Bossard, Randall and Hoshovsky2000). The species became established in North America by the late 1800s and invaded the Mojave Desert by the mid-1900s (Salo Reference Salo2005). It is currently the most abundant annual species across much of the Mojave Desert, often forming at least 50% to 75% of the annual plant biomass (Smith et al. Reference Smith, Charlet, Zitzer, Abella, Vanier and Huxman2014). Bromus rubens is competitive by germinating under drier conditions than many native species, growing faster and larger (up to 25 to 40 cm tall) than most native annuals, forming large soil seedbanks comprising over 90% of the total seedbank on burned areas, and extracting resources at high rates (Jurand and Abella Reference Jurand and Abella2013; Smith et al. Reference Smith, Charlet, Zitzer, Abella, Vanier and Huxman2014). As a winter annual, B. rubens germinates after autumn to early winter rains beginning in October, grows in winter and spring, and produces seed in March through mid-May depending on the year and site (Beatley Reference Beatley1966). While disturbance (e.g., wildfire) can promote B. rubens, the species can invade mature shrublands (Smith et al. Reference Smith, Charlet, Zitzer, Abella, Vanier and Huxman2014).
Data Collection
Data were gathered at three sites (detailed in Supplementary Appendix S1) in the eastern Mojave Desert, USA. The sites spanned an extent of 148 km, were at least 61 km apart, and contained desert shrubland. The northeastern site, in northwestern Arizona in Grand Canyon-Parashant National Monument (hereafter Parashant), was at an elevation of 1,060 m and was burned by wildfire in 2006, 3 yr before data collection. The centrally located site was in Lake Mead National Recreation Area (hereafter Mead) in southern Nevada at an elevation of 381 m. At an elevation of 1,190 m, the southwestern site (hereafter Goodsprings) was also in southern Nevada.
At the time of peak biomass (March to May among years), B. rubens cover data and aboveground biomass were collected within 0.5 m by 0.5 m or 2 m by 2 m quadrats at each site, with 72 quadrats at Parashant and 30 each at Mead and Goodsprings (Supplementary Appendix S1). Aerial cover of B. rubens in each quadrat was categorized using Peet et al. (Reference Peet, Wentworth and White1998) cover classes: trace (assigned 0.1%), 0.1% to 1%, 1% to 2%, 2% to 5%, 5% to 10%, 10% to 25%, 25% to 50%, 50% to 75%, 75% to 95%, and 95% to 100% (Supplementary Appendix S2 provides a photo guide to cover classes). Aerial cover was defined as the vertical projection of vegetation from the ground as viewed from above and thus could not exceed 100% (Elzinga et al. Reference Elzinga, Salzer and Willoughby1998). Any aboveground part of a B. rubens plant (stem, leaves, or seed heads) could contribute to aerial cover, as long as the plant part was not underneath the species’ plant material overlapping above that had already covered the ground in that part of the vertical projection. After cover was recorded, all aboveground B. rubens material (including live green and senescing) was harvested by clipping at ground level. The material from each quadrat was placed in paper bags, heated in an electric oven at 60 to 70 C for 24 to 72 h until constant weight, and weighed.
Data were collected annually from 2011 to 2013 at Parashant, in 2010 at Mead, and in 2020 at Goodsprings. Based on a weather station 30 km from Parashant (Supplementary Appendix S1), precipitation during the hydrological year (October through April) for winter annuals (including B. rubens) during the study period was 20.4 cm (159% of the 12.9 cm year−1 October through April 2007 to 2019 average) for the hydrological year ending in 2011, 13 cm (101%) in 2012, and 8.4 cm (65%) in 2013. At Mead, based on a weather station 32 km from the site, precipitation from October 2009 through April 2010 preceding data collection totaled 9 cm (133% of the 7-cm average). Weather stations at comparable elevations with complete records were farther from Goodsprings, and a station 60 km from the site at a comparable elevation (1,079 m, 111 m lower than the site) reported that October 2019 through April 2020 precipitation was 21 cm, 175% of the 12-cm average for that period (Supplementary Appendix S1).
Statistical Analysis
To estimate aboveground B. rubens biomass (g m−2 oven-dried weight) for each site using the independent variable percent cover (midpoints input for cover classes), linear regression was used in PAST 4.02 (Hammer Reference Hammer2020). The X and Y were log10 transformed, as is common in allometric research to linearize relationships (Catchpole and Wheeler Reference Catchpole and Wheeler1992). For Parashant, with 3 yr of data, log-transformed B. rubens biomass on quadrats was not consistently strongly related among years (r2 = 0.07 for 2011:2012, 0.10 for 2011:2013, and 0.34 for 2012:2013), so regressions were computed with all 3 yr combined and for each year separately. Residuals in regressions generally approximated homoscedasticity based on distributions of residuals and Breusch-Pagan tests (Hammer Reference Hammer2020). Coefficients of determination, P-values for testing if coefficients differed from zero, and 95% confidence bands (Working-Hotelling procedure) around regression lines were calculated for each regression. Slopes of regressions were compared among the three sites (using the combined-years regression for Parashant) and among the 3 yr at Parashant using analysis of covariance (Andrade and Estévez-Pérez Reference Andrade and Estévez-Pérez2014). To assess sensitivity of regression results to using midpoints of cover classes as compared with using integers, regressions were computed for each site for three randomizations in which integer cover (1% increments except for trace, retained as 0.1%) was randomly assigned within the range of the cover class recorded for each quadrat. Regression slopes were then compared among the cover class–based and the three integer–randomized, within-class regressions for each site using analysis of covariance. The Snowdon (Reference Snowdon1991) correction factor was used to apply log-transformed regressions by back transforming predicted values into the original units (g m−2 biomass) and to account for logarithmic bias in the back transformation.
Results and Discussion
Ranges of Bromus rubens Variables and Estimating Equations
The data set encompassed a broad range of B. rubens cover and aboveground biomass, with the ranges similar among the three sites (Supplementary Table S1). At Parashant, B. rubens cover ranged from 0.1% to 75% and biomass from 0.8 to 314.4 g m−2. Similarly, B. rubens cover ranged from 1.5% to 85% and biomass from 1.0 to 315.2 g m−2 at Mead. At Goodsprings, B. rubens cover ranged from 0.1% to 85% and biomass from 0.9 to 320.6 g m−2.
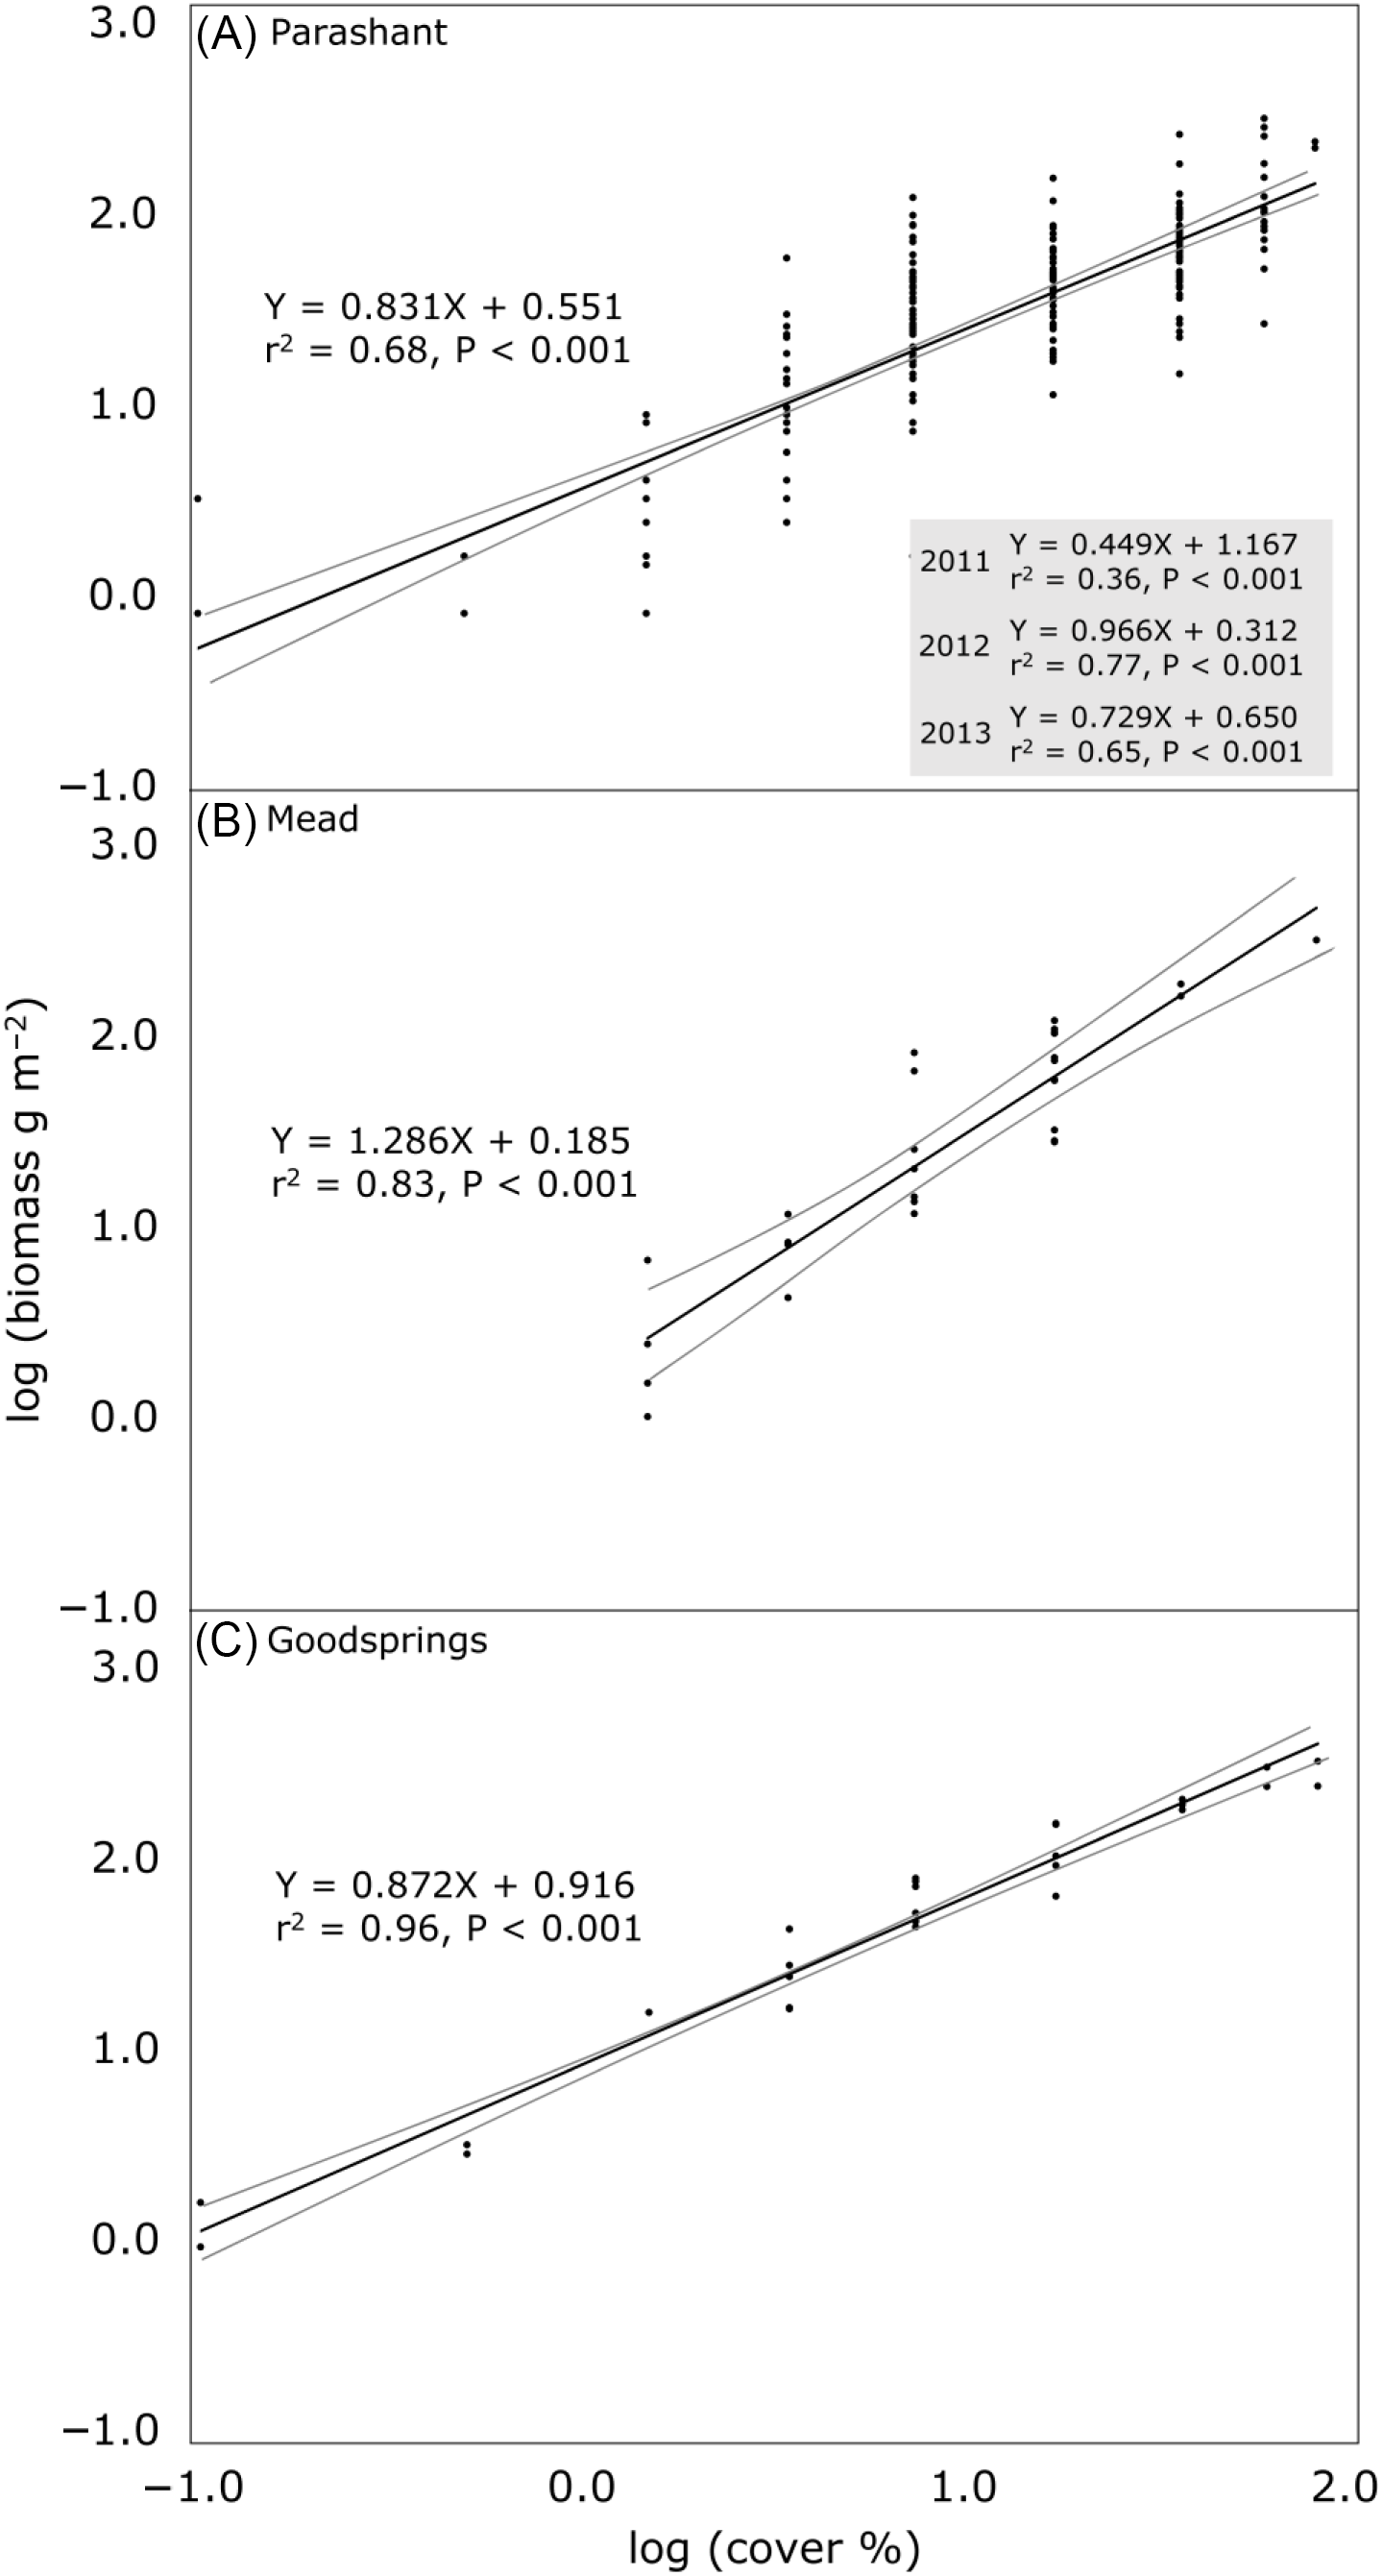
Cover accounted for 68% to 96% of the variance in biomass in regressions among sites, with all coefficients of determination significant at P < 0.05 (Figure 1). Regression slopes differed overall among sites (F = 6.685, P = 0.001), with the slope at the Mead site differing from the other two sites. In applying back-transformed equations, for every doubling of percent cover, biomass was predicted to increase by 78% at Parashant, 144% at Mead, and 83% at Goodsprings. For example, at Goodsprings, an increase in cover from 10% to 20% would be predicted to increase biomass from 58 to 106 g m−2. A provisional threshold of 100 g m−2 of B. rubens biomass required for fire spread was predicted to be exceeded at 19%, 25%, and 45% B. rubens cover at Goodsprings, Mead, and Parashant, respectively.

Figure 1. Relationships between cover and aboveground biomass (with both log10 transformed) of an invasive annual grass, Bromus rubens, at three sites in the Mojave Desert, USA. Black lines are regression lines, with gray lines showing 95% confidence bands. The regression using all years (2011, 2012, and 2013) is shown in A, along with equations separately by year in the inset box. Equations are of the form log10 Y = m(log10 X) + b, where m is the slope, b is the Y intercept, and r2 is the coefficient of determination for the logarithmic equation. Standard errors for slopes are as follows: (A) 0.039 (all years), 0.072 (2011), 0.063 (2012), 0.064 (2013); (B) 0.109; and (C) 0.035. To apply the equations by back transforming predicted biomass into the original measurement units of g m−2 and correcting for logarithmic bias in the predicted estimates, compute 10(m(logX)+b) and multiply this by the Snowdon (Reference Snowdon1991) correction factor (ratio of the means of the measured to the uncorrected estimates of predicted biomass, all in the original units of g m−2) specific to each regression. Correction factors for each regression are as follows: (A) 1.176 (all years), 1.251 (2011), 1.092 (2012), 1.138 (2013); (B) 1.027; and (C) 0.946. As an example calculation, 10% B. rubens cover (log10 transformed = 1) in C would be predicted to produce 58 g m−2 of biomass via computing 10(0.872(1)+0.916) and multiplying by the 0.946 correction factor. Supplementary Table S1 contains the raw data.
Among years at Parashant, cover accounted for 36% to 77% of the variance in biomass, with the lowest coefficient of determination in 2011, the wettest year (Figure 1, inset). All years exhibited regression slopes unique from each other (F = 12.627, P < 0.001).
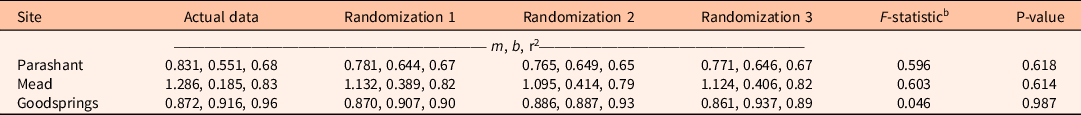
Regression results were insensitive to using cover classes compared with simulated randomized integer cover within cover classes (Table 1). Slopes did not differ for cover class or randomized-integer regressions at any of the three sites.
Table 1. Sensitivity analysis of linear regression equations estimating biomass of the invasive annual Bromus rubens at three sites for which predictors are log-transformed cover classes of B. rubens (actual data) compared with three randomizations in which log-transformed integer percent covers were randomly assigned within actual data, log-transformed cover classes.a

a Equations are of the form log10 Y = m(log10 X) + b, where Y is log-transformed aboveground biomass in g m−2, X is log-transformed cover in %, m is the slope, b is the Y intercept, and r2 is the coefficient of determination.
b F-statistics and P-values from analysis of covariance compare regression slopes across actual data and randomizations within sites.
Factors in Cover–Biomass Relationships
Bromus rubens biomass appears amenable to estimation from cover. This supports Alaback’s (Reference Alaback1986) idea that species (such as B. rubens) with prostrate, compact morphology or monolayer canopies have more consistent cover–biomass relationships than species variably forming monolayer to complex, multilayered canopies. Three additional features of B. rubens morphology could influence cover–biomass relationships: plant height, reproductive allocation, and extent of basal foliage. Theoretically, increasing height of plants should shift biomass estimates using aerial cover upward or steepen slopes of cover–biomass regression lines (Hermy Reference Hermy1988). This may not occur, however, if other morphological trade-offs accompany the increase in height that keep biomass per plant constant and do not affect cover. In terms of consistency of biomass estimates, including plant height with cover has not necessarily increased coefficients of determination (Chieppa et al. Reference Chieppa, Power, Tissue and Nielsen2020). Some authors noted that recording an average height of a group of plants might not improve biomass estimation, such as when height distribution among individuals is bimodal, and that measuring the height of each individual plant could be as time-consuming as simply measuring biomass directly (Axmanová et al. Reference Axmanová, Tický, Fajmonova, Hájková, Hettenbergerová, Li, Merunková, Nejezchlebová, Otýpková, Vymazalová and Zelený2012; Chieppa et al. Reference Chieppa, Power, Tissue and Nielsen2020; Muukkonen et al. Reference Muukkonen, Mäkipää, Laiho, Minkkinen, Vasander and Finér2006). While being inclusive of assessing these considerations, evaluating in future research whether including height as a covariate improves cover–biomass equations is warranted, because average height of mature B. rubens can vary at least threefold among sites and likely with differences in weather, competition, and genetics (Wu and Jain Reference Wu and Jain1978). Considering reproductive allocation and the ascending seed heads of B. rubens (Brooks Reference Brooks, Bossard, Randall and Hoshovsky2000), increasing reproductive allocation should increase both cover and biomass. Seed heads can form much of the cover and around two-thirds of the aboveground mass of B. rubens (Huxman et al. Reference Huxman, Hamerlynck and Smith1999). In B. rubens clumps, basal foliage could shift biomass estimates downward or decrease slopes of cover–biomass regressions by increasing cover, but not necessarily weight much, compared with prostrate stems with heavy seed heads (MacDonald et al. Reference MacDonald, Burke, Chen and Prepas2012).
Within sites, considerations related to sampling design and measurement scale could influence construction of cover–biomass equations. First, stratifying sampling within sites by dominant microsites may enhance efficiency, as B. rubens biomass can be an order of magnitude greater in shaded, nutrient-enriched soils below native shrubs compared with open interspaces between shrubs (Smith et al. Reference Smith, Charlet, Zitzer, Abella, Vanier and Huxman2014). Whether cover–biomass relationships differ between microsite types is not known, however, nor is whether any benefits are worth the complexity added to the analytical design. These trade-offs may hinge on whether estimates by microsite or on a site basis are desired. Second, using cover classes, with procedures to enhance reproducibility (e.g., consistently defining cover, minimizing observer bias), is a standard method for vegetation inventory and is common in cover–biomass allometry (e.g., Axmanová et al. Reference Axmanová, Tický, Fajmonova, Hájková, Hettenbergerová, Li, Merunková, Nejezchlebová, Otýpková, Vymazalová and Zelený2012; Hermy Reference Hermy1988; Ónodi et al. Reference Ónodi, Kertész, Kovács-Láng, Ódor, Botta-Dukát, Lhotsky, Barabás, Mojzes and Kröel-Dulay2017). However, possible influences of using cover classes compared with using integer covers in cover–biomass regressions are not well understood. At least in this study, cover classes and simulated random distributions of integer cover within classes returned nearly identical results. With 10 cover classes, the number of classes used in this study could be considered moderately large, raising a question as to what the minimum number of cover classes is for reliable biomass estimation. This could potentially be addressed by measuring cover on a fine-resolution integer scale (or decimal subdivisions at low cover) and applying different scenarios of cover classes as inputs to regressions.
While results suggest that B. rubens biomass is amenable to estimation from cover across a range of site conditions and rainfall years, thus addressing the study objective of assessing feasibility for the species, determining whether sets of generalizable equations could be developed or whether site- or year-specific equations are needed for reliable estimates requires further research. Results did demonstrate that regression slopes, coefficients of determination, and covers corresponding with a threshold for fire spread of 100 g m−2 of B. rubens fuel (Rao and Allen Reference Rao and Allen2010) could vary significantly among sites and years at a site. At Parashant, cover accounted for the least variation in biomass during the moistest year (2011). One possible explanation for this could be that in moist years, more locations exhibit higher cover classes of B. rubens. As aerial cover has a fixed maximum (100%), while biomass does not, variability in biomass in the higher cover classes could temper reliability of estimating biomass from cover (Axmanová et al. Reference Axmanová, Tický, Fajmonova, Hájková, Hettenbergerová, Li, Merunková, Nejezchlebová, Otýpková, Vymazalová and Zelený2012). Although B. rubens is nearly ubiquitously distributed in the Mojave Desert, site factors such as elevation, topography, soil fertility, and recent fire history influence the species’ abundance (Abella et al. Reference Abella, Embrey, Schmid and Prengaman2012). To what extent these site factors may consistently affect cover–biomass relationships is not clear, however, given the major influence of precipitation among years (Beatley Reference Beatley1966). It is possible that cover–biomass relationships on edaphically productive sites in low-rainfall years are similar to relationships on edaphically unproductive sites in high-rainfall years. Exploring these types of possible interactions may facilitate sets of cover–biomass equations from low to high site productivity and rainfall categories as a compromise between generalizability and local calibration of equations (Catchpole and Wheeler Reference Catchpole and Wheeler1992). Results suggest promise for estimating biomass from cover for nonnative annual grasses.
Acknowledgments
The Bureau of Land Management (Arizona Strip District) and the Joint Fire Science Program funded data collection at the Parashant National Monument and Lake Mead National Recreation Area sites through cooperative agreements with the University of Nevada Las Vegas (UNLV). The California Fire Science Consortium supported analysis and writing. Research staff with UNLV collected data at the Parashant and Lake Mead sites. Federal cooperators K. Harcksen, A. Newton, Lake Mead native plant nursery staff, and L. Kobelt assisted with permits and maintenance of the research sites. The associate editor and two anonymous reviewers provided helpful comments. No conflicts of interest have been declared.
Supplementary material
To view supplementary material for this article, please visit https://doi.org/10.1017/inp.2020.33