

Management Implications
Plants in the riparian zone are an essential component of ecosystem health, providing key services, including erosion control and filtration of surface runoff. However, waterways often serve as a source of species’ introductions, making riparian communities important areas for targeted invasive species control. Additionally, roadside introductions of invasive species are quite common, with roads serving as corridors for introductions and facilitators for invasive species spread. Using a citizen science project with many volunteer monitors, we surveyed the riparian invasive community compositions of 10 common nonnative riparian species in the upper Hudson River Valley watershed: Alliaria petiolata (garlic mustard), Lythrum salicaria (purple loosestrife), Phragmites australis (common reed), Polygonum cuspidatum (Japanese knotweed), Rosa multiflora (multiflora rose), Hesperis matronalis (dame’s rocket), Celastrus orbiculatus (Asiatic bittersweet, oriental bittersweet), Rubus phoenicolasius (wineberry), Microstegium vimineum (Japanese stiltgrass), and Berberis spp. (barberry species). Our citizen science project yielded information on the distribution of target species within our landscape and the associations with land use variation, including increased numbers of target species in sites closer to roads and lower numbers of species in sites with a highly forested basin. These citizen science data were used to draft a watershed management plan and after being made publicly available, have been used in multiple synthesis projects evaluating invasive plants. This work highlights the utility of targeted, trained volunteer monitors in understanding local variability in riparian invasive plants and fostering public engagement in invasive species planning.
Introduction
Riparian plant species are essential components of the riparian zone, contributing to the flow of water, nutrients, and sediments within watersheds (Gregory et al. Reference Gregory, Swanson, McKee and Cummins1991; Hood and Naiman Reference Hood and Naiman2000; Nilsson and Svedmark Reference Nilsson and Svedmark2002; Peterjohn and Correll Reference Peterjohn and Correll1984). Riparian vegetation communities serve as a critical boundary between terrestrial and aquatic ecosystems, provide a variety of ecological services, and facilitate key ecosystem processes (Cummins et al. Reference Cummins, Wilzbach, Gates, Perry and Taliaferro1989; Gregory et al. Reference Gregory, Swanson, McKee and Cummins1991; Groffman et al. Reference Groffman, Bain, Band, Belt, Brush, Grove, Pouyat, Yesilonis and Zipperer2003; Naiman et al. Reference Naiman, Decamps and Pollock1993; Sabo et al. Reference Sabo, Sponseller, Dixon, Gade, Harms, Heffernan, Jani, Katz, Soykan, Watts and Welter2005; Tickner et al. Reference Tickner, Angold, Gurnell and Mountford2001). However, the same factors that make riparian zones key components of ecosystems can also facilitate the introduction of exotic species (Hood and Naiman Reference Hood and Naiman2000; Naiman et al. Reference Naiman, Decamps and Pollock1993; Richardson et al. Reference Richardson, Holmes, Esler, Galatowitsch, Stromberg, Kirkman, Pyšek and Hobbs2007). Streams provide a corridor for the rapid transportation of invasive species to novel and often uninvaded areas—an indication that riparian restoration activities must be ongoing and must occur across large swaths of a watershed to maintain control over the establishment and spread of invasive plants (Bradford et al. Reference Bradford, Schumacher, Catovsky, Eggers, Newingtion and Tordoff2007; Kauffman et al. Reference Kauffman, Beschta, Otting and Lytjen1997; Lecerf et al. Reference Lecerf, Patfield, Boiché, Riipinen, Chauvet and Dobson2007; Richardson et al. Reference Richardson, Holmes, Esler, Galatowitsch, Stromberg, Kirkman, Pyšek and Hobbs2007; Shafroth and Briggs Reference Shafroth and Briggs2008; Tickner et al. Reference Tickner, Angold, Gurnell and Mountford2001). Riparian zones in urbanized, disturbed, and human-altered landscapes are particularly vulnerable to invasive species colonization (Hood and Naiman Reference Hood and Naiman2000; Maskell et al. Reference Maskell, Bullock, Smart, Thompson and Hulme2006; Parendes and Jones Reference Parendes and Jones2000; Pyšek and Prach Reference Pyšek and Prach1993).
The risks of invasive plant species colonization in riparian zones can be increased by human alterations, including dams (Jansson et al. Reference Jansson, Nilsson, Dynesius and Andersson2000; Nilsson and Svedmark Reference Nilsson and Svedmark2002); land use change (Hancock et al. Reference Hancock, Ladd and Froend1996; Patten Reference Patten1998); and impervious surfaces, particularly roads (Mortensen et al. Reference Mortensen, Rauschert, Nord and Jones2009; Parendes and Jones Reference Parendes and Jones2000). These features modify the hydrologic regime in a watershed by increasing the water temperature, altering nutrient and salinity profiles, and impacting the duration and frequency for both flooding and low-flow events (Auble et al. Reference Auble, Friedman and Scott1994; Fitch et al. Reference Fitch, Craver and Smith2008; Kelly et al. Reference Kelly, Panno and Hackley2012; Paul and Meyer Reference Paul and Meyer2001; Rood and Heinze-Milne Reference Rood and Heinze-Milne2011; Walsh et al. Reference Walsh, Roy, Feminella, Cottingham, Groffman and Morgan2005).
Microhabitats in the riparian zone are caused by variability in hydrologic regimes, stream bank erosion, forest integrity, and elevation (Casanova and Brock Reference Casanova and Brock2000; Naiman and Décamps Reference Naiman and Décamps1997; Pauchard and Alaback Reference Pauchard and Alaback2004; Yang et al. Reference Yang, Dilts, Condon, Turner and Weisberg2011). These microhabitats allow for variability in community composition and the coexistence of riparian plant species with different germination abilities, as well as contrasting light availability, temperature, and soil requirements. These biological and physiological characteristics of riparian invaders can lead to divergent responses to management actions taken to restore riparian zones and prevent species colonization, particularly forest restoration.
Citizen science is an increasingly popular tool for the surveillance, identification, and mitigation of invasive species threats (César de Sá et al. Reference César de Sá, Marchante, Marchante, Cabral, Honrado and Vicente2019; Crall et al. Reference Crall, Newman, Stohlgren, Holfelder, Graham and Waller2011, Reference Crall, Jordan, Holfelder, Newman, Graham and Waller2013, Reference Crall, Jarnevich, Young, Panke, Renz and Stohlgren2015; Gallo and Waitt Reference Gallo and Waitt2011). Further, volunteer monitors can provide data coverage for regions that are overlooked in intensive federal and expert-led large-scale invasive plant monitoring programs (Kallimanis et al. Reference Kallimanis, Panitsa and Dimopoulos2017; Stohlgren Reference Stohlgren2006). These data can support local management plans, particularly because mitigation efforts can be disrupted and thwarted by lack of complete data on regional distribution of invasive plant species (Jarnevich et al. Reference Jarnevich, Stohlgren, Barnett and Kartesz2006). Despite concerns about data quality (Hochmair et al. Reference Hochmair, Scheffrahn, Basille and Boone2020; Lukyanenko et al. Reference Lukyanenko, Parsons and Wiersma2016), citizen science can often provide high-quality, cost-effective estimates when paired with training or expert oversight mechanisms (Theobald et al. Reference Theobald, Ettinger, Burgess, DeBey, Schmidt, Froehlich, Wagner, HilleRisLambers, Tewksbury, Harsch and Parrish2015; Tulloch et al. Reference Tulloch, Possingham, Joseph, Szabo and Martin2013).
In this study, we evaluate the occurrence of target invasive species in the riparian zone of 20 stream sites in the Hudson River Valley region of New York State. We hypothesized that citizen scientists, with training, could collect reliable occurrence data for common invasive plant species and facilitate watershed monitoring in our region. We also hypothesized that the number of target invasive plant species found at each site would be related to the drainage area and distance to nearby roads, because a larger drainage source area and greater vehicle traffic can facilitate species’ introductions. We further hypothesized that there would be a relationship between drainage land use and the number of invasive species and that, in particular, a higher amount of forested land in the basin and lower amount of developed land in the basin would be associated with fewer target species. Finally, we hypothesized relationships among species occurrence, the site canopy cover, elevation, and mean annual runoff. We used the results of citizen science monitoring to inform our local site management, facilitate citizen scientist engagement in invasive species management, and supplement current water-quality sampling in local watersheds.
Materials and Methods
Study Area
Our 20 study sites were in the vicinity of Mohonk Preserve (Figure 1A), located 135 km north of New York City, in the Hudson River Valley. Four sites were selected based on nearby recreation/land use (Split Rock, Humpo Marsh, Lenape Lane, Pine Road), but others were selected based on access points and to cover the primary streams onsite at Mohonk Preserve (Sky Lake, Rosendale Larsen, Old Clove, Mossy Brook, Oakwood, Duck Pond, Van Leuven, Trapps). Mohonk Preserve is a nature preserve and land trust that protects more than 3,340 ha of the Shawangunk Mountains, a northern section of the Appalachian Mountains in Ulster County, New York (Garretson et al. Reference Garretson, Napoli, Feldsine, Adler-Colvin and Long2020). The Shawangunk Mountain bedrock is made up of sedimentary and low-grade metamorphic rock with a silica-cemented combination of sandstone and white quartz pebble, as well as a few occurrences of gneiss and granite (Abrams and Sands Reference Abrams and Sands2010; Feldman et al. Reference Feldman, Smoliga and Feldman2012).
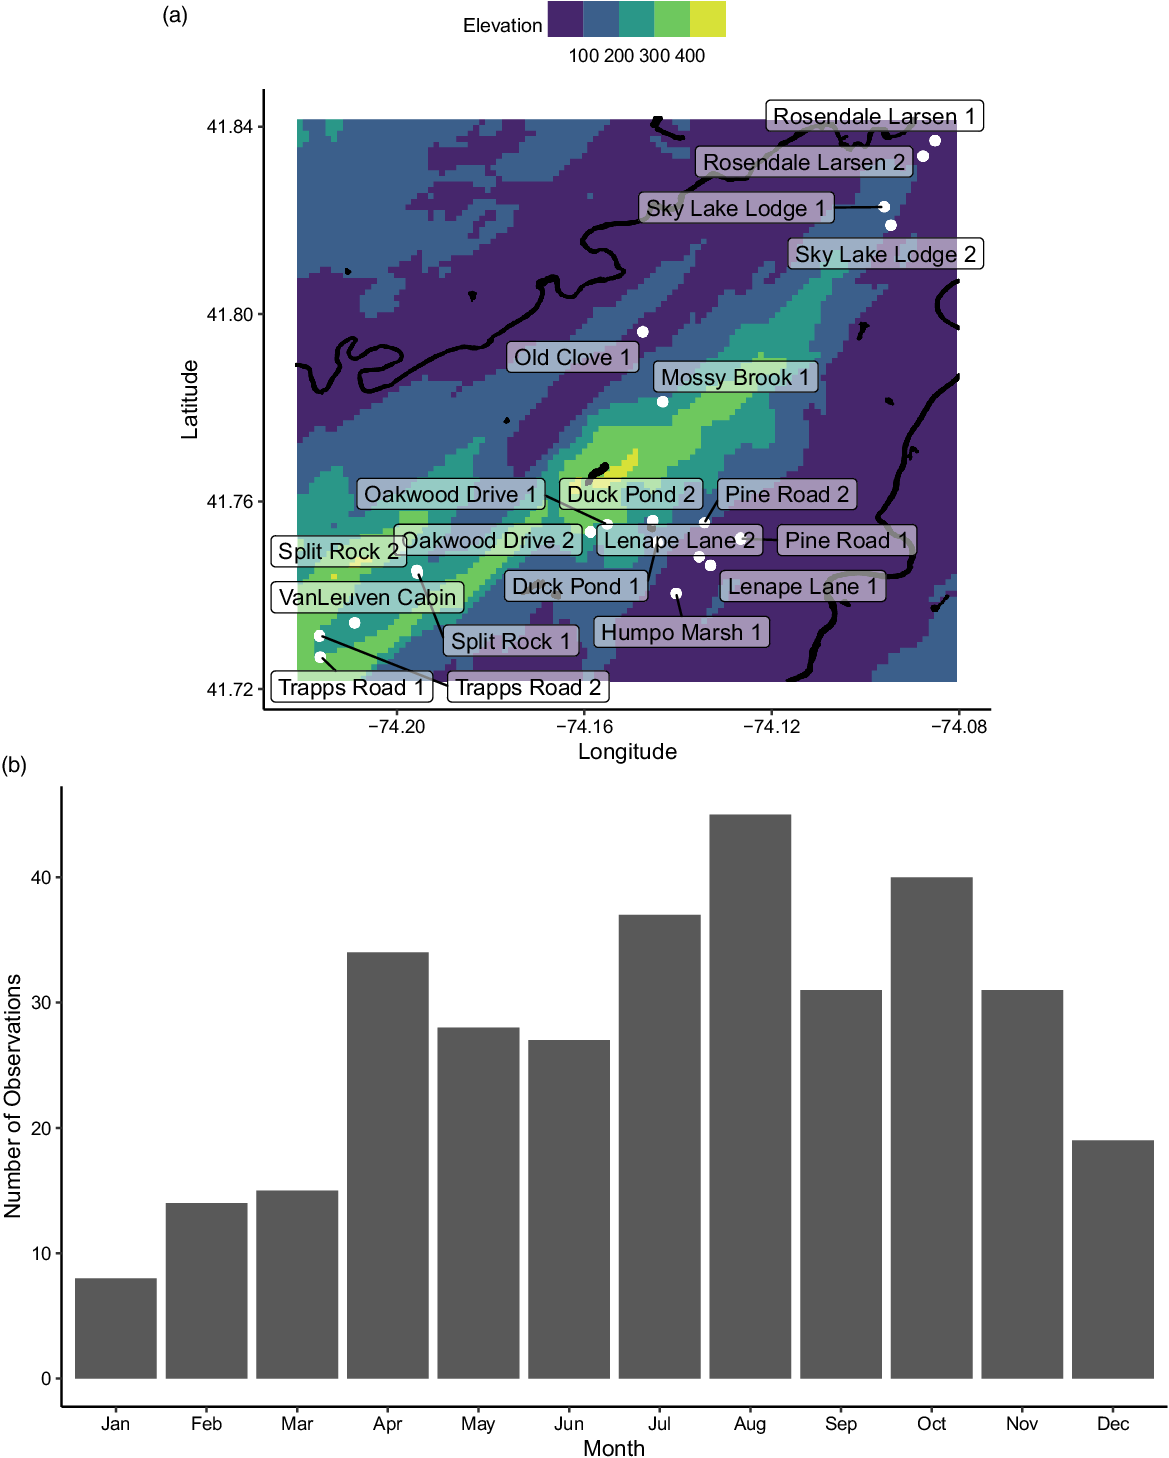
Figure 1. (A) Map of study sites (white) labeled with their names, including the major rivers and lakes (black) and the regional elevations (m). (B) The distribution of sampling events over the months of the year.
The region comprises approximately 15,380 ha of oak (Quercus L. spp.) forest, with about 1,400 ha of chestnut oak (Quercus montana Willd.) and red oak (Quercus rubra L.) forests in the Mohonk Preserve (Abrams and Sands Reference Abrams and Sands2010). Much of the land was never developed, although some was used as agricultural farmland before being placed into trust and regrowth being allowed to occur. The preserve lies approximately 380 m above sea level on a ridge above the Hudson River Valley, far from any urban heat island or large water bodies. The areas around the Shawangunks include multiple agricultural land use areas and Rondout Creek, a critical waterway for water supply in New York City. Management for the invasive species has involved hand-pulling Japanese knotweed species (Polygonum cuspidatum Siebold & Zucc., Polygonum sachalinense F. Schmidt ex Maxim., and Polygonum × bohemica) once per year over the past 2 yr at the Coxing Kill site. Presently, the Mohonk Preserve does not have an official Invasive Species Management Plan, although there is continual monitoring of the invasive plants onsite through multiple field surveys and citizen science projects.
Data Collection
Citizen scientists were recruited from the local community through the network of current volunteers, but also through social media, public presentations, and tabling events in the surrounding local communities. All volunteers were trained by staff members at their assigned sites; this included specific training in using pertinent field equipment, including a densitometer. Data were periodically reviewed by Conservation Science staff, and outlier observations were flagged for follow-up, which included discussion with citizen scientists about site conditions during their sampling events to ensure accuracy and, where necessary, additional confirmatory sampling by volunteers.
The full sampling protocol (including macroinvertebrate and stream condition observations) is available with the data package (Mohonk Preserve et al. Reference Mohonk Preserve, Garretson, Kathe, Long, Montoya, Napoli, Wander and Science Volunteers2020), but the invasive plant portions of the sampling protocol are summarized here: Citizen scientists observed the habitat directly adjacent to the sampling site and performed an invasive species assessment. The invasive species surveyed were Japanese knotweed (Polygonum cuspidatum Siebold & Zucc.), common reed [Phragmites australis (Cav.) Trin. ex Steud], purple loosestrife (Lythrum salicaria L.), multiflora rose (Rosa multiflora Thunb.), garlic mustard [Alliaria petiolata (M. Bieb.) Cavara & Grande], dame’s rocket (Hesperis matronalis L.), Asiatic bittersweet (Celastrus orbiculatus Thunb.), wineberry (Rubus phoenicolasius Maxim.), Japanese stiltgrass [Microstegium vimineum (Trin.) A. Camus], and barberry (Berberis thunbergii DC. and Berberis vulgaris L.); for the purposes of this study, citizen scientists were not asked to differentiate between B. thunbergii and B. vulgaris) (Table 1). Additionally, observers looked for an invasive algae, didymo [Didymosphenia germinata (Lyngb.) C. Agardh], but it was not found at any sites during the sampling period, although surveillance is ongoing.
Table 1. Invasive species in the Hudson River Valley watershed surveyed in this study. a
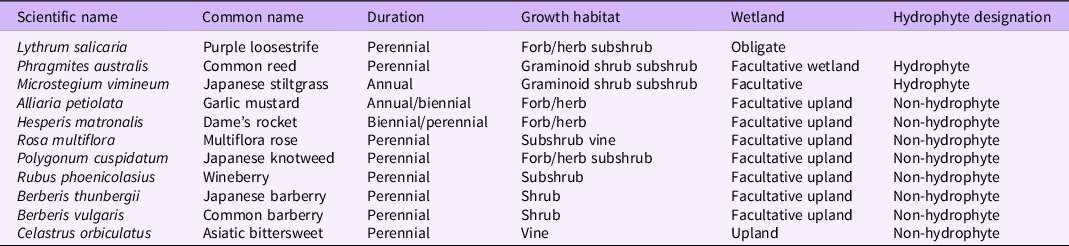
a Duration and growth habitat from USDA-NRCS (2020); wetland and hydrophyte designations from Lichvar et al. (Reference Lichvar, Butterwick, Melvin and Kirchner2014).
During each sampling event, volunteers visited the site and determined the abundance of the target invasive species within eyesight of the flagged location. Abundance was qualitatively assessed as “none” (no individuals of the target species were observed), “sparse” (10 or fewer individuals of the target species were observed), “some” (more than 10 individuals were observed but did not cover most of the ground), or “dense” (target species were covering the majority of the ground observed within eyesight of the flagged location and few other species were present). Because sampling frequency varied, in addition to assessing each of the observations independently, we used all sampling events for each site to produce a site-specific checklist of the number of target invasive plants observed there.
The citizen scientists also assessed the canopy cover of each sampling site using a densitometer. Volunteers assessed whether canopy cover was present in the target zone of the densitometer at 21 points along a streambank. Zero was the starting point at which they regularly sampled other parameters and then 10 m upstream and 10 m downstream with canopy cover measured every meter. If there was canopy cover present in the densitometer, a 1 was recorded, and then the total number of points where canopy cover was recorded was divided by the number of sampling points (10) to produce a percent cover.
In addition to these citizen science data, watershed boundaries were delineated for each study site using StreamStats (http://water.usgs.gov/osw/streamstats; Ries et al. Reference Ries, Guthrie, Rea, Steeves and Stewart2008), allowing us to aggregate hydrologic, geomorphological, and land use data specific to each sampling site. We then used the delineated boundaries to query the National Land Cover Database 2011 map (https://www.mrlc.gov/data/nlcd-2011-land-cover-conus; Homer et al. Reference Homer, Dewitz, Yang, Jin, Danielson, Xian, Coulston, Herold, Wickham and Megown2015) and calculate the percentage of forested land use in the basin area. NLCD 2011 uses a 16-class land cover classification with a spatial resolution of 30 m2 (size of one pixel). We also extracted the total drainage area to the sampling point using StreamStats. For each site, we also determined the distance to the nearest road, using the Natural Earth North America Roads and Highways dataset, accessed through the UCLA geoportal (https://apps.gis.ucla.edu/geodata/dataset/north-america-roads-and-highways).
Finally, we used the PLANTS database from the USDA and the National Wetland Plant List: 2014 wetland ratings to determine the regional wetland indicator status for each of the surveyed plant species (Lichvar et al. Reference Lichvar, Butterwick, Melvin and Kirchner2014; USDA-NRCS 2020; Table 1). These designations describe the tendency of a plant species to occur in a wetland or upland habitat and include obligate, facultative wetland, facultative, facultative upland, and upland species.
Statistical Analysis
We performed all analyses in R v. 4.0.2 (R Core Team 2016). To evaluate the relationships between the number of target species, we built a site-level model, with the number of detected target species as a function of the drainage area size, the distance to the closest road, the percent of the basin that is forested, the elevation of the site, and the mean basin slope. We used stepwise model selection, both backward and forward, to determine the best-fit model for the total number of target species, the total number of hydrophyte target species, and the total number of non-hydrophyte target species. To check for multicollinearity, we calculated the variance inflation factor (VIF) using the cars package (cars v. 3.0-10; Fox and Weisberg Reference Fox and Weisberg2019) for each retained variable in the best-fitting models and excluded variables with a VIF greater than 4.
Results and Discussion
Citizen and Community Scientists Can Provide Reliable Insight into Targeted Species
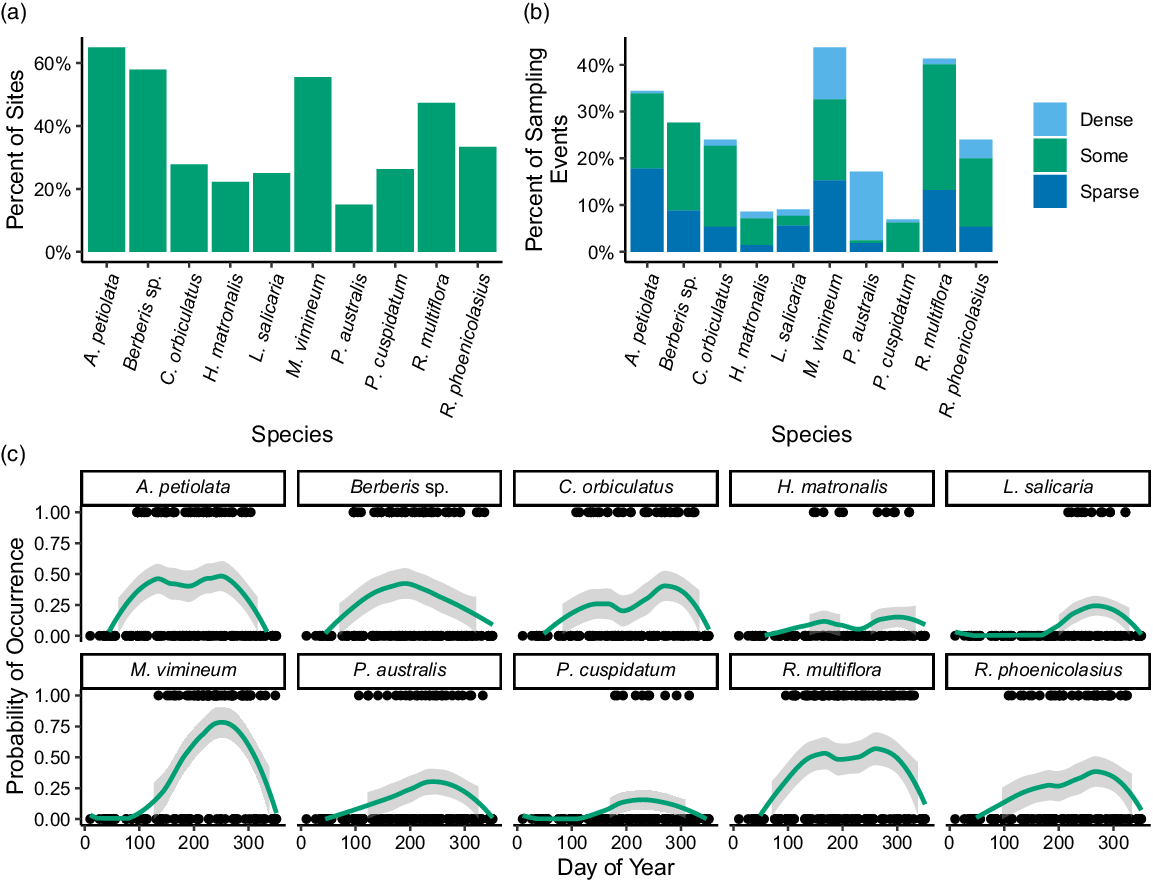
The twenty sites were sampled 329 times by citizen scientists between April 2017 and November 2019. In total, there were 45 citizen scientists who participated in an average of 12 ± 2.4 (minimum 1, maximum 72) sampling dates. Sampling intensity varied over the year (Figure 1B), with the highest number of sampling dates in August and the lowest in January. The most common invasive plant species across all sites was A. petiolata and the least frequently occurring species was P. australis, which only occurred at 15.0% of sites (Figure 2A). Across all sampling events, the most commonly found species were M. vimineum (43.8%) and R. multiflora (41.3%), and the least commonly found were R. phoenicolasius (6.9%), H. matronalis (8.6%), and L. salicaria (9.1%) (Figure 2B).

Figure 2. Bar graphs showing the percentage of (A) sites at which each invasive plant species was present and (B) sampling events for which each invasive plant was present. (C) Line graph showing the distribution of presence (1) and absence (0) dates for each species across the year, with fitted locally weighted scatterplot smoothing curves to visualize how probability of occurrence across all study sites for each species varied across the year; shaded gray regions indicate 95% confidence intervals.
Phragmites australis was the target species most commonly marked as “dense” and was recorded as such on 24 distinct sampling dates, followed by M. vimineum (16 dates) (Figure 2B). No invasive plants were detected on 72 sampling dates; however, across the whole of the study period, all sites except Sky Lake Lodge 2 had at least one invasive plant species. In addition to the explicitly monitored species, three other invasive plant species were recorded while sampling: bedstraw (Galium sp.) (n = 3), bull thistle [Cirsium vulgare (Savi) Ten.] (n = 1), and bush honeysuckles (Lonicera spp.) (n = 1). Because these species were not systematically assessed and citizen scientists were not provided with identification guides for these species, they were omitted from further analysis. However, we did add a species to the total site richness if any of the three non-target species were recorded. An average of 3.9 ± 3.0 target invasive plant species was found at each site, with a minimum of zero species found at Sky Lake Lodge 2 and a maximum of nine species found at Lenape Lane 2 and Pine Road 1.
The detection probability of each species varied across the year (Figure 2C), in patterns approximately following the species phenology. This suggests that the citizen scientists observing the riparian sites may have relied on characteristics related to observable reproductive structures and estimates of presence or absence may not have been as accurate during reproductively dormant periods. However, a large number of citizen science studies have suggested that observer errors can be reduced by averaging across multiple observers, focusing on presence values, or having a larger number of observers involved in a project (Feldman et al. Reference Feldman, Žemaitė and Miller-Rushing2018; Fuccillo et al. Reference Fuccillo, Crimmins, de Rivera and Elder2015; Kallimanis et al. Reference Kallimanis, Panitsa and Dimopoulos2017; Young et al. Reference Young, van Mantgem, Garretson, Noel and Morelli2021). With this in mind, we focused on the presence of targeted species across all observers in the study to further evaluate the relationships between target species occurrence and abiotic site features.
Using a linear model, we assessed the relationship between the presence of individual observers and variation in the canopy cover estimates. We found that only 5 of the total 45 citizen scientists (11%) had a statistically significant impact on canopy cover estimations, and all were associated with a lower-than-expected value for canopy cover. Removing dates where any of these five individuals were present yielded a model of canopy cover that was only dependent on the sampling day of year and the site identity. This suggests that training in using a densitometer can support volunteers’ ability to collect reliable canopy cover information.
The data collected by citizen scientists in our region were used to inform a watershed management plan to identify relevant needs for riparian buffers, to document changes in nearby agricultural practices (some of which directly affect portions of the watershed), to support management actions against invasive species, and to uncover any additional solutions to problems these watersheds may be afflicted by presently or in the future. Volunteer involvement in this stream and riparian area monitoring process encouraged the concept of stewardship among visitors and members of the public who participated in the monitoring activities. Further, results from these monitoring activities have been included in educational activities to inform individuals about the conservation needs of the local environment (Bennett and Chronister Reference Bennett and Chronister2017; Kathe and Feldsine Reference Kathe and Feldsine2017; Reed Reference Reed2017). To date, data collected from this citizen science program have been used in seven journal articles, including synthesis research focused on invasive species, due to the data being made publicly available through the Global Biodiversity Information Facilities (Daru et al. Reference Daru, Davies, Willis, Meineke, Ronk, Zobel, Pärtel, Antonelli and Davis2021; Häkkinen et al. Reference Häkkinen, Hodgson and Early2022; Kendig et al. Reference Kendig, Canavan, Anderson, Flory, Gettys, Gordon, Iannone, Kunzer, Petri, Pfingsten and Lieurance2022; Klimeš et al. Reference Klimeš, Šímová, Zizka, Antonelli and Herben2022; Schneider et al. Reference Schneider, Makowski and Werf2021; Seebens and Kaplan Reference Seebens and Kaplan2022; Zhao et al. Reference Zhao, Li, Farnsworth, Valdes, Reichgelt, Chen, Zhou and Su2022).
Target Species Presence Was Correlated across Sites
The results from the correlation analyses indicated that there was on average a weak positive correlation between the occurrence of any given species, with a mean correlation coefficient of 0.26 ± 0.28. The two species most likely to occur together were H. matronalis and C. orbiculatus, which had a correlation coefficient of 0.85 (P < 0.0001). Further, C. orbiculatus had the highest average correlation across all target species (0.47) and was significantly correlated with the presence of R. multiflora (0.68, P = 0.002), L. salicaria (0.55, P = 0.002), R. phoenicolasius (0.60, P = 0.01), and P. australis (0.56, P = 0.02). The occurrence of P. cuspidatum and M. vimineum were not significantly correlated with other target species, with P. cuspidatum showing the least variability and lowest likelihood of occurrence with other invasive plant species (Figure 3A and B).
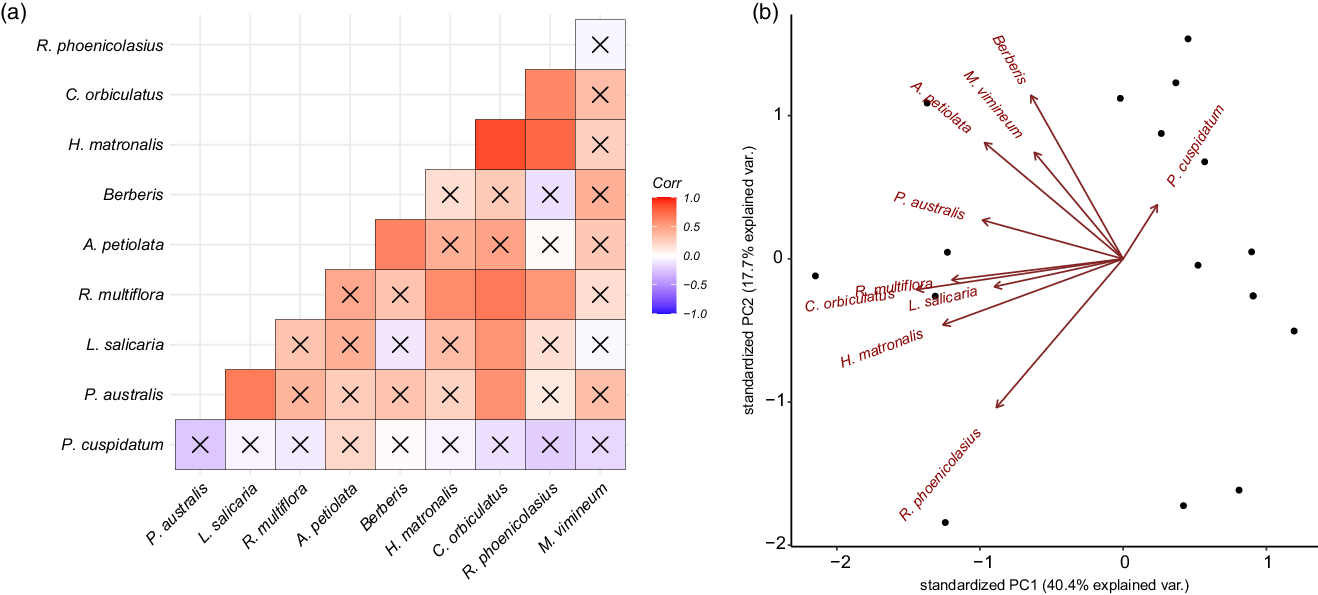
Figure 3. Composition of invasive species community at each site. (A) A correlation plot shows how likely two species are to occur together, with darker blue indicating greater likelihood of co-occurrence and darker red indicating lower likelihood of co-occurrence. An “X” indicates an insignificant (P > 0.05) correlation coefficient. (B) A biplot of the two principal components (PC) of occurrence covariation for each site. Principal component analysis loadings for each species are plotted in red.
Variation in Site Characteristics Was Associated with Variations in the Number of Target Invasive Species
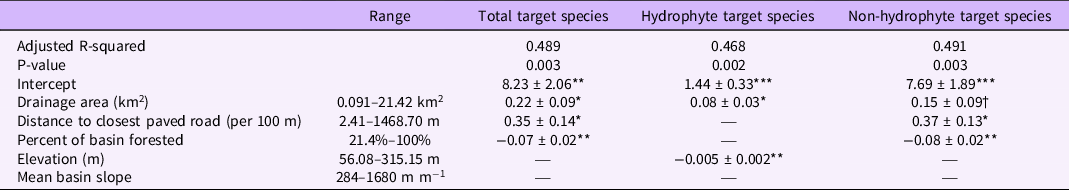
In all three models of the number of target invasive plant species present, the size of the drainage area was retained as a predictor that improved model fit. Additionally, all variables had VIF scores below 3. In both the model of total target species and the number of hydrophyte species, there was a significant, positive relationship between the size of the basin and the number of species (Table 2). This result conforms with prior research demonstrating that larger drainage areas lead to a higher probability of species’ introductions, particularly in large drainage areas containing roads (Barney Reference Barney2006; Christen and Matlack Reference Christen and Matlack2009; Parendes and Jones Reference Parendes and Jones2000). No models retained the mean basin slope as a predictor, in contrast to our hypothesis. This finding may be due to conflicting individual species’ relationships with bank steepness, as for some species, seed deposition can be decreased with increasing bank steepness (Leeuwen et al. Reference Leeuwen, Sarneel, Paassen, Rip and Bakker2014; Naiman et al. Reference Naiman, Decamps and Pollock1993; Soomers et al. Reference Soomers, Winkel, Du and Wassen2010), while other species may facilitate reduced steepness by stabilizing banks (Bunn et al. Reference Bunn, Davies, Kellaway and Prosser1998; Jones et al. Reference Jones, Lawton and Shachak1997; Zedler and Kercher Reference Zedler and Kercher2004).
Table 2. Best-fit models for the number of target invasive species found at each of the surveyed sites (n = 20). a

a Species data presented as coefficients ± SE, with dagger/asterisks indicating significance levels: † P=0.1; *P=0.05; ** P=0.01; *** P=0.001. See Table 1 for hydrophyte and non-hydrophyte designations of target species.
The relationship with the distance to the closest paved road may provide further insight into this pattern, as sites closer to paved roads were found to have a higher number of total target species and a higher number of non-hydrophyte species (Table 2). The spread of invasive species can be facilitated by roads that serve as corridors for movement through a landscape and as a route for novel introductions (Christen and Matlack Reference Christen and Matlack2006, Reference Christen and Matlack2009; Mortensen et al. Reference Mortensen, Rauschert, Nord and Jones2009). Additionally, roads are the sites of major disturbances during both their construction and subsequent road maintenance (Rentch et al. Reference Rentch, Fortney, Stephenson, Adams, Grafton and Anderson2005). Our finding that hydrophyte species numbers did not retain the distance to the closest road as a predictor may also indicate that these species may be less affected by road-related introductions and may instead be introduced in this region through other means.
Invasive plant species are less likely to occur in forest interiors compared with developed or roadside regions (Hansen and Clevenger Reference Hansen and Clevenger2005). In concordance with this expectation, our results show lower numbers of target invasive plant species, both total and non-hydrophytes, as the percent of the basin that is forested increases (Table 2). There are variations among the target species in their shade tolerance and light availability requirements. For example, M. vimineum is highly shade tolerant (Barden Reference Barden1987; Horton and Neufeld Reference Horton and Neufeld1998), while L. salicaria exhibits more modest shade tolerance (Jorgensen et al. Reference Jorgensen, Sorrell and Eller2020; Ture et al. Reference Ture, Bingol and Middleton2004; Weihe and Neely Reference Weihe and Neely1997), and P. australis requires high light availability (Chambers et al. Reference Chambers, Meyerson and Saltonstall1999; Hickman Reference Hickman2012; Jacobson et al. Reference Jacobson, Almquist-Jacobson and Chris Winne1991). Therefore, there may be both biological constraints and development-related invasibility differences in the number of target species in relation to the percentage of forested land.
Elevation was retained as a significant predictor of only the number of hydrophyte species, showing a decreasing number of target species as elevation increased. In the eastern United States, as in most temperate ecosystems, the vast majority of invasive plant species’ introductions occur in lower-elevation, highly disturbed areas (Hobbs Reference Hobbs2000; Pauchard et al. Reference Pauchard, Kueffer, Dietz, Daehler, Alexander, Edwards, Arévalo, Cavieres, Guisan, Haider, Jakobs, McDougall, Millar, Naylor and Parks2009; Pauchard and Alaback Reference Pauchard and Alaback2004). However, elevation is also an important contributor to microclimate variations (Forcella and Harvey Reference Forcella and Harvey1983; Wilson et al. Reference Wilson, Rapson, Sykes, Watkins and Williams1992), which may further contribute to physiological limits on invasive plant species’ establishment and proliferation in the riparian zones. Interestingly, the number of target hydrophyte species model retained only the drainage area size and the elevation of the site, and the total target species and non-hydrophyte species models did not retain elevation as a predictor. While our sample size precludes eliminating elevation as a contributor to the variability of these species, this may suggest that elevation limits on establishment may be particularly salient for hydrophyte species in this region.
This study serves as a case study of the utility of community-led citizen science efforts in supporting watershed management plan development and invasive plant species monitoring. We found that the number of target species detected was associated with increasing drainage area size, sites closer to paved roads, and decreasing percent of a basin being forested. These findings highlight site-level variability in the region, which can support our efforts to prioritize sites and streams in the Hudson River Valley to monitor for future introductions and preventative action to counter invasions. Additionally, our results showed differences in the most salient site-level features for hydrophyte and non-hydrophyte species, which highlights the importance of considering species’ life-history traits in stream ecosystems before the development of mitigation and/or prevention strategies for invasive plant species in the riparian zone.
Data Availability Statement
The data that support the findings of this study, associated protocols, and structured metadata language in Ecological Metadata Language are openly available in the Environmental Data Initiative Repository at https://doi.org/10.6073/pasta/a00ff0a44f3305f17c99d87e6a0f29fd, under identifier 399.2; occurrence data are available via the Global Biodiversity Information Facilities at https://doi.org/10.15468/nw2vj4.
Acknowledgments
We gratefully acknowledge the work of the many citizen scientists and volunteer data collectors, including the Shimada family, Anthony Montoya, Barbara Leon, the Bergman family, Brooke Peterson, Bruce Weisner, Dave Morgan, David Hultgren, Diana Staats, Erich Markert, Erik Anderson, Gianna Bologna, Gloria Minsky, Heather Lai, Heather Wander, Jane Dobson, Janice Cyr, Jessica Kathe, Jill Feldman, Joan Korey, Joe Doran, Joel Morocho, Kathleen Hranowsky, Kathy Palcic, Ken Pawson, Kevin Cooney, Larry Feldman, Linda Cooney, Matt Corona, Meghan Oberkircher, Patric Palcic, Ralph Durham, Rebecca Ferry, Robert Ferri, Ron Crovisier, Roy Sheldon, Scott Shortle, Sue Horowitz, Susan Livingston, Tom Weiner, and Travis Ferry. We are also grateful to the New York State Department of Environmental Conservation for providing the funding for the citizen science community-led monitoring program that provided the data used in this study via the Hudson River Estuary Program Grant for Local Stewardship Planning. We also acknowledge the financial support of the Environmental Data Initiative, funded by U.S. National Science Foundation award no. DBI-1629233 for the curation of the data used in this study. AG was supported by the National Science Foundation Graduate Research Fellowship Program under grant no. 1842191 and the Loewy-Mohonk Preserve Liaison Fellowship. SM was supported by the Catherine and Richard Becker Graduate Research Fellowship. MC was supported by the Office of Student Scholarship, Creative Activities, and Research Assistant Program. Publication of this article was funded in part by the George Mason University Libraries Open Access Publishing Fund. No conflicts of interest have been declared.