

Management Implications
Dioscorea bulbifera (air potato, also known as air yam), an exotic invasive plant of Afro-Asian origin, has invaded public and private landscapes across Florida and other states in southeastern United States. It grows prolifically, branches profusely, covers native vegetation, shades and kills plants underneath, and produces a large number of vegetative propagules (bulbils). Vines die in fall and sprout back in spring. Various management methods (chemical, mechanical, cultural, and biological) have been deployed to minimize its impact on native plant communities. More recently, biological control has significantly reduced D. bulbifera’s impact at the landscape level in various parts of Florida as well as in southern parts of neighboring states. Simple predictive equations developed for estimating live biomass components would allow gauging effectiveness of biological and other control measures in suppressing D. bulbifera growth and development in its adventive ranges. Allometric equations that use one or more independent variable such as height, diameter, and crown parameters have been widely used in estimating total biomass and its constituents (wood, leaf, fruits, seeds, etc.) of tree, shrub, and woody vines in various parts of the world. There is paucity of such allometric equations for herbaceous vines, especially for D. bulbifera, that can be used to measure effectiveness of currently deployed management tactics. Herein, we measured three independent variables (stem density, stem base diameters, and height of the infestation patches) within patches of D. bulbifera infestation in natural areas from southern to north-central Florida, destructively harvested vines, and sorted constituent parts (tubers, stems, leaves, and aerial bulbils). We used these variables and developed allometric equations that allow prediction of the amount of total biomass and its fractional components (underground tubers, stems, leaves, and aerial bulbils) and compared them for management effectiveness regardless of the size and stage (incipient or well developed) of infestation in its adventive ranges in Florida and neighboring states.
Introduction
Quantifying plant biomass based on allometric equations is a useful tool for nondestructively and efficiently estimating plant productivity in many ecosystems (Case and Hall Reference Case and Hall2008; Liu and Westman Reference Liu and Westman2009). The development of allometric models is a common approach in the scientific literature when investigating carbon sequestration (Yang et al. Reference Yang, Wang, Tan and Gao2017) and estimating costs of invasive plant management (Laroche and McKim Reference Laroche and McKim2004). The vast majority of the studies have focused on tree species (Beedlow et al. Reference Beedlow, Tingey, Phillips, Hogsett and Olszyk2004; Erickson et al. Reference Erickson, Pratt, Rayamajhi and Horvitz2017; Litton and Kauffman Reference Litton and Kauffman2008; Temesgen et al. Reference Temesgen, Affleck, Poudel, Gray and Sessions2015) and to a smaller degree on shrubs (Elzein et al. Reference Elzein, Blarquez, Gauthier and Carcaillet2011; Huff et al. Reference Huff, Ritchie and Temesgen2017; McGinnis et al. Reference McGinnis, Shook and Keeley2010; Vora Reference Vora1988). A limited number of published allometric equations describe the aboveground biomass of viny tropical lianas (woody vines) (Addo-Fordjour and Rahmad Reference Addo-Fordjour and Rahmad2013; Putz Reference Putz1983) and cultivated wine grape (Vitis vinifera L.) (Bindi et al. Reference Bindi, Fibbi and Miglietta2001; Castelan-Estrada et al. Reference Castelan-Estrada, Vivin and Gaudiliére2002; Gutierrez et al. Reference Gutierrez, Williams and Kido1985). Although there are several herbaceous viny invasive weeds [e.g., kudzu (Pueraria montana (Lour.) Merr. var. lobata (Willd.) Maesen & S.M. Almeida ex Sanjappa & Predeep), Asiatic tearthumb (Polygonum perfoliatum L.), air potato (also known as air yam; Dioscorea bulbifera L.), mile-a-minute (Mikania micrantha Kunth)] that are considered drivers of ecosystem change, there is a paucity of predictive models that estimate the biomass allocation of these vines in the published literature.
The vine D. bulbifera is an exotic weed of Afro-Asian origin (Burkill Reference Burkill1960; Tindall Reference Tindall1993) and was introduced to Florida in 1905 (Coursey Reference Coursey1967). This invasive vine is now considered a Category I weed in Florida, defined as a plant that can alter communities by displacing native flora, changing community structures, and disrupting ecological functions in many ecosystems (Overholt et al. Reference Overholt, Markle, Meisenberg, Raz, Wheeler, Pemberton, Taylor, King, Schmitz, Parks, Rayamajhi, Rohrig, Lake, Smith and Hibbard2014). The vine occurs in neighborhoods and natural ecosystems of 67 Florida counties (Croxton et al. Reference Croxton, Andreu, Williams, Overholt and Smith2011; Horvitz and Koop Reference Horvitz and Koop2001). Infestations range from small discrete patches of a single rooted stem to several hectares of contiguous foliage composed of numerous vines arising from the ground (Rayamajhi et al. Reference Rayamajhi, Rohrig, Leidi, Kerr, Salcedo, Poffenberger, Smith, Lake, Dray, Pratt, Tipping and Center2019). This exotic plant has spread and naturalized in Alabama, Georgia, Hawaii, Louisiana, Mexico, Mississippi, Puerto Rico, Texas, the West Indies, and central and northern South America (Wheeler et al. Reference Wheeler, Pemberton and Raz2007).
Dioscorea bulbifera seasonal growth begins in early spring and ends in late fall in Florida (Center et al. Reference Center, Rayamajhi, Dray, Madeira, Witkus, Rohrig, Mattison, Lake, Smith, Zhang, Purcell, Konstantinov and Schmitz2013), during which time the plant is composed of stems, leaves, aerial bulbils (vegetative propagules), and subterranean tubers. The dormant phase is represented by senesced aboveground vegetative components (dry vines and bulbils), while the perennial subterranean tubers remain and sprout the following spring (Coursey Reference Coursey1967; Rayamajhi et al. Reference Rayamajhi, Pratt, Tipping, Lake, Smith, Rohrig, Dray and Center2016). This seasonal growth results in the plant trellising over supporting structures (shrubs and trees) with a cumulative seasonal growth (total vine length) of up to 50 m (Rayamajhi et al. Reference Rayamajhi, Pratt, Tipping, Lake, Smith, Rohrig, Dray and Center2016). Thus, vines are typically capable of reaching the upper canopies of supporting vegetation each growing season. Two distinct bulbil morphotypes of D. bulbifera plants occur in Florida and are easily distinguished based on bulbil color and texture (Croxton et al. Reference Croxton, Andreu, Williams, Overholt and Smith2011): one with brown, rough skin (African origin) and another with tan, smooth skin (Asian origin; Martin Reference Martin1974). Despite differences in the color and texture of the bulbil skin, a molecular study of these two morphotypes from Florida has shown both to be of Asian origin (Croxton et al. Reference Croxton, Andreu, Williams, Overholt and Smith2011). These populations of D. bulbifera morphotypes occur as discrete or mixed patches and possess morphologically similar underground tubers, vines, leaves, and growth attributes.
Control methods have been developed to help mitigate the ecological impacts of D. bulbifera invasions (Overholt et al. Reference Overholt, Markle, Meisenberg, Raz, Wheeler, Pemberton, Taylor, King, Schmitz, Parks, Rayamajhi, Rohrig, Lake, Smith and Hibbard2014), including the release of classical biological control agents (Center et al. Reference Center, Rayamajhi, Dray, Madeira, Witkus, Rohrig, Mattison, Lake, Smith, Zhang, Purcell, Konstantinov and Schmitz2013). The leaf-feeding beetle Lilioceris cheni Gressitt and Kimoto (Coleoptera: Chrysomelidae) was first released in 2011, and recent evidence demonstrated that herbivory can suppress the vine’s smothering effects and propagule production (Rayamajhi et al. Reference Rayamajhi, Rohrig, Leidi, Kerr, Salcedo, Poffenberger, Smith, Lake, Dray, Pratt, Tipping and Center2019). Landscape-level evaluations of vine biomass and vegetative propagule production during pre- and post-biocontrol or other forms (chemical/mechanical) of control measures would greatly help gauge the management efficacy of a given deployed method. This can be achieved by comparing the outcomes of the regression models developed to estimate biomass and aerial bulbil and underground tuber density during both pre- and postcontrol management efforts. Therefore, the objective of this study was to develop and describe allometric equations that use the least number of easily measurable independent variables that estimate D. bulbifera’s dependent variables: total and fractional components’ (tuber, stem, leaf, and bulbil) biomass and densities of aerial bulbils and underground tubers. These models from the precontrol period will serve as baseline measures that allow comparison with future models developed to estimate dependent components of D. bulbifera post-biocontrol or other forms of management efforts (Rayamajhi et al. Reference Rayamajhi, Pratt, Center, Tipping and Van2008).
Materials and Methods
Study Sites
Four study sites in separate Florida counties were identified: Miami-Dade (25.696444°N, 80.377639°W), Broward (26.085778°N, 80.148000°W), Manatee (27.591170°N, 82.549420°W), and Alachua (29.647750°N, 82.285806 °W), representing the weed’s broad distribution in the state. Weed-patch size estimates for these sites ranged from 27 to 236 ha of D. bulbifera spreading horizontally on open ground but more commonly trellising vertically on supporting vegetation and other physical structures (poles and fences) (Rayamajhi et al. Reference Rayamajhi, Rohrig, Leidi, Kerr, Salcedo, Poffenberger, Smith, Lake, Dray, Pratt, Tipping and Center2019). Broward County and Manatee County sites represent predominantly sandy soils populated by vines bearing the brown bulbil morphotype, while Alachua County and Miami-Dade County sites represent predominantly organic soils populated by vines bearing the tan bulbil morphotype (Rayamajhi et al. Reference Rayamajhi, Rohrig, Leidi, Kerr, Salcedo, Poffenberger, Smith, Lake, Dray, Pratt, Tipping and Center2019). Adjacent sites in Alachua and Miami-Dade counties with same soil types had plants with both morphotypes (MBR, personal observation).
Data Collection
A total of 84 discrete D. bulbifera infestation patches often forming loosely interwoven mats of repeatedly branching vines (hereafter referred to as “patch(s)”), comprising 21 patches from each of the four counties (hereafter referred to as “sites”) were identified for this study. These D. bulbifera patches were well established, as indicated by vine emergence from perennial underground tubers rather than freshly fallen aerial bulbils. Assessments and data collection were conducted during the last week of October through December of 2012 (when plants were fully mature for the growing season), just before senescence, and most aerial bulbils were fully developed. To determine the areas covered by the vine patch, the outer boundary of the D. bulbifera canopy mats were mirrored two-dimensionally on the ground by walking directly beneath the canopy margin and posting numerous flags until the area directly under the canopy was adequately delineated. A nylon string was tied to the flags posted on the ground to create a geometric shape; the area (m2) of the shape was calculated using standard equations that most closely resembled the shape (circle, rectangle, etc.). Area of vine patches in the study sites ranged from 0.02 to 13.60 m2. The number of D. bulbifera vines (stems) emerging from the ground within the area of the patch were counted (ranged from 1 to 53 stems) and used to determine stem density (no. of stems m−2) per patch and was abbreviated as “Sd.” The stem base diameter (mm) of each vine was measured (ranged from 0.30 to 5.50 mm) and an average diameter (mm) was calculated for each patch, abbreviated as “Sbd.” The vertical height (m) of trellising vines at the highest point of each D. bulbifera patch canopy was measured (ranged from 0.10 to 5.50 m) using a graduated pole, with one height measurement per patch and was abbreviated as “Ph.” These three independent variables: Sd, Sbd, and Ph were used for predicting the dependent variables: (1) total aboveground (stems, leaves, and aerial bulbils) and belowground (tubers and roots) dry biomass (g m−2) of components; and (2) densities of aerial bulbils and underground tubers (no. m−2). Although some of the previous allometric studies of lianas used stem diameter and length as independent variables to predict their biomass (Castelan-Estrada et al. Reference Castelan-Estrada, Vivin and Gaudiliére2002; Gehring et al. Reference Gehring, Park and Denich2004), measuring the length of D. bulbifera stems is elusive due to the herbaceous nature of the vines, which repeatedly branch and form a loosely woven matrix (mat) of stems and branches. Out of 84 patches, 9 incipient patches did not bear bulbils at the time of this study, so the value of N (no. of samples) was 84 for all components but bulbils, which were represented by 75 patches.
Dioscorea bulbifera vines from each patch were carefully unwound from supporting vegetation and detached from the underground tubers. The aboveground components (stems, leaves, and aerial bulbils) were sorted and placed in separate paper bags by patch. The number of bulbils per patch was recorded and their density (no. m−2) was calculated. Underground tubers (from varying depths) with the tuft of roots were extracted from the ground, washed thoroughly, and placed in a paper bag as a single belowground fraction and recorded as tuber biomass; tuber densities (no. m−2) were calculated by patch of infestation. These fractions of D. bulbifera components in the paper bags were transported to the laboratory and dried at ca 70 C until a constant dry weight was reached, and the final dry weight (g) of each fraction was recorded and presented as dry biomass (g m−2).
Data Analyses
All independent and dependent variables were natural log (ln) transformed after failing Shapiro-Wilk normality tests. These ln-transformed data were subjected to ANOVA to test the main effects of site, soil type, and D. bulbifera plant morphotype on independent variables (Sd, Sbd, and Ph) used in prediction equations. Possible cross correlation in our model selection was determined by conducting a permutation test using Pearson’s parametric correlation tests among the three independent variables (Ph, Sd, and Sbd); the same parametric tests were also conducted to determine the correlation among dependent (total, tuber, stem, leaf, and bulbil) variables. Multicollinearity among predictors (independent variables) was examined by using the option of the variance inflation factor (VIF) multiple regression procedure in SAS (Freund and Little Reference Freund and Little2000). The prediction equations (using single or multiplied values of predictors as appropriate based on R2 values) for dry biomass (g) and densities (m−2) of D. bulbifera’s dependent components (total, vine, leaf, bulbil, and tuber) were developed by using two-sided ln-transformed data on dependent and independent variables in the GLM procedure. Dry-weight biomass components of the D. bulbifera plant were partitioned to determine the proportions contributed by each major component toward the total dry biomass.
Results and Discussion
There was no influence of site, bulbil morphotype, or soil type on the performance by the independent variables, Sd, Sbd, and Ph (Table 1). This report is consistent with previous findings that vine coverage and bulbil biomass of D. bulbifera were similar across various sites and soils (Rayamajhi et al. Reference Rayamajhi, Rohrig, Leidi, Kerr, Salcedo, Poffenberger, Smith, Lake, Dray, Pratt, Tipping and Center2019). Despite this evidence of marked similarities in plant productivity across sites, growing conditions, and morphotypes, it remains unclear whether these similarities can be inferred to other regions beyond the study areas.
Table 1. ANOVA showing main effects of the Dioscorea bulbifera–affected sites, morphotypes, and soil types on the stem density (no. of stems m−2), stem base diameter (mm), patch height (m) from ground to top surface of the trellising vine mats (patch) covering the ground or other vegetation, and area (m2) of the vine mats in natural areas of Florida.a
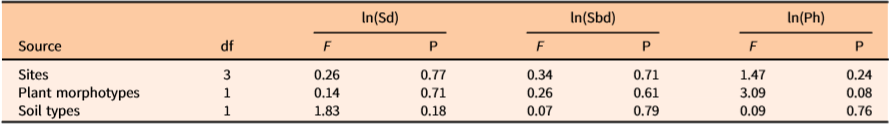
a ln(Sd) = ln(stem density), ln(Sbd)= ln(average stem base diameter), ln(Ph)= ln(height from ground to the highest point of the mat surface).
The independent variables Sd, Sbd, and Ph subjected to Pearson’s parametric tests showed no significant correlations (Table 2). VIF option analyses for the three predictors used herein showed no multicollinearity effects toward prediction of total, tuber, stem, leaf, and bulbil biomass. Overall, these analyses revealed that the independent variables were not correlated.
Table 2. Pearson’s parametric test for detecting correlation between pairs of independent variables used in predictive models for estimating Dioscorea bulbifera plant biomass in patches of measured infestations in Florida (N = 84).a
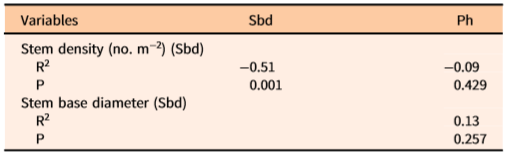
a ln-transformed data were used in this analysis.
The coefficient of determination (R2) showed that one or more independent variables would best predict the values of dependent variables of D. bulbifera plants (Table 3). Density of underground tubers was best predicted by the stem density alone (R2 = 0.96), which indicated that there is ca. 1:1 relationship between underground tubers and the number of stems emerging from the ground. The total biomass of the underground tubers was best predicted by multiplicative equations of all three variables (R2 = 0.69) (Table 3). Similarly, multiplicative equations of all three independent variables best predicted the biomass of total (R2 = 0.69), stem (R2 = 0.62), and leaf (R2 = 0.63) components (Table 3). Although less accurate and more variable among infestation patches, bulbil biomass (R2 = 0.32) and density (R2 = 0.31) were best predicted by Sbd*Ph and Sd*Sbd, respectively. The low R2 values for these two dependent variables (bulbil density and biomass) revealed a high degree of variability unaccounted for by the measured independent variables. Generally, infestations exposed to full sunlight were observed to have shorter vines with more bulbils than longer vines growing in poorly exposed (e.g., patches under tree canopies) locations (MBR, personal observation). Additionally, out of a total of 84 measurement samples, nine incipient infestations were composed of one or more small immature vines that did not bear any bulbils. Therefore, variability in light exposure and vine dimensions may have contributed to some degree of variability in bulbil density/biomass.
Table 3. Coefficients of determination (R2) for two-sided ln-transformed equations of independent (predictors) and dependent (dry biomass and densities of aerial bulbils and underground tubers of vine components) variables of Dioscorea bulbifera infestations in Florida.
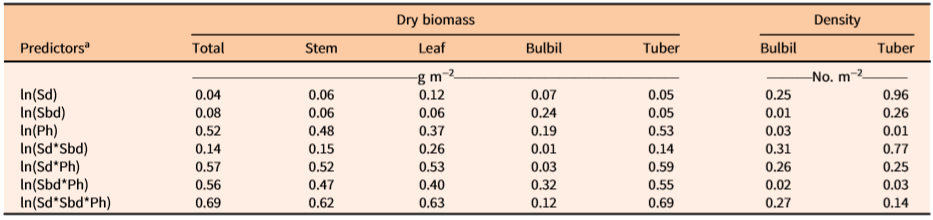
a Data are based on measured vine-infested areas within study sites. Sd = main stem density (m−2) within measured patch of infestation, Sbd = basal diameter (mm) of stem (main vine), Ph = maximum vertical height (m) of patch of measured vine infestation.
The relationship between single or combinations of independent variables with the dependent variables of D. bulbifera are presented in Figure 1. Linear relationships of total, stem, and leaf dry biomass (g m−2) with their respective independent variables were stronger and less variable (Figure 1); however, multiplicative equations of three predictors (Sd*Sbd*Ph) were needed to explain associated variabilities for best prediction of dry biomass (Table 4). Dry biomass of bulbils was best predicted by Sbd*Ph (Figure 2A); this is because vines with larger base diameters tend to grow longer and produce larger bulbils (MBR, personal observation). On the other hand, bulbil density was best predicted by Sd*Sbd (Figure 2B), as increased vine density means increased cumulative vine length in a given area that, in turn, can produce more bulbils in the leaf axils, resulting in higher bulbil densities (no. m−2) (Figure 2; Table 4). Bulbil densities in studied infestations ranged from 0 m−2 in some incipient infestations with small vines to 97 m−2 in large infestations with well-developed patches. The total bulbil biomass production in a given site is primarily a function of the stem dimensions (vine diameter and length) (Rayamajhi et al. Reference Rayamajhi, Pratt, Tipping, Lake, Smith, Rohrig, Dray and Center2016). Generally, stems with larger base diameters (Sbd) grow at a faster rate, gain more height (Ph) to reach the canopies, form longer vines, result in larger interwoven vine mats via repeated branching, and produce more leaves (hence more leaf axils) that bear more bulbils (Rayamajhi et al. Reference Rayamajhi, Pratt, Tipping, Lake, Smith, Rohrig, Dray and Center2016). Biomass of underground tubers, the perennial part of the plant, was also best predicted by Sd*Sbd*Ph (Figure 2C); this was also indicated by its significant positive correlation with all the aboveground fractional components (Table 5). The independent variable Sd alone adequately predicted the number of underground tubers (Figure 2D); usually, one stem grew from each underground tuber and developed into aboveground components of vines, although development of multiple aerial vines from some large underground tubers was not uncommon. Thus, one or more independent variables (Tables 3 and 4) were required for best prediction of different fractional components of D. bulbifera plants. More importantly, measuring the predictive variables requires minimal effort (compared with the time required for destructive harvesting and sample processing) while providing accurate estimates of the biomass of the D. bulbifera plant components, especially valuable when planning to remove biomass as part of natural area management program.
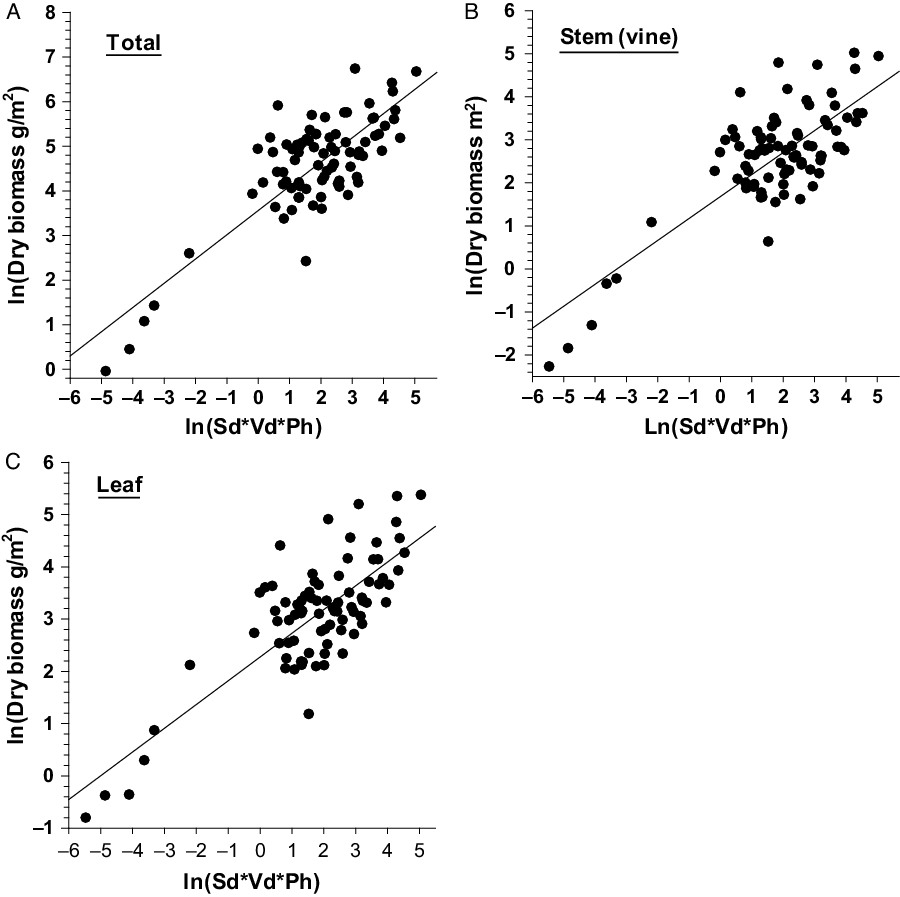
Figure 1. Scatter plots with regression line showing relationship between independent variables (Sd, Sbd, and Ph) and dependent variables (total, stem, and leaf biomass) of Dioscorea bulbifera infestations in Florida. Note: Sd = stem density m−2; Sbd = stem base diameter (mm); Ph = maximum height (m) of the trellising vine mats within the study patch.
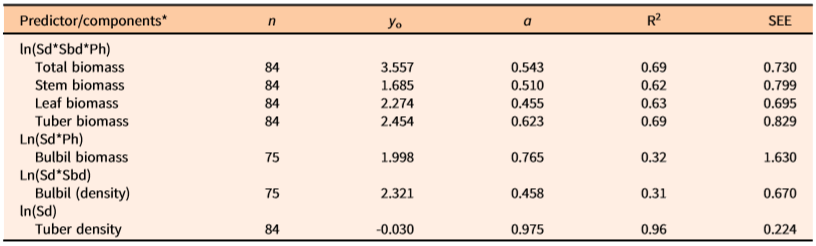
Table 4. Predictive allometric equations (based on two-sided ln-transformed data) for dry biomass (gm m−2) and number of aerial bulbils and tubers (no. m–2) of natural populations of Dioscorea bulbifera infestations in Florida.

a n= number of infestations measured, y 0 = intercept, a = slope, R2 = coefficient of determination, SEE = standard error of the estimate; Sd = main stem density (m−2) within measured patch of the infestation, Sbd = basal diameter (mm) of stem (main vine), Ph = maximum vertical height (m) of the patch of measured vine infestation. All regression equations are statistically significant (P < 0.05).
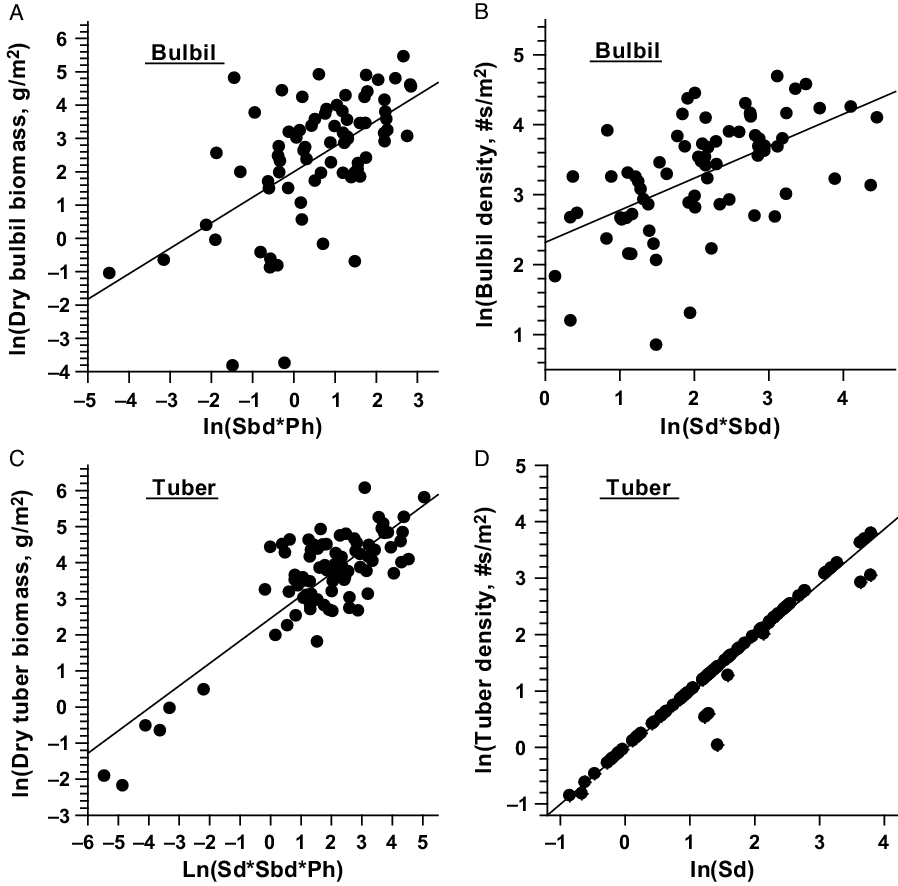
Figure 2. Scatter plots with regression line showing relationship between independent (Sd, Sbd, and Ph) and dependent (tuber and bulbil biomass, and tube and bulbil density) variables of Dioscorea bulbifera infestations in Florida. Sd = stem density m−2; Sbd = stem base diameter (mm); Ph = maximum height (m) of the trellising vine mats within study patch.
Table 5. Pearson’s test of correlation among total and fractional components of ln-transformed dependent variables of Dioscorea bulbifera infestations in Florida.a
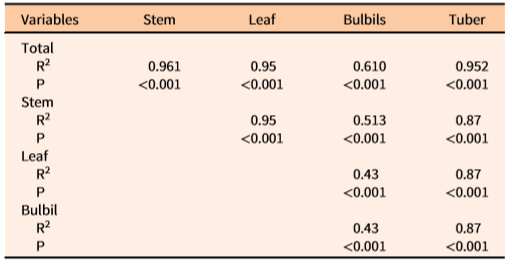
a ln-transformed data were used in this analysis.
The use of easily measurable independent variables and the need for multiple independent variables to predict biomass has also been reported in other plant systems. Elzein et al. (Reference Elzein, Blarquez, Gauthier and Carcaillet2011) developed predictive equations for subalpine shrubs that cover more areas through horizontal growth compared with vertical height and hence a combination of “shrub cover (SA) × height (H)” adequately predicted shrub biomass for 80% of his studied shrub species. Similarly, Yang et al. (Reference Yang, Wang, Tan and Gao2017) conducted an allometric study on 12 common shrub species in the desert grassland of northern China and reported that “crown area (CA)” was the best predictor for leaf and twig biomass, while “crown area (CA) × height (H)” was found to be the best predictor for the branch, aboveground, belowground, and total biomass. Stem diameter and length in lianas (Addo-Fordjour and Rahmad Reference Addo-Fordjour and Rahmad2013; Castelan-Estrada et al. Reference Castelan-Estrada, Vivin and Gaudiliére2002) and the diameter at breast height (dbh) and the tree height (H) in invasive trees have been reported to be both the most easily measured and the best predictors for biomass estimation (Beedlow et al. Reference Beedlow, Tingey, Phillips, Hogsett and Olszyk2004; Litton and Kauffman Reference Litton and Kauffman2008; Rayachhetry et al. Reference Rayachhetry, Van, Center and Laroche2001; Temesgen et al. Reference Temesgen, Affleck, Poudel, Gray and Sessions2015). Lieurance (Reference Lieurance2007) destructively harvested 35 earleaf acacia (Acacia auriculiformis A. Cunn. ex Benth.) trees (an invasive plant of Australian origin) of different size classes, partitioned their aboveground components (trunk, branch, twig, and leaf), developed a series of simple multiplicative equations for each component before Hurricane Wilma in October 2005, and used those equations to assess components of 29 hurricane-impacted trees 3-mo later. In this case, basal diameter was reported to be the best predictor for all studied components. Comparative pre- and post-hurricane results showed that the hurricane did not alter the woody biomass, but the twig and leaf biomass registered significant losses.
The following generic equation could be the best predictor of the dependent variable y for D. bulbifera in our study:
 $${\rm{ln(y) = y_0 + a^*ln(x)}}$$
where y, y 0, a, and x represent the dependent variables (aboveground and underground components), intercept, slope, and one or more measured independent variables (single Sd, Sbd, and Ph values, or the values derived by multiplying one or more of these variables as needed to increase accuracy of estimated dependent components), respectively. Dependent variable (y)-specific predictive linear regression equations are presented in Tables 3 and 4. These equations will yield dependent variables in logarithmic units.
Various authors have insisted on transforming the logarithmic units to arithmetic units for ease of interpretation and comparison of data (Sprugel Reference Sprugel1983). Conversion of the logarithmic estimates of the mean and variance back to arithmetic units [anti-ln(y)] is not direct, as the logarithm of ln(y) yields the median of the skewed arithmetic distribution instead of the mean (Baskerville Reference Baskerville1972). Therefore, a correction factor (cf) will be needed to counteract this skewness (Sprugel Reference Sprugel1983). The anti-ln(y)*cf, where cf = exp(SEE2/N − P) (here, SEE = standard error of the estimate, N = number of observations, and P = number of parameters) will yield the predicted units (Sprugel Reference Sprugel1983); in our case, dry weight (g m−2) and the densities (no. m−2) of bulbils and tubers in D. bulbifera–infested natural areas of the southeastern United States.
Dry biomass proportion (percentages) of the tubers, stems, leaves, and bulbils in total patch biomass of D. bulbifera in the current study were 42.0 ± 1.8, N = 84; 15.6 ± 0.8, N = 84; 26.0 ± 1.4, N = 84; and 16.4 ± 1.7, N =75; respectively. The total and fractional biomass and quantities (patch−1) of D. bulbifera components (underground tubers, stems, leaves, and bulbils) had strong positive correlations among one another (Table 5), indicating the increase in the amount of one (e.g., underground tuber biomass) will positively influence another (e.g., total aboveground biomass). Notably, the biomass allocation in field-grown vines of D. bulbifera in the current study ranked as tubers > leaves > bulbils > stems. Rayamajhi et al. (Reference Rayamajhi, Pratt, Tipping, Lake, Smith, Rohrig, Dray and Center2016) conducted a common garden study over two consecutive years by planting the previous year’s aerial bulbils ranging across four biomass categories (small to large), allowing individuals to sprout and grow for a full season, harvesting the total plant biomass, and reporting the average percentages of dry biomass of the tubers, stems, leaves, and bulbils. This assessment resulted in a different biomass ranking, namely, bulbils > leaves > stems > tubers. This disparity in biomass allocations between these studies was likely related to the types of propagative units (planted bulbils) that contributed to the biomass. The resulting biomass in the current study was based on naturally existing underground tubers that were already well established in the study sites, whereas the results reported by Rayamajhi et al. (Reference Rayamajhi, Pratt, Tipping, Lake, Smith, Rohrig, Dray and Center2016) were based on the biomass of plants generated from bulbils that were planted. Overall, vines generated by underground tubers in natural infestations in the current study allocated more biomass to underground tubers and leaves than to vines and bulbils. In contrast, the individual plants generated from smaller bulbils followed similar trends with underground tubers, but larger aerial bulbils allocated more biomass to bulbils and leaves than other components (Rayamajhi et al. Reference Rayamajhi, Pratt, Tipping, Lake, Smith, Rohrig, Dray and Center2016). Therefore, the predictive equations reported herein may not be as useful in predicting the biomass in the first year of new infestations initiated by bulbils. However, it should be noted that any infestation older than 1 yr will have well-established perennial underground tubers that sprout during spring of the following year and produce new patches; the equations developed herein will be applicable to these as well as older infestations in Florida.
In conclusion, the equations and models presented herein represent baseline data from undamaged plants. The three independent variables Sd, Sbd, and Ph of D. bulbifera patches from natural infestations can be measured with minimal effort and used in two different scenarios:
1. To assess the impact of control measures: A 5-yr-long field study related to the biocontrol impact on D. bulbifera plants in Florida reported reduced bulbil densities and vine coverage on other vegetation due to severe defoliation and dieback of vines early in the growing season (Rayamajhi et al. Reference Rayamajhi, Rohrig, Leidi, Kerr, Salcedo, Poffenberger, Smith, Lake, Dray, Pratt, Tipping and Center2019). This report indicated that the models developed after deployment of control measures would predict reduced total, leaf, and bulbil biomass when the sampling and analytical protocols used are same as for predeployment of control measures. Sampling protocols will involve selecting a range of representative D. bulbifera patches, gathering data on independent variables (Sd, Sbd, and Sd) during the late growing season, estimating the amount and proportions of dependent variables (tuber, stem, leaf, and bulbil) in total biomass, and comparing these values with before and after control measures. The comparison of tuber, stem, leaf, and bulbil component fractions can be accomplished by comparing slopes of the models developed for pre- and postcontrol measures. This should be a useful tool for gauging efficacy of deployed biocontrol, herbicidal, or mechanical treatments involving removal of vines, bulbils, and tubers from affected sites as reported for the melaleuca [Melaleuca quinquenervia (Cav.) S.F. Blake] system (Rayamajhi et al. Reference Rayamajhi, Pratt, Center, Tipping and Van2008).
2. Contracting chemical/mechanical biomass removal: By acquiring site-specific data on independent variables identified in this study, one can estimate total biomass, which can facilitate communication between land managers and contractors/stakeholders who are responsible for removing invasive plant biomass (Laroche and McKim Reference Laroche and McKim2004).
Acknowledgments
We acknowledge the assistance of Reynaldo Moscat (USDA/ARS, Invasive Plant Research Laboratory, Ft Lauderdale, FL), and many student interns from Miami-Dade and Broward College. Thanks are also due to the Miami-Dade County Department of Environmental Resource Management (DERM) for providing partial funding for this project. Mention of trade names or commercial products in this publication is solely for providing specific information and does not imply recommendation or endorsement by the U.S. Department of Agriculture. USDA is an equal opportunity employer and provider. No conflicts of interest have been declared.