
Governments have long used economic means to apply pressure on other states when trying to impose their will or gain concessions. From embargoes, sanctions, and threats of default to filing complaints with the World Trade Organization (WTO), the list of such means is long. Yet in 2018, the escalating tensions between China and the US, the world's two largest economies, led to the use of a different form of economic pressure on an unprecedented scale: imposition of tariffs on goods that are primary exports of the trading partner. President Trump was the first to strike, announcing in March of that year tariffs on washing machines and solar panels, followed by tariffs on steel and aluminum. China promptly responded with retaliatory tariffs on 128 US products. In the following months leading to the US midterm elections, rising hostility saw both countries imposing additional rounds of tariffs. By the elections in November, China had imposed tariffs on a total of 6,000 products worth over USD 110 billion in US exports.
A government's decision to impose tariffs has traditionally been analyzed as a tool that politicians use to curry favor with local interest groups or obtain financial contributions from lobbies “buying” protection.Footnote 1 However, the escalating trade war between the US and China points to a different facet of the politics of trade. Rather than imposing tariffs to pander to domestic interests, China's strategy of placing tariffs on specific products may have been driven by a rationale of imposing external political costs on its trading partner.Footnote 2 As vice premier of China Liu He explained, in choosing which products to tariff, his country seeks to “strike accurately and carefully, splitting different domestic groups in the US.”Footnote 3 Indeed, China purchased a full advertisement supplement in the De Moines Register, the largest newspaper in the battleground state of Iowa, highlighting the impact of the trade war on the farmers in the soybean sector and attributing the situation to “the fruit of a president's folly.”Footnote 4 Yet when President Trump accused China of meddling in the upcoming congressional elections, China's top diplomat, Wang Yi, rejected the allegation, saying: “We did not and will not interfere in any country's domestic affairs.”Footnote 5
The unfolding of the crisis raises three important questions that we focus on here. First, to what extent did China's selection of specific products to place tariffs on reflect a political strategy that aimed to decrease domestic support for President Trump's party? Second, if it was politically motivated, how successful was the strategy in exacting an electoral cost on Republican candidates in the 2018 midterm elections? Finally, why did voters respond politically to the imposition of tariffs in the way they did?
To address those questions, we begin by analyzing the potential impact of the tariffs that China chose to impose, assessing the implications of the tariffs on the workforce in each county and congressional district. We do so by matching the list of targeted commodities to industry classifications and constructing an original measure of the county-level share of employment targeted in each round of retaliatory tariffs. We then examine the relationship between our measure of pain inflicted on the local workforce and the county's voting in past elections.
Our analysis shows that China's selection of products to target with retaliatory tariffs followed a clear political logic: products produced in areas with a strong Republican base were more likely to be targeted. This targeting was even more prevalent in heavily Republican counties located in swing congressional districts—ones that in past elections were closely contested by the two major parties. By targeting those specific races, China had a higher probability of affecting the election outcome than in electorally safe Republican districts. We present a range of tests that indicate that this pattern was not the result of chance, nor can it be accounted for by other county-specific characteristics.
We then assess the actual electoral impact of these tariffs by analyzing the change in the Republican two-party vote share between the 2016 and 2018 congressional elections. We find that overall, support for Republican candidates decreased in relation to the share of workers in a given district who were affected by the tariffs. For each percentage point increase in workers exposed to the retaliatory tariffs, the Republican share of the two-party vote decreased by between 0.12 and 0.47 points, compared to the previous election (the range depending on the specific round of tariff announcement).
Different mechanisms can account for why voters punished Republican candidates in areas more heavily targeted by China's tariffs. It may be a case of “naive” pocketbook voting, whereby citizens knew little about the escalating trade relations with China but turned against the incumbent party because their personal economic situation had worsened. Alternatively, voters did know about the trade war and saw it as a policy failure of the president and his party, perhaps also as an indication of bad things to come. Thus, if the deteriorizing trade relations were a more salient issue in geographic areas or industries affected by the tariffs, residents in those areas or workers in targeted sectors would be more likely to have punished the Republicans electorally.
To test these mechanisms, we use original data from a national survey we administered and augment it with an analysis of campaign communications ahead of the elections as well as web search patterns across the country. All three data sources point more strongly toward the latter explanation. It does not seem to be the case that the retaliatory tariffs were present long enough to exert meaningful economic pain on voters, and hence we find little to suggest that the shift in voting reflected pocketbook retrospection. Rather, the evidence indicates that voters who were more vulnerable to the tariffs’ impact were likelier to learn about the escalating trade war, recognize its adverse impact, and view President Trump and Republican Congress members as responsible for the situation.
Our findings contribute to the debate over the role of trade as an electoral issue. A host of recent studies provides evidence that the adverse economic effects of trade liberalization, particularly the import shocks resulting from China's joining the WTO, have had notable electoral consequences.Footnote 6 However, these studies offer little insight on whether voters were making a connection between the economic situation and trade policy, or whether their vote was a reaction to changing economic circumstances, without awareness of the role that international trade has had on the adverse change they experienced. Indeed, evidence indicates that ordinary citizens possess little knowledge about, or understanding of the complex issue of trade and its distributive consequences.Footnote 7 Therefore, some argue that trade hardly plays a role as an electoral consideration among voters.Footnote 8 While this is certainly true in some elections, our study shows how trade policy can nonetheless become a meaningful electoral issue that affects voters’ preferences. Specifically, we provide evidence of how this occurs, from opposition candidates highlighting their opponents’ culpability for the adverse effects of the trade war, through people residing in areas harmed by the trade war seeking more information online about the situation, to voters attributing responsibility to politicians for the escalation in trade relations.
Our findings add to recent studies that have shown that the adverse effects of trade liberalization can have a nontrivial impact on voting.Footnote 9 The results we present show that voters also respond to the adverse effects of the opposite shift, that is, to a foreign country acting to reduce the level of trade. These results are very much in line with the framework that Rogowski proposed, indicating that a change in exposure to trade—both an increase and a decrease—has important and theoretically predictable political repercussions.Footnote 10
Finally, our findings contribute to recent research on “smart” sanctions, which are intended to harm specific actors or constituencies in the sender state while minimizing harm on society at large.Footnote 11 To date, the discussion regarding smart sanctions has focused on tools such as asset freezes, travel bans, aid reductions, and trade embargoes (e.g., in arms, oil, or diamonds). Our research indicates that a strategically crafted tariff policy can also serve as a form of smart sanctions by imposing targeted electoral costs on the trading partner's government. We also show that such a strategy can exact electoral costs even in a fairly short period of time.
A few other recent papers study related aspects of the US–China trade war. Using different data sources and methods, they reach several conclusions that are consistent with our own findings. Fetzer and Schwarz also find evidence that the retaliatory tariffs China imposed on US exports were politically targeted.Footnote 12 Still other studies find that these tariffs hurt Republican candidates in the 2018 elections.Footnote 13 Our study differs in that we not only examine the rationale and impact of the Chinese tariff strategy—we also focus on the mechanisms underlying the domestic political response to the trade war. In doing so, we provide new insights on the ways voters become informed about trade policy as well as on the process of assigning politicians responsibility for the policy's impact.
Trade Policy, Retaliation, and Anti-Incumbent Voting
A host of recent studies provide evidence that the adverse economic effects of trade liberalization have had notable electoral consequences. In particular, the distributive effects of the import shock resulting from China joining the WTO have led to electoral shifts ranging from voting in the 2016 US elections or the Brexit referendum to the rise of economic nationalism in Western Europe.Footnote 14 Notably, these studies offer little insight on whether voters were making a connection between the economic situation and trade policy, or whether their vote was a reaction to changing economic circumstances, without an awareness of the role that international trade has had on the adverse change they experienced. In fact, recent research suggests that the issue of trade openness was unlikely on voters’ minds. The average citizen typically exhibits very limited interest in trade policy and understands little about its economic consequences.Footnote 15
This may well be the case in general, but what happens in instances when voters do become aware of the trade issue and its distributive consequences? Several recent studies offer insight on the first question, primarily through survey experiments.Footnote 16 Based on such evidence, Rho and Tomz find that informing people about the winners and losers from trade makes it more likely that their policy preferences will reflect their personal economic interests.Footnote 17 Similarly, Schaffer and Spilker show that people exposed to information regarding the negative impact of trade on their industries are less likely to support free trade.Footnote 18
This evidence still leaves open the question of whether such information actually affects how people vote. Under what conditions do people become aware of the trade issue and its impact—realized or potential—on their economic well being? For one, people may learn about it from the news in cases where the issue of trade becomes a prominent topic.Footnote 19 Voters might also obtain information or cues from their preferred politician or representative of the opposition party.Footnote 20 They might also learn about the impact of trade through their employer or organized interest groups, who may seek to mobilize workers on a specific policy matter or initiative.Footnote 21 In recent work we provide evidence of this channel of influence, showing how labor unions in the US provide information and help shape their members’ trade policy preferences.Footnote 22
The threat of voter accountability helps explain politicians’ tendency to advance trade policies that benefit and privilege their constituents. In particular, politicians tend to support trade deals that benefit or shield specific industries concentrated in areas that are important for their electoral prospects.Footnote 23 However, the inverse of this logic is that foreign governments can potentially seek to obtain concessions from their trading partner by threatening to pursue tariffs on goods produced by politically important industries and constituencies. Imposing foreign economic pressure on the adversary's support base is similar to the logic underlying the use of “smart sanctions”—a tool that targets government supporters while minimizing adverse consequences for broader society.Footnote 24 Yet notably, studies of smart sanctions have to date focused almost exclusively on traditional economic measures, such as freezing funds, travel bans, restrictions on investment, and embargoes on goods. Little has been written about the use of selective tariffs as a potential form of smart sanctions.
Analysts expected the costs of a protracted trade war with the US on China's economy to be immense. China had clearly preferred to bring the dispute with the Trump administration to a quick resolution without succumbing to President Trump's demands. Our conjecture is that to resolve the dispute, the Chinese sought to impose maximum political pressure on Trump and his Republican allies in Congress. This was done with the hope that China's potentially inflicting electoral harm would lead to the president seeking a quick and peaceful conclusion to the simmering conflict. If our conjecture is correct, the key question the Chinese faced was how to impose such electoral costs most effectively. Given that the presidential elections were almost three years away, placing pressure on the president required threatening his allies’ standing in Congress. With this logic in mind, we would expect the Chinese to impose tariffs on goods produced in: (1) locales with a high share of Trump voters; (2) Republican-heavy counties located in highly competitive Congressional districts.
In selecting which goods to penalize with tariffs, Chinese officials must have been aware that the tariffs would raise the cost of those goods imported from the US. Thus, in addition to the electoral considerations we described, China may also have sought to minimize the imposition of tariffs on items whose primary or sole exporter was the US. By placing tariffs on only (or mostly) goods that China could import from other countries, China would reduce the potential harm to its domestic market. It is therefore possible that the goal of placing the greatest political pressure on President Trump with an electorally minded list of tariffs was tempered by a desire to minimize the adverse consequences on its own economy. Alternatively, the desire to bring the conflict with the US to a swift end, combined with the fact that China is an autocracy that is presumably less concerned with public opinion, might mean that the weight the Chinese leadership assigned to the domestic market consideration may have been relatively low.
A number of concurrent studies also examine political aspects related to the US–China trade war and offer evidence consistent with some of our conjectures. Fetzer and Schwarz find that areas with traditionally higher Republican support were more likely to be targeted by tariffs imposed by America's major trading partners, not just China. They report a subsequent drop in Republican support and in the approval rating of President Trump.Footnote 25 Blanchard, Bown, and Chor find that this drop hurt the Republicans in the 2018 midterm elections,Footnote 26 while Chyzh and Urbatsch show that loss of Republican vote share was particularly notable in soybean-producing counties, a prominent target of China's early tariffs.Footnote 27
While these studies speak to several aspects of our study, they nonetheless differ in their focus, the theoretical conjectures they test, and their empirical approach. Most pertinently, our research centers on the domestic political dimension. Specifically, we analyze how US electoral politics shaped the formation of China's tariff strategy, and explore Americans’ information sources regarding the trade war, their attributions of blame, and subsequent voting behavior. By contrast, Amiti, Redding, and Weinstein and Fajgelbaum and colleagues focus on estimating the economic cost of the trade war to American consumers and the US economy; Chyzh and Urbatsch center on the politics of tariffs on the soybean sector; and Fetzer and Schwarz are primarily interested in how countries traded off between maximizing the political targeting of tariffs and mitigating harm to their own economy.Footnote 28 Thus, our study's focus on the behavioral mechanisms underlying voters’ response to the trade war is largely absent from these studies. Finally, and more technically, the papers differ in the way they measure some of the key variables, in particular the degree of a geographical unit's exposure to retaliatory tariffs.Footnote 29 As a result of these differences and others, the studies offer different insights into the domestic political dimension of the US–China trade war.
Data
To examine China's tariff strategy and its electoral consequences, we develop a new measure of exposure to Chinese retaliatory tariffs at the county level. Combining this measure with election data, we examine the extent to which China's tariff imposition was motivated by electoral considerations, and how successful this strategy was in exacting an electoral cost on Republican candidates.
Exposure to Tariffs
We measure exposure to the retaliatory tariffs as the share of workers in each county employed in industries targeted by China. This measure captures the geographical variation in the degree of exposure to the Chinese tariffs by linking commodity-level data with county-level employment data. The employment share in the targeted industries approximates the size of the workforce vulnerable to the retaliatory tariffs, which captures the intended electoral costs of China's strategy.
China issued tariffs over four rounds from April to September in 2018. In retaliation against the US administration's decision to place tariffs on steel and aluminum, China responded in April with the first round of retaliatory tariffs, targeting a total of 128 items. As trade relations worsened, China expanded its list to include 545, 333, and 5,207 additional items, as announced respectively in June, August, and September 2018. For each round, we collected a list of all targeted items.Footnote 30 We matched HS codes of targeted line items to NAICS sectors, both at the six-digit level.Footnote 31 Based on this matching, we examine whether or not a given NAICS sector is targeted by retaliatory tariffs.Footnote 32 Table 1 lists the five most affected industries in terms of the size of employment targeted in each round of retaliatory tariffs. As the list makes clear, the first round disproportionately targeted the agricultural sector, while the manufacturing sector was targeted from the second round onward. Our final measure is calculated as the percentage of workers employed in those targeted sectors at the NAICS six-digit level.Footnote 33
TABLE 1. Tariff-targeted industries, by the size of employment

Notes: The table presents the list of five targeted industries with the largest number of employed workers in each of the four rounds of Chinese retaliatory tariffs. The first and second columns list the six-digit NAICS industry code and its description, respectively. The third column lists the number of workers employed in each industry. The employment figures are from the 2016 County Business Patterns (CBP) and the Quarterly Census of Employment and Wages (agriculture sector only).
We calculate this measure separately for each round of tariffs as well as for all rounds combined. Figure 1 illustrates the geographical distribution of our exposure measure. The upper left panel illustrates the degree of exposure to the first round of tariffs imposed in April 2018, when China targeted 128 commodities. While only 1.1 percent of workers on average were affected by the tariffs in each county, there were seventy-one counties with more than 10 percent of workers employed in affected industries (e.g., counties in Washington and California with large shares of fruit- and tree-nut-farming industries). The other three panels cumulatively add the measure of exposure to the second, third, and fourth rounds of tariffs imposed in June, August, and September of the same year. With the expansion of retaliatory tariffs, the average share of affected workers at the county level increased to 3.3 percent and 5.6 percent in June and August, respectively. With a sharp escalation of the trade war, by September this figure had jumped to 16.7 percent, but the figure shows that the degree of exposure varied greatly both across regions and within states.Footnote 34

FIGURE 1. County-level exposure to Chinese retaliatory tariffs
Notes: The figure illustrates county-level variation in the percentage of workers employed in the industries targeted by China's retaliatory tariffs. Subfigures (a)–(d) illustrate the percentage of workers affected by the tariffs imposed by April, June, August, and September. For each round, we cumulatively add the percentage of workers affected by all previous rounds of retaliations.
Electoral Geography
To examine the degree of political targeting in China's retaliatory strategy and its electoral consequences, we combine the exposure measure we described with information on voting across districts and counties. If the Chinese aimed to reduce support for the Republican Party in the 2018 midterm election, it is likely that they considered America's electoral geography in designing their tariffs. In fact, one might argue that given the enormity of the stakes involved in the trade conflict, assigning a small team of data scientists the task of identifying a tariff schedule that would hurt the Republican's political base—and thus affect the president's calculus—seems an almost obvious step from the Chinese perspective. To assess whether that was indeed the case, we focus on the results and trends in the two preceding congressional elections. Specifically, we measure county-level support using the average Republican two-party vote share in the 2014 and 2016 House elections.Footnote 35
We define a swing district as one where the Republican two-party vote share was between 40 and 60 percent in both of the 2014 and 2016 House elections.Footnote 36 We then consider whether a given county is located within the boundary of a swing district. Because counties often straddle multiple districts, we spatially merge maps of counties and districts and calculate a given county's share of land areas that overlap with any swing district. We then consider the county as located within the swing district when there is at least 20 percent overlap with a swing district.Footnote 37
We examine the electoral impact of China's retaliatory tariffs on the 2018 midterm elections. Our focus is the shift in electoral support for the Republican candidate in each district between the 2016 and 2018 House elections. By using the difference in the Republican two-party vote share between the two elections, we account for any unobserved time-invariant county-level characteristics that are correlated with the county's level of support for the Republicans. We also account for a county-level temporal trend in voting by controlling for the change in the Republican two-party vote share in the previous election cycle (i.e., between the 2014 and 2016 House elections).
Political Targeting of Chinese Retaliatory Tariffs
To what extent did China's selection of products for tariffs reflect an effort to decrease electoral support for Republican candidates? Before the first round of tariffs was announced, the People's Daily published an op-ed that called outright for retaliatory tariffs to target key industries in Trump-supporting constituencies.Footnote 38 But that was not the official government stance. In fact, when asked by a CNN reporter if the tariffs China placed on soybeans were aimed at hurting producers located in areas important to Republicans, Chinese Vice Minister of Finance Zhu Guangyao emphasized only economic considerations: “We are analyzing the challenges from the perspective of the economy itself … Chinese farmers petitioned that the US subsidies are hurting the interests of Chinese soybean growers, and China must respect the farmers’ demands.”Footnote 39
Those denials aside, if a chief motivation guiding the Chinese strategy was to knee-cap support for Republican candidates in the midterm elections, we would expect the targeted goods to be produced in industries concentrated in areas with Republican voters. But given that in many US districts one of the two major parties enjoys a large, almost unassailable advantage, it is likely that the Chinese would focus their attention on hurting the chances of Republican candidates competing in swing districts because in those cases even small shifts in voting could have a large impact on the eventual outcome.
Figure 2 presents the geographical variation in electoral support for Republican candidates in the 2014–16 House elections. The two-party vote share of Republican candidates is illustrated at the county level. Swing districts are denoted using the thick black lines. As shown in the figure, support for Republican candidates often varies to a significant degree within the same district. Our expectation is that Republican counties in swing districts will be more likely to be targeted by China's tariffs. For example, in the first round of retaliatory tariffs China included nuts in the list of goods. It turns out that tree-nuts farming is concentrated in a few counties in California, with Kern and Fresco counties—two Republican strongholds—accounting for more than 30 percent of employment in the entire US nuts-farming industry. The tariffs China imposed on nuts thus had a major adverse impact on the economy of Republican-heavy counties in California's twenty-first district, where the incumbent Republican representative was expecting a close race in 2018.Footnote 40

FIGURE 2. Republican share of the two-party vote for House of Representatives and the competitive districts in the 2014 and 2016 elections
Notes: The figure shows the average Republican two-party vote share in the 2014 and 2016 House elections. Black thick solid lines indicate swing districts where the district-level Republican two-party vote share was between 40 percent and 60 percent in both the 2014 and 2016 House elections.
To test this expectation, we estimate the following linear regression model:
 $$\eqalign{Y_i &= \alpha + \beta _1{\tf="Times-RomanSC (Screen)"{ gop\; vote\; share}}_i + \beta _2{\tf="Times-RomanSC (Screen)"{swing\; district}}_i \cr &\quad+ \beta _3{\tf="Times-RomanSC (Screen)"{gop\; vote\; share}}_i\;\ast\; {\tf="Times-RomanSC (Screen)"{swing\; district}}_i + \mu _i + {\epsilon }} $$
where the dependent variable Yi is the share of workers employed in targeted industries in county i, gop vote share is the average Republican two-party vote share in the 2014 and 2016 House elections, and swing district is a binary indicator denoting whether at least 20 percent of a given county i's land is located within any swing district as we defined. We include an interaction term between gop vote share and swing district as well as state fixed effects μ in all models. Observations are weighted by counties’ total voting age population as of 2016.
The primary variables of interest are gop vote share and its interaction term with swing district. We expect β 1, the coefficient on gop vote share, to be positive and statistically significant. If China's retaliatory tariffs were targeted at Republican voters, we should observe a higher degree of exposure to the tariffs in those counties with a higher share of Republican supporters. Also, given the expectation that China would be particularly prone to target Republican counties in competitive districts, we expect β 3, the coefficient on the interaction term, to be positive and statistically significant.
Table 2 presents the results. We separately estimate the models for each round of retaliation. In the first two models, our dependent variable is the share of workers employed in industries targeted by the tariffs imposed by China in the first round of retaliation in April. The next models focus on the share of workers targeted by the next three rounds that took place in June, August, and September. For each round, we begin with a model with a continuous measure of the two-party gop vote share and a binary indicator for swing district along with state fixed effects. We then add the interaction term between gop vote share and swing district.
TABLE 2. Counties targeted by retaliatory tariffs

Notes: Dependent variables in models 1 to 2 are the percentage of workers employed in industries targeted by the first round of Chinese retaliation in April. The next models focus on the second, third, and last round of retaliation in June, August and September, respectively. All models include state fixed effects. All regressions are weighted by counties’ total voting age population in 2016. Robust standard errors in parentheses. * p < .10; ** p < .05; *** p < .01.
The results are consistent with our predictions. First, the coefficient on gop vote share is positive and statistically significant throughout the models. The sizable coefficient suggests that counties with more Republican supporters were more heavily hit by the retaliatory tariffs. Second, targeting of Republican counties appears to be concentrated in swing districts in the first two rounds of retaliation, as suggested by the positive and statistically significant coefficient on the interaction term in models 2 and 4. According to model 2, a ten-percentage-point increase (approximately half of one standard deviation) in the two-party vote share of the Republican party is associated with a 0.12 percentage point increase in the share of the targeted workforce in nonswing districts. This represents a 10.8 percent increase above the mean. Yet in swing districts, the corresponding figure is substantially larger: the targeted share of the workforce is higher by 0.55 points, accounting for a 48.4 percent increase above the mean. The substantive effects are similar in model 4 which examines the second round of retaliation.
The results also suggest that the political targeting of tariffs was less precise in the later rounds. While China had to counter America's sharp escalation of the trade war by placing tariffs on a similar volume of trade, media reports speculated that China had already exhausted its options in the early rounds and therefore had to broaden its tariffs to cover goods that were not produced in areas with similar politically sensitivity.Footnote 41 Our results are consistent with this observation. While the coefficient on gop vote share appears positive and statistically significant throughout all four rounds, the interaction term is significant only in the first two rounds, as models 1 and 3 show.Footnote 42
An alternative explanation for these findings may be that industries that produce the bulk of exports just happen to be located in Republican-leaning counties, in which case the correspondence between the Chinese tariffs and the electoral variables is not evidence of an electorally motivated retaliatory strategy. While it is unlikely that exporting industries would just happen to be concentrated in Republican-leaning counties in competitive congressional districts, we further test this possibility by analyzing the Chinese targeting strategy using the product (rather than industry) as the unit of analysis. Specifically, we ask whether the likelihood of being targeted by Chinese tariffs is higher when the relevant industry's production is concentrated in Republican voting districts. To this end, we generate a new measure, republican concentration, which captures the degree of concentration of the relevant industry's employment in Republican-voting areas.Footnote 43 Using this measure, we estimate the following model:
 $$\eqalign{ Probit\lpar Y_i\rpar& = \alpha + \beta _1\,Reublican\,Concentration_i \cr & \quad + \beta _2Log\lpar Exports\,to\,China\rpar _i + Import\,Dependence\,on\,the\,US_i + { \epsilon }_i\comma \;} $$
where Yi denotes whether product i was targeted in each round of Chinese retaliation. In addition to republican concentrationi , we control for product i's export volume of China in 2016.Footnote 44 We also control for the the US share of Chinese imports to measure each product's import dependence on the US.
The results, reported in Table 3, show that a relevant industry's concentration in Republican-leaning districts is systematically associated with a higher probability of being targeted in early rounds of retaliation, even when controlling for the industry's export volume to China and the Chinese import dependence on the US. Consistent with the pattern we reported, we again see that in the later rounds, when a huge number of additional tariffs were introduced, republican concentration is no longer a statistically significant predictor. We further show that the findings are not a result of chance by simulating a set of alternative tariff schedules that are randomly selected to cover a similar volume of goods to the one actually pursued, following a similar approach to the one introduced by Fetzer and Schwarz.Footnote 45 As we discuss in section A2.2 in the online appendix, these simulations demonstrate that the tariff schedule that China selected was targeted at Republican-heavy districts in a way that was clearly not the result of chance. In fact, 99 percent of the randomly simulated tariff schedules were less targeted at Republican voters.
TABLE 3. Product-level analysis of Chinese tariffs

Notes: Dependent variables in models 1 to 4 are the binary indicators for being included in the Chinese retaliation tariff list announced in April, June, August, and September, respectively. We include all six-digit HS products model 1, but subsequently exclude the products targeted in the earlier rounds from model 2. Republican concentration measures the relevant industry's degree of concentration in Republican districts. Marginal effect in the main entries. Robust standard errors in parentheses. * p < .10; ** p < .05; *** p < .01.
We also find that there existed a wide range of alternative tariffs schedules on baskets of goods that were less dependent on imports from the US, further indicating that the chief concern of the Chinese was to inflict maximum political pressure on the Republicans, rather than minimizing potential disruption of imports to the Chinese market. In the appendix we also present results of a similar analysis to the one shown in Table 2, this time controlling for each county's total export value and agricultural export value. The findings remain substantively similar, as reported in appendix Tables A9 and A10, further demonstrating that our results are not driven by the concentration of exports in targeted areas.
Taken together, these results provide compelling evidence that the Chinese tariff strategy was designed to hamper the electoral prospects of the Republican Party. The strong empirical relationship we observe between the political geography of production and a county's exposure to the newly imposed tariffs clearly indicates that electoral considerations played an important role in guiding China's selection of retaliatory tariffs.
Electoral Impact of China's Retaliatory Tariffs
How successful was China's strategy in exacting an electoral cost on Republican candidates? We assess the electoral consequences of China's retaliatory tariffs by examining the county-level shift in the Republican vote share between the 2016 and 2018 House elections.Footnote 46 With the dependent variable Yi denoting the change in the Republican share of the two-party vote for House representatives in each county i, our regression model is specified as follows:
 $$Y_i = \alpha + \beta _1\,\hbox{Targeted by Chinese Tariff}_t + \beta _2\,\hbox{Protected by US Tariffs} + X_i\gamma + \mu _i + {\epsilon }$$
where targeted by chinese tariff is the county-level exposure, measured as the percentage of workers targeted by retaliatory tariffs.Footnote 47 Because the US concurrently imposed tariffs on Chinese imports, we control for protected by us tariffs, which measures the percentage of workers employed in industries protected by the American tariffs.Footnote 48 All models include a vector of demographic controls, Xi, to account for their likely effect on voting.Footnote 49 State-fixed effects μ are also included in all models. To assign more weight to larger counties that are more influential in determining the electoral outcome, we weight the observations by voting-age population as of 2016.Footnote 50 We also control for the average over-the-year percentage change in weekly wage between 2017 and 2018.Footnote 51 Finally, some specifications control also for the voting trend in the previous election cycle (Δ republican vote (%), 16–14).Footnote 52
Table 4 presents the results. Since tariffs were imposed at different times, the expected electoral effects also differ because of the difference in temporal proximity to the midterm election. We thus estimate the same models varying the measure of targeted by chinese tariff, depending on the timing of tariff imposition. In the first two models, we estimate the effects of the county-level exposure to retaliatory tariffs imposed by April. We then estimate the effects of the exposure to tariffs accumulated by June (i.e., adding the exposure in June to the first round of tariffs in April) and through August (i.e., the first three rounds of tariffs) in models 3 to 4 and 5 to 6, respectively. The last two models estimate the effects of overall exposure to tariffs imposed at any time, including the tariffs that came into effect on 23 September.Footnote 53
TABLE 4. Retaliatory tariffs and midterm election

Notes: Dependent variables are the continuous measures of the change in the percentage of two-party Republican vote share between 2016 and 2018. The primary independent variable, targeted by chinese tariffs, measures the percentage of workers targeted by the retaliatory tariffs imposed by April in models 1–2, by June in models 3–4, by August in models 5–6, and by September in models 7–8. All models include state fixed effects and demographic controls. All regressions are weighted by counties’ total voting age population in 2016. Robust standard errors in parentheses. * p < .10; ** p < .05; *** p < .01.
The results indicate that the Chinese strategy was quite effective in exacting electoral costs on the Republican Party. In all models, the county-level exposure to the Chinese tariffs is negatively associated with the shift in the Republican share of the two-party vote in the House elections, while the US-initiated tariffs seem to have had only marginally positive effects. Substantively, for every percentage point increase in the share of workers exposed to China's retaliatory tariffs, the Republican share of the vote decreased by 0.12 to 0.47 percentage points compared to the previous election, depending on the timing of when the tariffs were imposed. Note that these models account for the over-the-year change in weekly wages. This suggests that the negative effect of the tariffs on the Republican Party's support was driven not just by the realized economic changes that voters experienced as a result of the trade war. Rather, these voting patterns probably reflected voters’ expectations about the future impact of the trade war and were a rebuke of Republican candidates backing the president's trade policy.
Another notable finding is that the size of the coefficient consistently shrinks as we include the later rounds of tariffs. While the county-level exposure to tariffs is associated with a decrease in Republican vote share of 0.47 percentage points when we look at only the tariffs imposed by April (model 1), the corresponding figure drops to 0.13 points when we examine the exposure to all rounds of tariffs announced by September (model 7). This weakening effect may be explained by several factors. First, voters were probably less informed about the specific industries and goods targeted in the later round of tariffs because it included over 5,000 products. Second, in the September round there was a considerable overlap between Chinese retaliatory tariffs and the US-initiated tariffs because both countries targeted thousands of line items. This might have muddled voters’ assessments of the potential effects of the trade war.Footnote 54 Finally, the September rounds were less likely to have had an economic impact on voters because they were announced only a short time before the elections took place.
To assess the implications of the shift in vote induced by the tariffs, we conduct a counterfactual analysis in which we examine how the election results would have differed had there been no retaliatory tariffs imposed by China while keeping the US tariffs. We also consider a more realistic scenario whereby neither the US-initiated nor the Chinese retaliatory tariffs had been imposed. While our results differ depending on our model selections, our estimates suggest that the Republican Party would have gained three to eight more seats under different hypothetical scenarios (see appendix section A5 for more discussions on the counterfactual analysis).Footnote 55 These results indicate that the tariff war had a modest, albeit non-negligible impact on the House elections, particularly when one considers the gerrymandered and highly polarized nature of US electoral geography, where only a small number of seats is truly competitive.
Finally, we examine possible heterogeneous effects of Chinese tariffs imposed on agricultural versus non-agricultural sectors. Given China's importance as an export market for American agricultural products, the retaliatory tariffs were particularly painful for the US agricultural sector. To assuage farmers’ discontent, the Trump administration promised to provide USD 12 billion in subsidies, though a sum of only USD 838 million was paid by the time of the election.Footnote 56 Our analysis shows that the electoral effects are largely driven by the agricultural sector (appendix Table A18).Footnote 57 China's retaliatory tariffs are negatively associated with support for Republicans in both agricultural and non-agricultural sectors, but the effects are a good deal larger and statistically significant in areas that produce targeted agricultural goods. The findings also provide suggestive evidence that the votes against the Republican Party might have been largely driven by exporters’ mobilization against the party, given that the targeted agricultural sector was mainly concerned about the export markets.Footnote 58
The increase we find in the Democratic vote share in areas targeted by China's tariffs can arise from former Republican voters switching their vote to the Democratic candidates. Yet it can also arise from the tariffs mobilizing new voters to turn out to vote. Table 5 offers insight on this by examining the percentage change in total vote counts in the two last elections, that is, before (2016) and after (2018) the trade war began. We do not find any consistent evidence that turnout in counties more affected by the tariff was different than in less-affected counties. If anything, turnout decreased slightly in areas that were protected early by US-initiated tariffs, as models 3 and 4 report. It therefore seems that an increase in turnout does not account for the electoral shift we observe following China's retaliatory tariffs.
TABLE 5. Retaliatory tariffs and voter turnout

Notes: Dependent variables are the percentage change of total number of votes cast for the House elections between 2016 and 2018. The primary independent variable, targeted by chinese tariffs, measures the percentage of workers targeted by the retaliatory tariffs imposed by April in models 1 and 2, by June in models 3 and 4, by August in models 5 and 6, and by September in models 7 and 8. All models include state fixed effects and demographic controls. All regressions are weighted by counties’ total voting age population in 2016. Robust standard errors in parentheses. * p < .10; ** p < .05; *** p < .01.
Was China's Tariff Strategy Unique?
The escalating trade war with China was by far the most salient, but not the only front of America's trade disputes. Since the election of President Trump, the US has been in conflict over trade policy with the European Union and with Mexico and Canada, its trading partners in the North American Free Trade Agreement (NAFTA). As part of the dispute, those trading partners also countered US measures by placing tariffs on American goods. How similar was their strategy of product selection compared to that of China, and did those tariffs have a comparable electoral impact?
In Table 6 we examine the strategy of tariff imposition by the EU (models 1–2), Canada (models 3–4), and Mexico (models 5–6). As the results indicate, all three have targeted counties with strong GOP support. However, unlike the Chinese approach, we find no clear differentiation between swing versus nonswing districts. In other words, the composition of China's tariffs seems to have been uniquely suited to inflict electoral costs on the Republicans in a way that the retaliation strategy pursued by other trading partners was not.
TABLE 6. Political targeting of retaliatory tariffs by the EU, Canada, and Mexico

Notes: Dependent variables are percentage of workers employed in industries targeted by the retaliatory tariffs of the EU in models 1 and 2, Canada's in models 3 and 4, and Mexico's in models 5 and 6. All models include state fixed effects. All regressions are weighted by counties’ total voting age population in 2016. Robust standard errors in parentheses. * p < .10; ** p < .05; *** p < .01.
Following a simulation approach introduced by Fetzer and Schwarz,Footnote 59 we again compare the actual baskets of targeted items with randomly simulated hypothetical baskets. While the approaches differ slightly, the findings are largely consistent. As we explain and show in the online appendix (section A2.2), the degree of political targeting in the basket of items actually selected for tariffs by Mexico, Canada, and the EU was not systematically different from other randomly selected baskets. By contrast, China's selection showed a distinctive pattern of heavy concentration in Republican-supporting areas. Another notable difference is the extent to which the domestic economic costs were considered in the selection of retaliatory tariffs of each country or bloc. While it is beyond the scope of our study to estimate these domestic costs of retaliatory tariffs, when using a measure of import dependence on the US as a proxy, we find that China was the least likely to consider the potential costs of the tariffs on its domestic economy. In contrast, the EU seems to have selected a basket of items that would minimize the potential costs on the region's economy.
To compare the electoral impact of retaliatory approaches taken by the US's trading partners, we analyze the empirical relationship between the tariffs they selected and support for Republican candidates in the 2018 midterm elections. In Table 7 we present the association between the tariffs’ coverage and the Republican two-party vote share, analyzing the effect separately for the EU, Canada, and Mexico (models 1–6) and combining the exposure to tariffs imposed by all three counterparts (models 7–8). The coefficient on targeted by retaliatory tariffs is consistently negative except for the case of Canada's tariffs, but statistically indistinguishable from zero in all models.Footnote 60
TABLE 7. Retaliatory tariffs and midterm election, by trading partner

Notes: Dependent variables are the continuous measures of the change in the percentage of two-party Republican vote share between 2016 and 2018. The primary independent variable, targeted by chinese tariffs, measures the percentage of workers targeted by the retaliatory tariffs imposed by the EU in models 1 and 2, by Canada in models 3 and 4, by Mexico in models 5 and 6, and by all three actors in models 7 and 8. All models include state fixed effects and demographic controls. All regressions are weighted by counties’ total voting age population in 2016. Robust standard errors in parentheses. * p < .10; ** p < .05; *** p < .01.
Mechanisms: Why Were Republican Candidates Punished?
The results so far reveal a strong association between geographic exposure to China's retaliatory tariffs and a drop in support for Republican candidates in the 2018 elections. This pattern raises several questions. Were people simply voting against the incumbent party because of worsening economic conditions, that is, without making a connection to the trade war with China? Or did the drop in Republican support stem from citizens’ conscious response to the US–China trade war, assigning blame to those they perceived as responsible for the escalating situation? If it was a conscious response, how did voters learn about the trade war? Finally, were voters reacting to a worsening of their own employment situation or to indications of economic decline in their area of residence? To get some handle on these questions, we examine campaign communications by congressional candidates, data on online search patterns, and original survey data of American voters.
Evidence from Campaign Communications
To understand how voters learned about the trade war, we begin with the immediate suspects: representatives of the challenger party, in this case the Democrats, because they had a clear incentive to inform voters about the adverse effects of the trade war and blame their Republican rivals for this development.
We find a host of examples that illustrate how Democratic candidates used the trade war as a key campaign issue. For instance, TJ Cox, a Democrat from California's twenty-firstst district, repeatedly criticized her rival Representative David Valadao (R), then third-term incumbent, for being culpable: “As Trump's trade war with China escalates, we face dire consequences here at home. By voting with Trump 99 percent of the time, @dgvaladao shows he is unwilling to stand up for our farms and communities here in the Central Valley.”Footnote 61 Democrats attacked their Republican rivals not only for active support of Trump's trade policy but also for not standing up against it. Angie Craig of Minnesota's second district, for example, issued a press release stating: “our nation's trade war with China is having a real and very negative impact on farmers … Politicians in Washington—including US Rep. Jason Lewis—are only making things harder for Minnesota's farmers … Lewis is silent on this administration's trade policies. That says a lot.”Footnote 62 (See appendix section A1.3 for additional examples of press releases and official tweets by members dealing with the trade war in the run-up to the elections).
We expect that such campaign communications on the trade war would be most common in the areas most targeted by China, that is, in places where the issue is more likely to resonate with voters. Furthermore, it is likely that opposition candidates would be playing up the issue since they ostensibly have more to gain from making the costs of the president's policy salient. We test these expectations by drawing on a data set we assembled of all candidate communications in official press releases and social media platforms in the 2018 House elections.Footnote 63 We constructed the measure of the percentage of campaign publications that include the phrase “trade war” by Democratic and Republican candidates in the House election. With this measure as the dependent variable (ranging from 0 to 9.6), we examine whether the degree of a district's exposure to the tariffs is associated with an increase in candidate attention to the trade war, especially among Democratic candidates.Footnote 64
A simple comparison of means is revealing. About 35.8 percent of Democratic candidates addressed the trade war in their campaign communications with voters, while only 8.5 percent of Republican candidates did so. Examining whether these patterns also reflect the districts’ degree of exposure to the tariffs, we see the expected results in Table 8. Not only were Democratic candidates more likely to discuss the trade war in their communications with voters but they also discussed it even more frequently when their districts were exposed to China's retaliatory tariffs. This result is indicated by the positive and statistically significant coefficient on the interaction term. Using model 6 as an example, a one standard deviation in the exposure measure of the district is associated with an increase in the share of Democrats’ campaign communications related to the trade war by 0.11, representing a 56.1 percent increase above the baseline. By contrast, the effects for Republican candidates are almost negligible.Footnote 65
TABLE 8. Retaliatory tariffs and campaign communications on the trade war

Notes: Dependent variables are the percentage of campaign communications on the trade war. Democratic candidate denotes the partisanship of House candidate (coded 1 for the Democratic Party and 0 for the Republican Party). Targeted by tariff measures the percentage of workers targeted by Chinese retaliatory tariffs imposed by April in models 1 and 2, by June in models 3 and 4, by August in models 5 and 6, and by September in models 7 and 8. Robust standard errors in parentheses * p < .10; ** p < .05; ** p < .01.
Evidence from Web Search Patterns
To further assess the link between voters’ exposure to the trade war and their awareness of it, we examine data on people's online searches. Specifically, we wish to assess whether people residing in areas at a higher risk of being harmed by the trade war were more likely to actively seek information about the conflict. To this end, we obtained data from Google Trends on the search frequency of the terms “trade war” and “Chinese (China) AND tariffs.” We take the index of the search volume for each key word at the level of metropolitan areas during 2018. The index ranges from 0 to 100 and captures the relative degree of search intensity across areas.Footnote 66
We examine whether the variation in the search index is correlated with the degree of exposure to China's retaliatory tariffs. Because the exposure measure is constructed at the county-level, we aggregate county-level data to the level of metropolitan areas and recalculate the exposure measure.Footnote 67 Because the search index is an annual measure, we use the share of employment targeted by the retaliatory tariffs imposed at any of the rounds. And because engagement with news and search intensity are likely to be correlated with education, we control for the share of individuals with at least a bachelor's degree or a professional degree.
Table 9 presents the results, which provide strong support for the expectations we laid out. We show the results for “Chinese tariffs” in models 1 and 2 and for “trade war” in models 3 and 4.Footnote 68 The results show that individuals searched more for “Chinese tariffs” on the web the greater the exposure to retaliatory tariffs in a given metropolitan area. With one standard deviation increase in the share of targeted individuals, the search index increases by approximately 2.7, representing about 20.5 percent increase above the mean. The results are comparable for searches related to “trade war.” Taken together, these findings indicate that awareness of escalating trade relations with China, as well as interest in learning new information about the situation, were significantly higher in the areas more affected by the trade war. These findings suggest that the drop in support for the Republicans was more than a “generic” response to worsening economic conditions and instead reflected an informed response of voters conscious of the trade war itself.
TABLE 9. Retaliatory tariffs and web searches on trade war

Notes: Dependent variables are the yearly Google search frequency for “Chinese tariffs” in models 1 and 2 and “trade war” in models 3 and 4 in metropolitan areas. Robust standard errors in parentheses. * p < .10; ** p < .05; *** p < .01.
Evidence from Individual-level Data
We have demonstrated that people residing in areas targeted by China's tariffs were more likely to receive communications about the trade war from their Congressional candidates and were also more likely to actively seek information online about the situation. Next, we examine how people assessed the effects of the trade war and how they evaluated the role of relevant political actors in leading to the escalation. To this end, we fielded a national survey among the US population in February 2019, using the services of online polling company Lucid.Footnote 69
Our key outcomes of interest pertained to: (1) the perceived impact of China's tariffs; and (2) the assignment of responsibility for the trade war. With respect to the former, we asked respondents: “As you may know, the US imposed tariffs on some Chinese goods this past year, and China responded by imposing tariffs on some US goods. Please tell us what you think the impact of these tariffs has been on the US economy as a whole, on people in your area, and on you personally.” Respondents then rated the impact on “the US economy,” “people in my area,” and “on me and my family.” The ratings were on a five-point scale ranging from “very bad” (1) to “very good” (5). We dichotomize the dependent variable to equal 1 if the respondent described the effect as either “bad” or “very bad,” and 0 otherwise.Footnote 70
The second question read as follows: “People have different views of who is responsible for the tariffs the US and China have been placing on each other in the past year. From what you have read or heard, what role have each of the following played in these tariffs coming about?” Items were randomized in order of appearance and included: Democrats in Congress, Republicans in Congress, President Trump.Footnote 71 The response options were “no role,” “small role,” “big role,” or “don't know.”
We begin by analyzing the association between the level of exposure to the Chinese tariffs and perceptions of the trade war. To assess whether respondents’ attitudes reflect the adverse impact on their area of residence or on the industry they work in, the model includes two measures of exposure: (1) the workforce in one's county of residence employed in sectors targeted by China's tariffs (i.e., the same measure we use in all previous analyses); (2) the exposure level of respondents’ own industry of employment.Footnote 72 In addition, we control for protected by us tariffs, the measure used earlier, denoting the share of county workers employed in sectors protected by the tariffs the US imposed on China, as well as basic demographics (age, gender, education, race, and employment status).
As Table 10 shows, we find no association between the level of exposure of the industry of employment and perceptions of the US as a whole being hurt by the trade war with China. However, we find a strong empirical relationship between industry exposure and respondents perceiving the trade war as adversely affecting their area of residence. Substantively, an increase of a standard deviation in exposure represents a 9 percent increase above the baseline rate in the share of people holding this view. A shift from an industry that was not affected at all by the tariffs (e.g., rental and leasing, educational services) to one that was most highly affected (manufacturing) is associated with an increase of 44.5 percent in the probability that respondents will report that people in their area of residence have been hurt by the trade war. In line with this finding, the table also shows a positive association between industry of employment and respondents’ report that their family was hurt by the tariffs. It's interesting that this effect is below statistical significance.
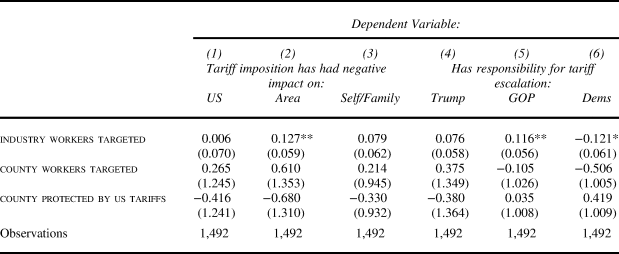
TABLE 10. Views on impact of the trade war and assignment of responsibility

Notes: Dependent variables are binary indicators for whether a respondent considers the imposition of tariffs by China to have had an adverse impact on: the US; one's area of residence; one's family, in columns 1 to 3 respectively. Columns 4 to 6 denote whether the respondent views President Trump, Republicans in Congress, or Democrats in Congress as responsible for the tariff escalation, respectively. The independent variable industry workers targeted is measured as the share of tariffs-affected workers in one's industry of employment; county workers targeted denotes the share of workers in the county employed in sectors targeted the China's retaliatory tariffs; protected by us tariffs is the share of county workers employed in sectors protected by the tariffs the US imposed. All models include state fixed effects and control for education, gender, race, immigrant status, employment status, age, and an indicator variable denoting whether the industry NAICS classification is missing. Standard errors clustered by states presented in parentheses. * p < .10; ** p < .05; *** p < .01.
We also find a positive association between exposure to the tariffs and respondents attributing responsibility to the Republican members of Congress. By contrast, we find a negative association with assigning responsibility to the Democrats in Congress. The positive estimate of attribution to President Trump is below statistical significance, a seemingly surprising result that is probably caused by the small variation in responses to this question. Most respondents attributed responsibility to the president regardless of whether or not they were exposed to the tariffs. A standard deviation increase in industry exposure is associated with a 4.5 percent increase above (10% decrease below) the baseline rate in attributing responsibility to the Republicans (the Democrats). A shift from non-exposure to the highest exposure is associated with a 22.4 percent increase above (49.9% decrease below) the likelihood of viewing the Republicans (the Democrats) as responsible for the trade war.
We find no clear relationship between the share of workers in the county employed in targeted sectors and respondents’ attitudes on any of the six outcomes we examine. This suggests that respondents’ views about the trade war were shaped much more by its impact on their employer and (possibly) their job prospects than on their area of residence. Whether it is because information was primarily conveyed through industry sources (e.g., employers, union representatives) or because people care more about the trade conflict when it directly affects their own livelihood is a question that our data cannot resolve conclusively.
That said, we do find clear indications that the personal toll of the trade war was important in shaping people's views. Specifically, we examine whether those who reported that their families were harmed by China's tariffs were more likely to assign blame to one side or the other. Because such blame attributions can be ex post rationalizations among partisans, we also control for respondents’ party affiliation. Nonetheless, as Table 11 shows, people whose families were hurt by China's response—as captured by this self-reported measure—were more likely to view the trade war as harmful to the US and their area of residence, as well as to blame Trump and the Republicans for the malaise. Importantly, this effect holds even when taking account of respondents’ political preferences, indicating that the assignment of responsibility among those directly hurt by the tariffs goes above and beyond the effects associated with partisanship.
TABLE 11. Views on the trade war and assignment of responsibility, by perceived impact of Chinese tariffs on family

Notes: Dependent variables are binary indicators for whether a respondent considers the imposition of tariffs by China to have had an adverse impact on: the US and on their area of residence in columns 1 and 2 respectively. Columns 3 to 5 refer to whether a respondent views President Trump, Republicans in Congress, or Democrats in Congress as responsible for the tariff escalation, respectively. The binary variable family negatively affected denotes a respondent who perceives the Chinese tariffs as having had an adverse impact on their family. All models include state fixed effects and control for education, gender, race, immigrant status, employment status, and age. Standard errors clustered by states presented in parentheses. * p < .10; ** p < .05; *** p < .01.
Returning to the questions that we posed at the outset, this analysis offers several insights of note. First, it suggests that the shift in the vote against the Republicans in 2018 was at least partially a conscious response to the escalation of the trade war, and not simply a vote against the incumbent for a worsening economic situation. People in affected areas were both more likely to hear from their politicians about the conflict with China and to actively seek out information about it. Second, people's views about the trade war were closely tied to its (realized or expected) economic impact on them. Finally, these views corresponded more strongly with the impact of China's tariffs on individuals’ industry of employment than on their area of residence, suggesting that employment concerns or communications within the workplace were consequential for the way people saw the conflict and attributed responsibility to the politicians.
Conclusion
Trade policy is often described as an electoral issue that is mostly dormant.Footnote 73 Yet empirical evaluation of this depiction is limited by the fact that candidate positions on trade may change (and even converge) to align closer to voters’ preferences on the issue.Footnote 74 Thus, analysis of vote choice on candidates' positions on trade might not reveal a significant effect, even if the issue is important to voters. The US–China trade war provides a special case in this respect because China's tariffs strategy was bound to generate a significant wedge between the stance of the two parties’ candidates on the trade war. Therefore, the endogeneity problem that typically constrains analysts’ ability to properly detect the electoral impact of trade is less present in this case.
Our findings show that voters were indeed sensitive to the issue of trade policy, and in this case, not only to their own government's policy but also to that of the trading partner. As our evidence indicates, politicians competing in areas affected by the tariffs were more likely to speak about the trade war in the campaign, and residents in those areas were more likely to seek more information about the issue and to attribute responsibility for the escalating trade war to members of the ruling party. These findings indicate that voters were not merely responding to a deterioration in the economic conditions, but were knowingly reacting to the trade war itself.
In light of these findings, an important question is how unique the US–China trade war of 2018 was in a historical sense, and whether it can provide lessons about the politics of trade that extend beyond the specific episode. In this context, it is perhaps useful to return to the Smoot-Hawley Tariffs Act of 1930, which massively raised tariffs on more than 900 products, and instigated the largest trade conflict the US was last embroiled in. Recall that while the Smoot-Hawley tariffs were described and debated at the time as a domestic issue, they had significant international repercussions. Not only did American tariffs reduce imports and hurt foreign trading partners, research suggests they also had political consequences that resemble the effect of China's tariffs on the US. For example, McDonald, O'Brien, and Callahan present evidence that the Smoot-Hawley tariffs hurt crucial swing voters in Quebec and the prairie provinces of Canada.Footnote 75 This contributed to voters’ abandonment of the ruling party and to the victory of the Conservatives in the subsequent elections. Moreover, studies indicate that America's trading partners sought to retaliate against the Smoot-Hawley legislation by applying counterpressure. Several European countries—including Spain, Italy, Switzerland, and Portugal—retaliated directly by singling out the US for new tariffs.Footnote 76 Other countries did not officially declare they were doing so, but instead selectively increased duties on products that were predominantly imported from the US.Footnote 77
Despite those similarities, the tariffs imposed by America's trading partners did not appear to target specific politically important constituencies. Clearer evidence of such a strategy's use is available only much later. This may partly be because effective political targeting of tariffs requires quality data that were not available until relatively recently. A cruder version of such a targeting approach occurred during the 1992 Uruguay round of the General Agreement on Tariffs and Trade (GATT), after the French government resisted American demands to reduce agricultural subsidies and price supports. In retaliation, the US placed import restrictions on French white wine, produced in districts that were politically important for the ruling Socialist Party. The move appeared to be effective because the French soon relented.Footnote 78 Clearly, the “surgical” approach China has pursued in its targeting of tariffs seems unique both in comparison to the approach taken by other countries in the 2018 trade war and its sheer scale. Investigating how politically minded targeting of tariffs came to be used is beyond the scope of this study, but is surely a fruitful topic for future research.
Our findings point to several additional promising avenues for study. One is whether certain political systems make the government more vulnerable to tariffs imposed by a trading partner. Earlier studies have shown that regime type is systematically associated with differences in levels of openness to trade,Footnote 79 and with the type of trade protections governments use.Footnote 80 As we have shown, the retaliatory tariff strategy that China advanced was distinctly more combative than those pursued by Canada, Mexico, and the EU. Specifically, China's tariffs appeared to assign greater weight to hurting US political interests and lesser weight to the tariff's potential impact on the home economy. The fact that governments of democracies are more accountable to the public makes them, in theory, more susceptible to foreign economic pressure than leaderships of autocracies. Whether leaders of nondemocracies are indeed more willing to enter high-stakes trade conflicts is a question that merits further investigation.
The evidence we presented indicates that voters punished the incumbent party even without, or before, experiencing the full brunt of the tariffs but a question remains about how voters would respond if and when the actual costs are fully realized. On the one hand, higher costs may strengthen the perception among voters of a policy failure, leading them to turn against the incumbent even more than we have seen. On the other hand, if things turn sufficiently bad, voters may rally in support of the leadership and shift the blame to the foreign adversary. These long-term effects may also vary across different groups of partisans as a function of their prior attitude about the government. The electoral fortunes of the incumbent party may very much depend on the balance between those two opposite responses.
Finally, a question of growing importance is how people learn about the implications of trade openness. Our analysis put the spotlight on the information provided by politicians, as well as on people's own efforts to learn about the situation. Earlier research indicates that labor unions also serve as information providers about trade policy to their members.Footnote 81 But that is surely only a partial list. How influential is reporting in the national media, as opposed to local news or social media? As key aspects of globalization are politicized into contentious electoral issues, it is increasingly important to understand the sources of information that people rely upon and how that information shapes their views. As the unfolding of the US–China conflict indicates, the implications for both incumbent politicians and for the trade policy they pursue is likely to be of great consequence.
Data Availability Statement
Replication files for this article may be found at <https://doi.org/10.7910/DVN/1GGBBK>.
Supplementary Material
Supplementary material for this article is available at <https://doi.org/10.1017/S0020818320000612>.
Acknowledgments
We thank Taegyun Lim, Lanxin Ju, and Shir Raviv for excellent research assistance. For valuable feedback and suggestions, we thank Su-Hyun Lee, Dennis Quinn, Joonseok Yang, and participants at the 2019 World Congress for Korean Politics and Society, the 2019 International Studies Association Asia-Pacific Conference, the 2019 Annual Meeting of the American Political Science Association, the 2019 International Political Economy Society, the political economy seminar at Konstanz University, as well as the editors and reviewers of this journal.
Funding
This work was supported by the Ministry of Education of the Republic of Korea and the National Research Foundation of Korea (Grant No. NRF-2019S1A5A8034621).