

The ongoing confrontation between China and the United States over currency policy illustrates a broader phenomenon: exchange-rate misalignments tend to spill over into trade policy. Just as the United States has threatened to impose trade barriers on imports from China and other countries that maintain “fundamentally undervalued” currencies, protectionism increased during previous exchange-rate controversies.Footnote 1 During the Great Depression, deficit countries that resisted devaluing their currencies also increased their trade barriers.Footnote 2 In the Bretton Woods era, at least nine major industrial countries—including Canada, France, Sweden, and the United Kingdom—imposed “import surcharges” (uniform tariffs) in the hope of avoiding exchange rate changes.Footnote 3 Similarly, the US dollar's appreciation in the early 1980s provoked the US Congress to ramp up antidumping restrictions and other “administrative” trade barriers.Footnote 4
Although previous studies have shown that protectionist activity is positively related to the level of the real exchange rate, we demonstrate that this elasticity varies by industry.Footnote 5 Several industry-specific characteristics determine the protectionist response to changes in the exchange rate, including the extent of exchange-rate pass-through, the level of import penetration, and the share of imported intermediate inputs in total industry inputs. We predict that industries with higher pass-through, larger import penetration ratios, and lower ratios of imported intermediate inputs to total inputs will demand more trade protection in response to currency appreciations.
Exchange Rates and Protectionism
A number of studies have examined the overall relationship between currency appreciation and protectionism. Irwin and Eichengreen and Irwin show that aggregate protectionism during the Great Depression was the favored policy response in countries that kept their currencies fixed to gold, once partner countries devalued their own currencies.Footnote 6 Oatley examines “waves” of protectionism in six industrialized countries since the 1970s and connects these protectionist cycles to movements in real exchange rates.Footnote 7 Knetter and Prusa provide similar evidence for the United States, the European Union, Australia, and Canada.Footnote 8 Their estimates suggest that a one-standard deviation real appreciation of the domestic currency increases antidumping filings by 33 percent. Niels and Francois find that antidumping complaints are systematically related to movements in the exchange rate and the current account in Mexico.Footnote 9 Bergsten and Williamson, Grilli, and Irwin all show that protectionist legislation and antidumping petitions in the United States vary with the real exchange rate.Footnote 10 However, none of these studies explore the relationship between exchange rates and trade barriers at the industry level of analysis.
In Figure 1, we reproduce the basic association between the level of the real effective exchange rate of the US dollar and aggregate protectionism, as proxied by antidumping cases investigated by the International Trade Commission (ITC). We use the real effective exchange rate (REER) because it internalizes the currencies of multiple trading partners and adjusts for differences in price levels across countries. We use antidumping cases investigated by the ITC because they provide year-to-year variation on the demand for relief from trade competition. These data clearly indicate that the number of antidumping cases increases when the dollar appreciates. The one outlier—1992—is the exception that tests the rule. On 8 July 1992, the steel industry filed forty-seven separate antidumping petitions on various countries for four types of steel products. If we reduce these forty-seven cases to four—since this flurry of steel-related cases was not independent—this positive correlation becomes even more significant.Footnote 11

Figure 1. Exchange rates and antidumping investigations, 1979–2009
This relationship is meaningful in a substantive sense as well. Simulating the effect of increasing the REER by one standard deviation above its mean—a roughly 10 percent real appreciation of the dollar—increases the number of antidumping petitions filed at the ITC by about ten cases per year (the 95 percent confidence interval ranges from about three to seventeen cases). Given that thirty-nine cases are filed per year on average, this suggests that a 10 percent real appreciation leads to a 26 percent increase in antidumping activity.Footnote 12
One indication that exchange rates have different effects on different industries is the large number of antidumping petitions filed by firms in the “Primary Metal Manufacturing” industry (North American Industry Classification System (NAICS) code 331). Firms in this industry initiated 45 percent of all antidumping cases in the United States between 1979 and 2009, and the vast majority of these cases were from firms producing basic steel commodities: steel plate, pipe, and wire products. The asymmetry between the primary metals industry and other industries is so large that if we drop all NAICS 331 cases from the sample, as in Figure 2, the relationship between exchange rates and antidumping petitions decreases in magnitude and loses its statistical significance.

Figure 2. Exchange rates and antidumping investigations, dropping the primary metals manufacturing industry
Although a number of previous studies emphasize the prevalence of steel and metals manufacturing in antidumping investigations, few pay sufficient attention to understanding why this industry is different. Some scholars include a dummy variable to control for the fact that steel and steel-related cases are overrepresented in the data; others reestimate their models excluding the steel investigations.Footnote 13 But these empirical strategies say little about the factors that contribute to such industry-level differences.
Given that exchange rate fluctuations appear to significantly affect the demand for protection in some industries but not others, our goal is to identify structural variables that could potentially explain this asymmetry. For example, the primary metals industry might share certain characteristics with other industries, which would allow us to make generalized conclusions about industry behavior across the manufacturing sector. In other words, which industry-specific characteristics determine the protectionist response to currency appreciations?
The Industry-Specific Effects of Exchange Rates
The existing political economy literature has demonstrated that real exchange rate fluctuations have a substantial, but uneven, impact on the profitability and performance of industries.Footnote 14 Movements in the exchange rate may cause price changes that (1) reallocate resources between traded and nontraded goods industries; (2) alter the competitiveness of export industries and import-competing industries; (3) change the input costs of industries that use imported intermediate inputs; (4) alter the input prices of firms that import foreign goods for resale in the domestic market; and (5) change the value of assets denominated in foreign currencies. Because of this diverse set of influences, exchange-rate movements can be expected to have very different effects across industries.
At the broadest level, changes in the exchange rate affect nontraded goods industries differently than traded goods industries. Nontraded goods have transportation costs that are high enough to render international trade unprofitable. A real appreciation leads to a rise in the relative price of nontraded goods and thereby shifts resources from the tradables to the nontradables sector.Footnote 15 More specifically, a real appreciation increases the cost of producing tradable goods and decreases the costs of producing nontradable goods. As such, it causes the profit and market valuation of nontraded goods industries to rise relative to the profit and market value of traded goods industries.Footnote 16 This suggests an asymmetric relationship between real appreciations and industrial performance: appreciation helps nontraded goods producers and harms traded-goods producers.
Within the traded-goods sector, an industry's response to exchange-rate movements depends on its international position and market structure. An appreciation lowers the amount of home currency needed to purchase an equivalent unit of foreign currency, resulting in a lower home-currency price of foreign goods and a higher foreign-currency price of home goods. In general, this harms exporters and import-competing industries, because declining competitiveness at home and abroad reduces revenues, and helps importers (wholesalers and retailers) as input costs decline. But the overall sensitivity and position of export- and import-competing industries regarding currency appreciations are moderated by three factors: the degree to which changes in the exchange rate pass through to the price of traded goods, the amount of import penetration relative to domestic consumption, and the extent to which an industry depends on imported intermediate inputs.
First, we expect that greater pass-through in an industry will increase its sensitivity to exchange-rate fluctuations. Pass-through refers to the elasticity of import and export prices to changes in the real exchange rate. This is an important economic concept because changes in the exchange rate can affect international competitiveness only if they are “passed through” to the price of traded goods.Footnote 17 For the same reason, pass-through is politically important because firms are more likely to demand trade protection if their competitiveness is adversely affected by currency appreciations.
Complete pass-through means that market prices change one-for-one with the exchange rate: a 10 percent appreciation of the home currency leads to a 10 percent reduction in import prices and a 10 percent increase in export prices. Therefore, import-competing firms and exporters in high pass-through industries are very sensitive to the exchange rate because it directly affects their competitiveness. By contrast, zero pass-through means that prices remain unchanged in response to changes in exchange rates. Where pass-through is low, producers absorb most or all exchange rate fluctuations in their profit margins to avoid changing their prices. Low pass-through is also referred to as “pricing-to-market” because exporters adjust their markups to create price stability in the local currency of importers.Footnote 18
The level of exchange rate pass-through depends largely on the market structure and the degree of product differentiation in an industry.Footnote 19 Pass-through tends to be highest in competitive industries where firms produce homogenous goods and compete mainly on the basis of price (for example, basic metal products, minerals, textiles). Consumers are relatively price-sensitive, given the large number of available substitutes, and this high elasticity of demand forces producers to discipline their pricing behavior. By contrast, pass-through tends to be lowest in imperfectly competitive industries where producers compete on quality and reputation rather than simply on price. These market characteristics are typically found in industries that produce differentiated and specialized goods with few substitutes. Because demand is relatively inelastic, producers are able to keep prices stable in foreign markets even with exchange rate volatility (that is, pricing to market). Low pass-through industries are better insulated from the effects of exchange rate fluctuations since product differentiation prevents foreign goods from being close substitutes for domestic goods.Footnote 20
A simple example illustrates the impact of pass-through on an industry's sensitivity to exchange rate fluctuations. Consider trade between the United States and the Eurozone and assume that the dollar appreciates from $1.25 per euro to parity. Furthermore, assume that Eurozone producers charge a set price of €10 for each unit sold. In a situation of complete exchange rate pass-through, the import price for US consumers decreases from $12.50 to $10.00. If Eurozone goods are close substitutes for American goods, US consumers will adjust their consumption by consuming relatively more Eurozone goods. A similar mechanism is triggered in the Eurozone, where the price of the US good increases from €10 to €12.50. In this example of complete pass-through, dollar appreciation harms the competitiveness of US producers and thereby increases imports from the Eurozone and decreases US exports to Europe.
Now, consider the opposite extreme of zero pass-though. Under the full pricing-to-market assumption, appreciation of the dollar does not affect the quantity of goods shipped to the United States because European producers do not change their prices and US consumers do not shift their expenditures to European goods. Similarly, within the Eurozone, imports from the United States would be unchanged as European consumers would not substitute toward domestic goods. In other words, changes in consumption patterns are now absent because consumer prices in both markets are completely insulated from exchange-rate fluctuations. However, although quantities shipped across borders do not respond to exchange-rate changes, US exporters will still suffer a fall in revenues when the dollar appreciates. With prices set in dollars and no change in demand, the US exporter receives the same amount of euros as before the appreciation took place. This payment has less value in dollar terms, thereby decreasing the revenues of US exporters (revenues from domestic sales are unaffected).
To summarize, exchange-rate changes affect international competitiveness when pass-through is high. This implies that producers in high pass-through industries are sensitive to the exchange rate and hold clear preferences: appreciation harms their competitiveness and reduces profits, while depreciation improves their competitiveness and raises profits. By contrast, producers in low pass-through industries will be less concerned about changes in exchange rates because such changes do not induce proportional changes in prices, competitiveness, expenditure-switching, and quantities shipped across borders. The political economy implication is that high pass-through industries will be more likely to make political demands for protectionism during appreciations than industries with low pass-through.
Two additional industry characteristics shape the demand for trade protection during appreciations: the level of import penetration and the ratio of imported inputs to total inputs. We hypothesize that higher import penetration in a given industry will increase that industry's protectionist response to currency appreciations. Import penetration has long been associated with the demand for protection.Footnote 21 Furthermore, some studies have found that the amount of protection an industry receives is higher when an industry has high import penetration, or has experienced a recent increase in import penetration, or is in decline (declining industries tend to have higher import-penetration levels).Footnote 22 However, the existing evidence on the relationship between trade protection and import penetration is mixed.Footnote 23 We build on this literature by arguing that the responsiveness of industries to exchange rate appreciation is conditioned by the import penetration rate.
The import penetration rate is the percentage of domestic demand fulfilled by imports—an industry has greater import penetration when imports represent a larger share of domestic consumption. Industries with high import penetration rates face strong competition from foreign producers in the home market. Because of their exposure to import competition, their domestic revenues are particularly vulnerable to changes in competitiveness.Footnote 24 Therefore, we expect currency appreciations to generate more harm to import-competing domestic industries the higher the import penetration rate. A high degree of foreign penetration in domestic markets means that industry revenues are highly exposed to exchange-rate shocks. An industry with high import penetration (such as apparel and textiles, leather and leather products, industrial machinery and equipment, and electronic equipment) experiences greater pressure on its ability to compete in the domestic market when its competitiveness—and its revenues—fall sharply with currency appreciation. Thus, we expect that an appreciation of the real exchange rate will induce more protectionist pressure in industries with higher import penetration rates.
Not all manufacturing industries are harmed by currency appreciation, however. The most notable exception to the rule is an industry that imports a large proportion of its intermediate inputs from abroad. For such an industry, currency appreciation lowers input costs and may thereby offset the negative effect of appreciation on competitiveness and revenues. In fact, this benefit may outweigh the adverse revenue effects of a real appreciation in some traded goods industries.Footnote 25 Consider, for example, a furniture manufacturer in the United States that exports and imports a small amount of its finished product but relies heavily on imported foreign leather as an input for its production. An appreciation of the US dollar would lead to a drop in the price of the imported leather used by the manufacturer, and consequently an increase in profitability, but would have little negative impact on the manufacturer's overall competitiveness.
We thus expect greater dependence on imported inputs to decrease the demand for trade protection in response to exchange rate appreciation. Imported input dependence refers to the level of imported inputs relative to the total value of production. Since currency appreciation provides offsetting benefits to industries that depend heavily on imported inputs (by lowering input costs), we expect less protectionist pressure from such industries during real appreciations.
Our argument is salient because imported inputs have come to play an increasingly important role in the US economy. By 2006, imported intermediate inputs reached $1.2 trillion and accounted for more than half of all US imports—imports of parts and components now exceed imports of final goods. In manufacturing, the import share of intermediate inputs surpassed 20 percent on average, with some industries more reliant on imported inputs than others.Footnote 26 We take account of the growing use of imported intermediate inputs in production and leverage its across-industry variation to explore the impact of the real exchange rate on manufacturing industries’ demands for protection. In industries that buy more of their inputs from foreign producers, we expect less protectionist pressure in response to currency appreciations.
The argument that imported input dependence tempers industries’ demand for protection resonates with other work on the political economy of protectionism. Scholars have pointed to the rise of global production networks, vertical specialization, intrafirm trade, and the offshoring of services as factors that mitigate protectionism.Footnote 27 With vertical specialization and global sourcing, components and parts have to cross borders several times. For example, Japan exports raw steel to Mexico, where the steel is stamped and processed and then exported to the United States, where it is manufactured into farm equipment and then exported again.Footnote 28 The interconnectedness of production processes across several countries gives firms and industries that engage in it an interest in “resisting protectionism.”Footnote 29 Manufacturers relying on imported inputs may resist higher protectionism because it pushes up the prices of those inputs and thereby makes the domestic industry less competitive. In other words, vertical specialization provides a counterbalance to protectionism. We extend this reasoning to protectionist demands that are motivated by exchange rate appreciation. For industries that make use of vertical supply chains for imported inputs, we expect currency appreciation to evoke less protectionism.
Figure 3 summarizes the effects of exchange-rate changes on industries along the two dimensions we discussed: position and sensitivity. The first dimension—position—represents how an industry is affected by the level of the real exchange rate. Industries that benefit when the exchange rate is “high” (appreciated) are located in the east cells of the figure; industries that prefer a “low” (depreciated) exchange rate are positioned in the cells to the west. The second dimension—sensitivity—reflects the degree of pass-through in an industry. Industries that are more sensitive to movements in exchange rates are industries where pass-through is high: industries producing standardized goods sold in competitive markets on the basis of price. Industries that are less sensitive to exchange-rate movements are those where pass-through is low: industries that produce differentiated goods sold in less competitive markets where firms command some pricing power.

Figure 3. Industry positions and sensitivities to the real exchange rate
Industry-Specific Exchange Rates and Antidumping Investigations
We use the number of antidumping petition filings for a given industry to proxy for that industry's overall demand for protection. The advantage of using antidumping petition filings is that they are measured discretely over time and can be easily traced to specific industries. Therefore, our dependent variable AD it represents the number of antidumping petitions to the ITC filed by industry i in year t. These data were collected from the Global Antidumping Database (GAD) from 1978–2010.Footnote 30 Industries in the GAD are categorized by either Tariff Schedule of the United States (TSUSA) codes or Harmonized System (HS) codes, which are too disaggregate for the scope of our analysis. Therefore, we map the GAD data to modern three-digit NAICS codes using the following procedure.
First, we convert each of these respective codes to Standard Industrial Classification (SIC) codes using publicly available concordance files.Footnote 31 We replace missing SIC codes with those from the NBER Antidumping Database.Footnote 32 In addition, we reduce some HS codes to four significant figures to increase the number of SIC matches, since the former is far more disaggregated. Next, we convert these SIC classifications to NAICS codes.Footnote 33 Some of the concordances required manual overriding. For example, we mapped SIC 3312 to NAICS 331 based on bridge files from the US Census Bureau.Footnote 34 The GAD reports multiple entries for antidumping petitions associated with more than one product. We drop duplicate cases with the same case identification number and NAICS-6 code to avoid overcounting these “omni-petitions,” which were often filed in the primary metals manufacturing industry. Finally, we construct a panel of antidumping petitions per year by collapsing the dependent variable by NAICS-3 code.
The first modeling decision is to select a distribution for the dependent variable that reflects the nonnegative integer nature of antidumping petitions. The data reveal that the number of antidumping petitions across industries is highly skewed, which suggests evidence of overdispersion. Nearly 70 percent of our observations in the panel equal zero. Several goodness-of-fit tests indicate that the variance of our dependent variable far exceeds the mean, which violates the strict assumptions of the Poisson distribution. Therefore, we conclude that the negative binomial distribution is most appropriate for modeling antidumping petitions at the three-digit NAICS industry level.
Our primary explanatory variable is an industry-specific measure of the real effective exchange rate. Industry-specific exchange rates are crucial to our analysis since we are interested in changes in competitiveness and protectionist lobbying at the industry level. Although aggregate REER indexes use the weights of each partner country in the total international trade activity of the entire US economy, industry-specific exchange rates are constructed by weighting partner currencies by the shares of partners in US trade in a specific industry. The Federal Reserve Bank of New York provides industry-specific REER indexes for manufacturing industries by three-digit NAICS code from 1989–2010 on its public website.Footnote 35 These data are weighted by imports, exports, and overall trade, which is an ad hoc convention of averaging import and export weights.Footnote 36 We use the import-weighted exchange rate (mer) in our empirical analysis because antidumping measures are protectionist barriers on imports. This variable is constructed as follows:
 $$mer_t^i = \sum\limits_c^{} {w_t^{ic} \;\ast\; rer_t^c }\comma \; \quad {\rm where} \quad w_t^{ic} = \displaystyle{{M_t^{ic} } \over {\sum\limits_c^{} {M_t^{ic} } }}$$
where rer represents the bilateral exchange rate and M represents the value of imports for industry i from country c at time t.Footnote 37 We expect that industries will file more antidumping petitions when their import-weighted real exchange rate appreciates, which has the effect of reducing the competitiveness of domestic producers relative to foreign producers.
Table 1 presents the results of a preliminary effort to establish the parameters of the positive relationship between antidumping petition-filing behavior and the real exchange rate. Model 1 confirms the previous findings with industry and year-fixed effects. Models 2 to 4 show that firms in the primary metals sector are still more responsive to currency appreciations than other industries after switching to an industry-specific measure of the real exchange rate. Model 2 introduces a statistically significant control for the metals industry, which leaves our basic results unchanged, although we cannot include fixed effects to accommodate our time-invariant dummy variable. Models 3 and 4 retain fixed effects but trim our sample to include only metals and nonmetals industries, respectively. This introductory exercise confirms our graphical evidence that the positive relationship between antidumping petitions and currency appreciation appears to hold in the metals industry only.
Table 1. Antidumping petitions and exchange rates by industry

Notes: Standard errors are in parentheses. * p < .10; * p < .05; * p < .01.
To understand this asymmetry, we also collect data for our conditioning explanatory variables. We exploit the observation that pass-through tends to be high for standardized goods produced in competitive markets, and low for differentiated goods produced in imperfectly competitive markets. Rauch classifies products into three distinct categories: homogenous, reference priced, and differentiated products.Footnote 38 Homogeneous products are highly substitutable and producers compete mainly on price, which is set in organized exchanges. Reference-priced products have some unique attributes but remain essentially substitutable, and producers take their prices from industry guides and trade journals. Differentiated products vary across suppliers to meet specific consumer needs, and thus producers compete on quality and other attributes, rather than just on price. We collapse these product classifications into NAICS-3 industries and generate a dummy variable that equals 1 if pass-through is high and producers complete on price (homogenous and reference-priced goods) and 0 if pass-through is low and producers do not complete on price (differentiated goods).
More specifically, we collect Rauch's “conservative” product classifications from Haveman's public website.Footnote 39 We assign a pass-through value of 0 to differentiated products, 1 to reference-priced products, and 2 to homogeneous products traded on an organized exchange. This design ensures that larger magnitudes reflect a greater degree of exchange rate pass-through based on the theory we've presented. Because the raw data is organized by Standard International Trade Classification (SITC) industry codes, we use publicly available concordance files to categorize the data by 1999 NAICS codes.Footnote 40 Then, we convert these outdated NAICS codes to their 2002 equivalents to ensure consistency with our other explanatory variables.Footnote 41 We construct average pass-through values for each industry in our sample by collapsing the data by NAICS-3 code. Finally, we construct a dummy variable for high pass-through that equals 1 if the average is greater than or equal to 0.5, which reflects the fact that both reference-priced and homogenous goods are produced by industries that compete mainly on price.
Our method for constructing import penetration is relatively straightforward. We simply compute the ratio of imports to a proxy for domestic consumption devised by Campa and Goldberg as follows:
 $$MSHARE_{it} = 100\;\ast\; \left({\displaystyle{{M_{it} } \over {S_{it} - X_{it} + M_{it} }}} \right)$$
where M represents the value of imports, X represents the value of exports, and S represents total shipments for industry i in year t.Footnote 42 We collect both trade and shipments data by NAICS-3 industries from Schott, which are available on his website.Footnote 43
Unfortunately, we are unable to operationalize industry “dependence on imported inputs” and therefore we cannot test our third conditional hypothesis. We experimented with two measures of dependence in imported inputs, recognizing that each contained substantial measurement error. In the first approach, we measured imported input dependence by multiplying total industry spending on input p by the economy-wide import share for that input.Footnote 44 However, this approach relies on the assumption that the economy-wide import share for good p is equal to the import share for good p in a particular industry—a dubious assumption that was criticized by the National Research Council as a serious impediment to data collection and analysis.Footnote 45 It is worth noting that this variable and its interaction with the real exchange rate explain little to none of the variance in our data on antidumping petitions (results available on request).
We tried a second approach based on a dataset that identified foreign-made intermediate inputs via product descriptions in US import records.Footnote 46 If the description of the imported product contained variants of the word part, it was coded as an intermediate input; otherwise it was considered a final good. For our construction of “industry dependence on foreign-made inputs,” the numerator is the sum of all industry imports that contain the word part in the product description and the denominator is the sum of all industry inputs. However, we concluded that this approach is misleading because many imports (for example, leather hides) are not labeled as parts even though they are key inputs in certain industries (for example, furniture).Footnote 47 Furthermore, coverage in the parts data set is spotty and this reduced the number of observations in our data set by half. Since this variable explained virtually none of the variance in our data, and because we have reason to believe that it contains significant measurement error, we decided not to incorporate it into our empirical analysis. Our main results (available on request) hold with or without this variable but we prefer to wait for better data before drawing inferences about the relationship between imported inputs and the demand for trade protection during appreciations. In fact, recent measurement efforts by Feenstra and Jensen, in which both the numerator and denominator are derived from input-output tables, suggest that improved data on “materials offshoring” will be available soon.Footnote 48
We control for other factors that could affect the demand for antidumping relief. Intuition suggests that industries will incorporate information about the success of their previous petitions when comparing the costs and benefits of filing an additional petition at the margin.Footnote 49 Since industries choose whether or not to petition the ITC for protection, they may base that choice on their perceived likelihood of receiving an affirmative ruling from the bureaucracy. But, as Drope and Hansen demonstrate, the covariates of “success” are both endogenous to industries’ political efforts (for example, lobbying and campaign contributions), and exogenous to such efforts (for example, industries’ geographical location in the districts or states of powerful oversight committee members, the merits of the case, etc).Footnote 50 Rather than attempting to incorporate the multitude of political and economic factors that affect the likelihood of a positive policy decision from the ITC, we attempt to capture all such influences with a variable based on industries’ previous success in gaining positive rulings.Footnote 51 We can model this “success rate” because the GAD includes the final decision of each antidumping petition, which we use to construct a variable measuring the success rate for any given industry.
Decisions are not always reached in the same calendar year as the initial filing, so it is useful to think of this success rate as a cumulative ratio that gets updated with new information each year. Therefore, we can express the success rate for industry i at time t as follows:
 $$SR_{it} = \displaystyle{{100\;\ast\; \sum\limits_{\tau = 1978}^{t - 1} {\left({AD_{i\tau } \vert d} = {1} \right)} } \over {\sum\limits_{\tau = 1978}^{t - 1} {AD_{i\tau } } }}$$
where AD iτ represents the number of antidumping petitions filed by industry i in year τ and d represents the decision made by the ITC regarding any given petition. Our expectation is that an increase in the success rate of a given industry will increase the expected value of future investigations and thus induce the filing of more petitions in subsequent years. Similarly, a decrease in the success rate of a given industry should induce fewer petitions.Footnote 52
We incorporate the success rate and two of our conditional hypotheses about the effect of exchange rates on the industry-level demand for protection in the following interactive negative binomial model:
 $$\eqalign{ {Y_{it}} & = \exp \left({{\alpha _{it}} + \lambda S{R_{it}} + \beta {X_{it}} + \sum\limits_{\,j = 1}^2 {{\psi _j}{Z_{\,jit}} + \sum\limits_{k = 1}^2 {{\gamma _k}\left({{X_{it}} * {Z_{kit}}} \right)} } } \right. \cr & \quad \left. { + \rho {M_{it}} + \eta \Delta \ln \left({{C_{it}}} \right)+ \sum\limits_{n\, =\, 1}^2 {{\mu _n}{W_{nit}}} + {\varepsilon _{it}}} \right)}$$
where Y represents the number of antidumping petitions; SR represents the antidumping petition success rate, while the parameter λ represents the “learning rate” of a given industry; X represents the level of the industry-specific and import-weighted real exchange rate; Z represents the kth conditional variable, which equals either the pass-through rate or import share; M represents a dummy variable indicating whether a given industry belongs to the primary metals sector; C represents the log difference of manufacturing capacity utilization from the Federal Reserve Board; and W represents a vector of standard political economy covariates including capital-labor ratiosFootnote 53 and concentration ratios measured by the share of the value of total shipments accounted for by the four largest companies in industry i in year t.Footnote 54 The error term is assumed to be uncorrelated with our independent variables.
Table 2 evaluates our industry-specific arguments about the relationship between exchange rates and protectionism. We start by using a random effects model to allow us to interpret the coefficient on the component term for pass-through, which does not vary over time. Model 1 shows that the real exchange rate has an insignificant effect on the rate of antidumping petitions after controlling for industry-level success rate, pass-through, and import share. The coefficient on pass-through is significant and has the expected positive sign, whereas the coefficient on import share is unexpectedly negative and significant.
Table 2. Determinants of protectionist response to currency appreciation

Notes: Standard errors are in parentheses. * p < .10; * p < .05; * p < .01.
However, this model is incomplete because it assumes that each regressor has an unconditional effect on our dependent variable. To evaluate the conditional hypotheses we generated, Model 2 includes two interaction terms to go along with our component terms. We observe that our estimate of β is now slightly negative but still insignificant, which indicates the effect of X when our modifying variables are equal to 0. Next, we interpret the coefficients on Z j as the effect of our modifying variable j when X is equal to 0. The signs are each the opposite of what we expect, but this is not crucial to our analysis since a real exchange rate or import share equal to 0 is a highly improbable scenario.Footnote 55 Instead, we turn to the coefficients in vector γ, which incorporate our conditional hypotheses. We find that pass-through has a significant positive effect on the protectionist response by a given industry to an appreciation in the real exchange rate. Perhaps surprisingly, this variable provides most of the explanatory power in our model. The interaction between the exchange rate and import share is both substantively and statistically insignificant.
Next, we test the robustness of our results to a dummy variable that controls for the effect of unobserved characteristics associated with the primary metals industry. This technique should help us disentangle the independent effect of pass-through from other traits that might explain the overrepresentation of petitions filed by the primary metals industry in our sample.Footnote 56 We also include several control variables commonly found in the literature on the political economy of trade protection.Footnote 57 Empirical studies have repeatedly documented the countercyclical nature of trade protection: trade barriers tend to rise in recessions and fall in booms.Footnote 58 Since our analysis is conducted at the industry level of analysis, we use the change in natural logarithm of industry capacity utilization to measure such business cycle effects. Another empirical regularity is that advanced industrial countries tend to protect their low-skilled, labor-intensive sectors, a consequence of the fact these are their import-competing sectors.Footnote 59 We measure industry labor-intensity as being inversely related to the industry capital-labor ratio.Footnote 60 Finally, we control for industry concentration ratios on the grounds that several studies have found a positive relationship between producer concentration and trade protection.Footnote 61 Presumably, industry concentration reduces the free-rider problem and lowers the organizational costs of lobbying.
As Model 3 indicates, our core results are robust to these four control variables. The interaction between the real effective exchange rate and pass-through remains significant at the 5 percent level, and its magnitude even increases slightly. In fact, our pass-through classification appears to fit the data better than any of our other covariates.Footnote 62 The coefficient on our primary metals indicator variable is positive but notably insignificant. In addition, our three standard political economy control variables appear to have no significant effect on the rate of antidumping investigations initiated by manufacturing industries.
Note that we have not yet explicitly calculated the marginal effect of the import-weighted industry-specific real exchange rate on the number of antidumping petitions, which has thus far been documented in the literature at only the aggregate, economy-wide level. The marginal effect of our primary explanatory variable can be expressed as the following partial derivative:
 $$\displaystyle{{\partial Y} \over {\partial X}} = \beta + \sum\limits_{k = 1}^2 {\left({\gamma _k \ast Z_k } \right)}$$
We are especially interested in how this marginal effect varies across industries with low and high pass-through. Figure 4 plots these marginal effects separately using the coefficients estimated in Model 3.Footnote 63 The plot shows that the marginal effect of exchange rates on the industry demand for protection in industries with low pass-through is negative but statistically insignificant, since the 95 percent confidence interval crosses the 0 line. However, this marginal effect is both positive and statistically significant for industries with high pass-through, which is consistent with our theory and hypotheses.
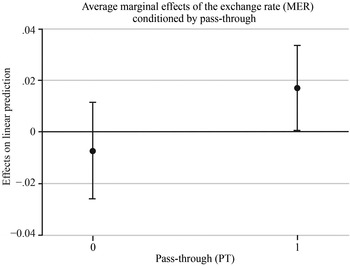
Figure 4. Marginal effects plot
Two important robustness checks test the sensitivity of our main results. First, we control for the possibility that our dependent variable is in part determined by unobserved trends in a particular year. Although the time-invariant nature of our pass-through component term makes it impossible to explicitly control for industry-fixed effects, this does not prohibit us from including year-fixed effects. Model 4 retains the specification from our complete negative binomial model and includes a series of dummy variables representing each year in our panel, whose coefficients are suppressed in the table to conserve space. This exercise yields functionally equivalent results. The interaction between the real exchange rate and pass-through remains positive and significant at the 5 percent level, suggesting that industries with high pass-through are more likely to file antidumping petitions during periods of currency appreciation. Capital-labor ratios appear to be positively and significantly correlated with the number of antidumping petitions, which is the opposite of our prediction. However, we are careful not to infer any causation from this relationship because capital-labor ratios tend to be strictly increasing over time in our sample. In other words, we cannot disentangle the independent effect of increasing capital-labor ratios from the effect of a simple linear time trend. We see no other reason ex ante for why an increase in the capital-labor ratio—and thus a decrease in labor intensity—would lead to an increase in the demand for protection at the industry level.
Second, we recognize that our models of count data can explain antidumping petitions per industry as a function of industry-level characteristics only, which ignores the possible effect of omitted variables that could influence the overall rate of petitioning activity. For example, it is possible that broad changes in antidumping regulations or the geopolitical landscape could increase the demand for protectionism across all industries in the same year. Because these regime changes are largely unobserved, it is nearly impossible to model them explicitly. Therefore, we construct an alternate dependent variable to measure the number of antidumping petitions per industry as a share of total antidumping petitions in a given year. The denominator inherently controls for all possible trends in protectionist activity, which allows us to isolate changes in the demand for protection at the NAICS-3 industry level more precisely.
Model 5 shows that our results are robust to these unobserved trends over time in a random effects linear model. We continue to observe a significant positive effect of pass-through on the protectionist response to exchange rate appreciations at the 5 percent level. In addition, the positive coefficient on our primary metals control is now substantively and statistically significant, which is consistent with our expectation and yet does not change our main results. We note that the conditioning effect of import share and our estimate of the “learning rate” parameter λ are each negligible and insignificant in this model and throughout our entire empirical analysis.
Conclusion
Empirical evidence suggests that some industries demand more trade protection than others. For example, the primary metals manufacturing industry accounts for nearly half of all antidumping petitions filed in the United States over the past thirty years. Furthermore, the elasticity of this demand to changes in the exchange rate varies widely across industries. We presented a framework for identifying the positions and sensitivities of industries to exchange-rate fluctuations and evaluated our conditional hypotheses using industry-specific measures of the demand for protection. We found that the marginal effect of currency appreciations on the number of antidumping petitions filed by manufacturing industries is positive for only industries with high exchange rate pass-through.
Our research moves scholarship on the relationship between exchange rates and trade protection in a new direction. Although previous studies have established a basic connection between currency appreciations and increases in overall protection, we disaggregate exchange rates and protectionist demands to the industry level in order to evaluate more precise conditional hypotheses. We also model variation in this elasticity of demand by exploiting certain industry-level characteristics such as exchange rate pass-through and import penetration.
Despite these innovations, there is significant room for improvement. Most importantly, we can improve the precision of our estimates with even more disaggregation of the data. We measure our variables of interest at the three-digit NAICS level, which classifies industries into just thirty-three broad categories such as “chemicals,” “wood products,” and “transportation equipment.” These categories group together an enormous diversity of industries, which introduces a great deal of measurement error in our data. Moving toward six-digit NAICS codes would allow us to expand our panel to 466 distinct industries. However, the Federal Reserve Bank of New York constructs industry-specific exchange rates for only NAICS-3 industries at this time. Current measures of imported input dependence are also still imprecise even after relaxing the import comparability assumption. Future research should take advantage of new estimates that incorporate data from input-output tables in both the numerator and denominator of this ratio.
Our arguments have implications for the analysis of “currency wars,” such as the ongoing conflict over China's policy of accumulating reserves to keep the Renminbi undervalued relative to its market value.Footnote 64 In the United States, this policy has provoked a protectionist backlash from certain industries and the US Congress is considering legislation to impose retaliatory trade barriers on China as punishment for its “mercantilist” currency policy.Footnote 65 Our arguments suggest that lobbying in support of such protectionist legislation should come mainly from high pass-through industries—those producing standardized goods that compete mainly on the basis of price. In industries where pass-through is high, China's undervaluation policy causes Chinese exports to the United States to become relatively inexpensive, which in turn diminishes US producers’ competitiveness.
Casual observation suggests that our arguments have external validity here. Just as with antidumping filings, the producers who support trade sanctions on China disproportionally represent the primary metals manufacturing industry. According to MapLight.org, a nonprofit research organization that collects data on the influence of money on politics, four of the six industry groups that explicitly voiced support for the Currency Reform for Fair Trade Act of 2010 (H.R. 2378) were in this sector.Footnote 66 They included the American Iron and Steel Institute (which represents US steel manufacturers), the United Steelworkers (representing labor in this industry), the Aluminum Extruders Council (the trade association of the aluminum processing industry) and the Alliance for American Manufacturing (a coalition of manufacturers in metals processing industries).Footnote 67 It is noteworthy that industries supporting the legislation belong to the same high pass-through industry that is so heavily overrepresented in antidumping petitions. More generally, exchange rates appear to provoke protectionist lobbying only where high pass-through implies a strong negative impact on industry competitiveness.
Supplementary material
Replication data are available at <http://hdl.handle.net/1902.1/19786>.


