


The use of health technology assessment (HTA) to direct the uptake of new technologies has become standard in many European countries (1). HTA must balance the interests of society and individual patients, ensuring that technologies with a tangible benefit to patients are recommended and that these technologies deliver effective care at a reasonable cost, while harmonizing decisions with additional societal preferences such as increased willingness to pay for orphan disease treatments or end-of-life care (Reference Drummond, Wilson and Kanavos2;3). The question of how “effectiveness” is defined and how patient experiences are included in this measure remains largely within the cost/QALY paradigm, often based on a generic tool for preference elicitation and index values derived from the general population (1;Reference Kind, Dolan, Gudex and Williams4).
Because patients are the end users of medical technologies, it is arguably important to take account of their views in HTA coverage decisions. This generally happens on two fronts: direct involvement in the HTA process including patient testimonies, and indirect provision of evidence through outcome data used in cost-effectiveness models.
On the first point, despite recent trends toward a more collaborative healthcare model with increased responsibility for and participation of the patient in his/her own care, the involvement of patients, patient organizations and carers in the process of HTA is still seen to be inadequate (5). Surveys published in 2005 and 2011 by the International Network of Agencies for Health Technology Assessment (INAHTA) revealed that in 2005, only 57 percent of responding HTA agencies involved patients in any aspect of their assessments (6). This proportion had not improved by 2011 (7). These observations were confirmed in a review of European HTA reports from 2000 to 2005, where only 38 percent included any organizational or patient-related assessment. Lack of a consistent analytical model or framework further meant the methodology varied widely and coverage was mostly superficial (Reference Lee and Sinding8). This is problematic because patients and carers arguably have a right to be involved in the appraisal of technologies that affect their lives, and there may be a societal imperative to improve legitimacy and transparency of the decision-making process (Reference Hailey9).
Regarding the latter point, quantitative patient evidence is routinely incorporated into the cost-effectiveness models required for the HTA process. In this case, evidence on the change in life expectancy following a treatment is combined with the quality of life before/after treatment to estimate the number of quality-adjusted life-years (QALYs) gained. Usually a generic questionnaire tool such as the EQ-5D or SF-36 is used to estimate quality of life (Reference Szende, Oppe and Devlin10;Reference Brazier, Usherwood, Harper and Thomas11), and consequently it is important for such tools to adequately capture as broad a picture of the patient's quality of life as possible. Failure to account for some aspects of the patient's improvement or deterioration would result in an inaccurate quantification of the quality of life gained through the intervention.
These modes of patient input are complementary. Patients and carers can contribute important and useful information on their experiences, values and expectations to the HTA process that can inform the expected effectiveness of the technology in a real world setting (Reference Facey, Boivin and Gracia5;Reference Hailey9) and provide input on considerations such as equity issues which are not covered by cost-effectiveness analysis. However currently one of the main decision criteria for reimbursement in some countries is the cost per QALY gained, and inaccurate estimates of the benefit of a treatment would make this calculation unreliable. It is, therefore, in the best interest of both patients and society as a whole to ensure QALYs reflect the actual patient experience, and that the QALY score changes adequately with changes in the patient's health status.
The present research question is to review evidence on the responsiveness of the EQ-5D 3-level index score to clinical change across a wide range of conditions. The analysis is focused on the three-level tool, because there is as yet little evidence on the performance of the five-level version. We focus on responsiveness, as one of the most important aspects of a patient-reported outcome tool is to reveal improvements or deteriorations in the quality of life of patients over time in response to treatment. The responsiveness data for the EQ-5D are compared with benchmarks normally considered to indicate good, moderate and poor responsiveness of a psychometric tool. Where the data are available, comparison with a Condition Specific Outcome Measure (CSOM) is made to further indicate whether important aspects of quality of life have been missed by the EQ-5D.
METHODS
Responsiveness of EQ-5D
A systematic review of peer-reviewed literature was performed. The inclusion criterion was studies evaluating the psychometric properties of EQ-5D, either exclusively or as part of a wider assessment. Studies published online before 1 January 2012 were included, there was no cutoff for studies published before a particular date. Exclusion criteria were evaluations of EQ-5D translations, studies with no clear definition of patient improvement/deterioration (anchors), studies that did not provide any statistics on EQ-5D responsiveness, and reviews. PubMed (http://www.ncbi.nlm.nih.gov/pubmed/) was searched using the keywords “EQ-5D responsiveness,” yielding 101 hits; 32 were excluded based on title/abstract, 29 were excluded according to the criteria above or lack of an associated full text. In total, forty studies were included in the final sample (Supplementary Table 1, which can be viewed online at http://dx.doi.org/10.1017/S0266462313000640).
Standardized Response Mean is defined as the mean change in index score from baseline to follow-up divided by the standard deviation of the change in scores [SRM = (M2 – M1) / SD(baseline1-followup1,. . .)]. Effect Size is defined as the mean change in index scores from baseline to follow-up divided by the standard deviation of the baseline scores [ES = (M2 – M1) / SD(baseline1, baseline2. . .)]. ES and/or SRM values were extracted when either or both of these were available. In studies where Modified SRM (Reference Deyo, Diehr and Patrick12) was reported (as SRM but using the SD of patients defined as stable in the denominator), this was included in the same result set as SRM.
Descriptive Properties of the EQ-5D System
The EQ-5D Index score is a number between 0 and 1 (with 1 being best health) representing the relative population preference for a particular health state. It is derived by asking the general population to imagine life in various health states determined by the EQ-5D questionnaire (Table 1), and “trading off” years in one state against years in another (Reference Dolan13). The Visual Analogue Scale (VAS) of the EQ-5D is a visual scale from 0 to 100, where respondents mark their subjective feeling of health (where 100 is best). The VAS was compared with the Index score within patient groups by calculating the VAS score as a percentage of the EQ-5D index score. For example, if the subjective VAS score was 80 and the Index score was 0.9 (normalized to 90), the percentage for comparison would be 80/90 = 89 percent. The agreement between VAS and EQ-5D Index was defined to be good if the VAS was within 5 percent of the Index (VAS/Index ratio 95–105 percent), moderate if within 10 percent (VAS/Index ratio 90–110 percent) and poor if differing by more than 10 percent. The overall correlation between VAS and Index scores was determined by Spearman's rho due to nonnormal distribution of both variables. Ceiling and floor effects were deemed to be acceptable below 15 percent (Reference McHorney and Tarlov14).
Table 1. Dimensions and Response Options for the EQ-5D Questionnaire (57)

Overall Assessment of Responsiveness
We assume that a QoL tool with good responsiveness should be able to distinguish between clinical improvements and deteriorations in patients and between patients who experience significant and less significant change. Because less significant changes are necessarily reflected in lower index score changes, we expect ES and/or SRM statistics in the “good” and “moderate” range for the patient groups with higher and lower clinical change, respectively. Assuming the study is adequately statistically powered, good responsiveness should additionally entail statistically significant differences in mean index score between each level, and additionally, should be equally responsive to improvements and deteriorations. Because not all studies addressed all elements (SRM, ES, improvements and deteriorations, statistically significant differences), we allowed studies to be judged on the evidence they did provide, although incomplete.
RESULTS
The search strategy resulted in the inclusion of forty studies (Supplementary Table 1) of which twenty-two reported statistics for both the EQ-5D and a condition specific outcome measure. The number of patients studied ranged from 31 to 1059, median 141 (Supplementary Table 2, which can be viewed online at http://dx.doi.org/10.1017/S0266462313000640).
Correlation between EQ-5D and Patients Self-rated Health
A valid QoL tool based on societal preferences for health states should to some extent reflect the subjective feeling of health experienced by patients in those states. In the present sample, twenty studies reported both mean EQ-5D index and VAS scores for one or more groups (twenty-three groups). The VAS score was within 10 percent of the EQ-5D index score in thirteen groups, and within 5 percent in only five groups. In the remaining ten groups, deviations of 54 percent to 197 percent were observed (see Figure 1). The overall correlation between Index- and VAS scores was reasonable and statistically significant with Spearman's rho = 0.81 (p < 0.0001).
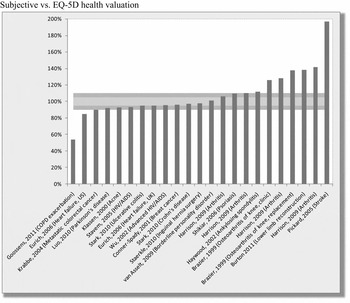
Figure 1. Comparison of VAS and EQ-5D index scores across twenty studies, some of which report scores for multiple cohorts/groups. VAS is shown as a percentage of EQ-5D index score. The outer (dark) and inner (light) horizontal bands represent ± 10 percent and ± 5 percent, respectively.
Floor and Ceiling Effects
The EQ-5D questionnaire consists of five questions (domains) with three possible answers (levels) each: no problems, some problems and severe problems. Situations where respondents answer either no problems (best health) or severe problems (worst health) in all domains are known as ceiling- and floor effects, respectively. The proportion of a study population responding with best or worst health at baseline can affect the ability of a QoL tool to respond to improvements or deteriorations. The ceiling and floor effects reported in twenty-two studies (twenty-eight groups) are shown in Figure 2. There were no significant floor effects, although twelve study groups (43 percent) exhibited ceiling effects over 15 percent, with as many as 48 percent of patients scoring perfect health states at baseline.
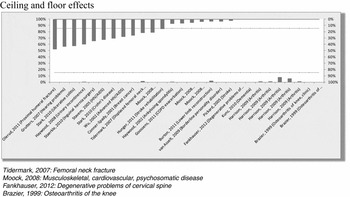
Figure 2. Floor (bottom, left axis) and ceiling (top, right axis) effects across twenty-two studies (28 groups), representing the proportion of patients in the worst and best reportable state of health, respectively. Dashed lines represent acceptability thresholds of 15 percent.
Responsiveness to Change
Perhaps the most important aspect of the EQ-5D in the context of economic evaluations is the responsiveness to clinical change. When patients improve or deteriorate as a response to treatment or as their disease progresses, this should be reflected in the EQ-5D score. The statistical methods used to gauge responsiveness typically include Standardized Response Mean (SRM) and Effect Size (ES), both of which are a measure of signal to noise, or the change in EQ-5D score relative to the variation among the sample. According to Cohen (Reference Cohen15), SRM and ES values of 0.2, 0.5, and 0.8 are normally regarded as low, moderate, and high, respectively. In the studies reviewed here, all interventions were considered effective in the sense that patients could be classified as improved or deteriorated according to external anchor criteria. Consequently poor response statistics should not be interpreted as lack of clinical change.
Figure 3 shows the range of SRM values across twenty-nine studies, representing the SRM of the group with the lowest responsiveness (generally the group with the smallest clinical change) up to the SRM of the group with the best responsiveness (the group with the greatest clinical change).

Figure 3. The range of standardized response mean (SRM) values across twenty-nine studies. The SRM range per study, represented by vertical bars, includes SRM for the lowest category of patient's clinical change to the highest category of change. Horizontal lines represent studies reporting a single SRM value (one patient group). Dark (lower), medium (middle) and light (top) fields indicate poor (<0.5), moderate (0.5–0.8) and good (>0.8) values. Asterisk (*) indicates modified SRM (MSRM) was reported. SRM values shown for EQ-5D (gray) and relevant CSOM (black, name given in horizontal axis) when present.
According to Cohen's criteria (Reference Cohen15), the majority of EQ-5D SRM values (twenty-one of twenty-nine studies, 72 percent) span the low to moderate range, with eight of twenty-nine studies demonstrating SRM values classified as good in their best performing groups (Figure 3). Excluding those who only reported a single value, only two studies demonstrated SRM values exclusively within the moderate–good range (Reference Günther, Roick, Angermeyer and König16;Reference Pickard, Johnson and Feeny17).
For comparison, sixteen studies reported SRM statistics for a comparable Condition Specific Outcome Measure (CSOM). In twelve cases (75 percent), the lower and upper limits of the CSOM SRM statistics were better than the EQ-5D limits. In three cases (19 percent), only the upper limit of the CSOM was better than the upper limit of the EQ-5D, but only in one case (6 percent) were the SRM statistics of the EQ-5D better than those of the CSOM (Reference Burton, Walters, Saleh and Brazer18).
Similarly for ES (Supplementary Figure 1, which can be viewed online at http://dx.doi.org/10.1017/S0266462313000640, the majority of studies (fifteen of twenty-four, 63 percent) reported EQ-5D values in the low to moderate range. Nine studies (38 percent) reported ES values above 0.8, while six (25 percent) reported ES values exclusively within the moderate–good range (Reference Günther, Roick, Angermeyer and König16;Reference Pickard, Johnson and Feeny17;Reference Solberg, Olsen and Ingebrigtsen19–Reference Conner-Spady, Cumming and Nabholtz21), excluding those reporting only one value.
Fourteen studies reported ES for both the EQ-5D and a Condition Specific Outcome Measure (CSOM). In nine of these (64 percent), both the lower and upper ES limits of the CSOM were better than for the EQ-5D, and in three cases (21 percent), the upper ES limits of the CSOM were better than for the EQ-5D while the lower limits were worse. In only two cases (14 percent) were the upper ES limits of the CSOM worse than for the EQ-5D (Reference Krabbe, Peerenboom, Langenhoff and Ruers20;Reference Conner-Spady, Cumming and Nabholtz21)
Responsiveness by Individual Study
The responsiveness of the EQ-5D can be characterized as good in five studies (13 percent), moderate–good in four (10 percent), and moderate in eleven studies (27 percent). Responsiveness was moderate–poor in eleven studies (27 percent) and poor in nine studies (23 percent). Of the five studies, we assess the EQ-5D to demonstrate good responsiveness for, none of these provided all the evidence sought but reported only a single level of improvement or deterioration. Additionally, one reported ES/SRM values of approximately 0.5 for the groups defined as stable (Reference Pickard, Johnson and Feeny17) and one evaluated treatment outcome over time rather than between groups of patients (Reference Krabbe, Peerenboom, Langenhoff and Ruers20). Without exception, the studies reporting good responsiveness described conditions with large expected changes in health status: femoral and displaced femoral neck fracture (Reference Tidermark, Bergström and Svensson22;Reference Tidermark and Bergström23), low back surgery (Reference Solberg, Olsen and Ingebrigtsen19), stroke (Reference Pickard, Johnson and Feeny17), and colorectal cancer with liver metastases (Reference Krabbe, Peerenboom, Langenhoff and Ruers20). The majority of studies (77 percent) clustered in the Poor to Moderate categories.
DISCUSSION
In the case of the United Kingdom, NICE recommends the use of EQ-5D to quantify health state outcomes as QALYs. This suggests the EQ-5D and its population derived index values should be sensitive enough to capture clinically relevant changes over the course of treatment. If this is not the case, economic evaluations and consequently allocative decisions may not reflect the true value of the treatment. The studies reviewed here, covering a wide range of conditions and geographical settings, show limited responsiveness of EQ-5D to clinical improvements or deteriorations. Only a handful of studies demonstrate acceptable ES and SRM statistics, and even fewer report in addition statistically significant mean changes between outcome groups (not shown), and are able to distinguish between improvements and deteriorations equally well. A significant proportion of studies reported more than the generally accepted limit of 15 percent (Reference McHorney and Tarlov14) of patients scoring perfect health in the EQ-5D at baseline, which would preclude any additional benefits from treatment from being registered.
The ES and SRM are descriptive statistics indicating the “signal to noise” ratio in a sample, or the average change in scores normalized by a measure of deviation. The intention here is to approximate to what extent the EQ-5D captures all changes relevant to the patient, and comparison of the EQ-5D to CSOM statistics suggests there are indeed aspects of quality of life which are not sufficiently captured by the EQ-5D. It may be argued that Clinically Important Difference (CID) is also a relevant measure to consider in this context, estimated for example at 0.03 by Feeny et al. (Reference Feeny, Spritzer and Hays24). While comparison of an index score change with a CID can reveal whether some clinically important change has been captured by the EQ-5D, it does not indicate whether all or most of the change in quality of life has been registered. Indeed, in one study with AIDS patients the mean EQ-5D index score change was 0.08, while the SRM value was only 0.3, compared with 0.5 for the CSOM (Reference Wu, Jacobson and Frick25). Similarly in borderline personality disorder, an EQ-5D index change of 0.12 corresponded to an SRM of 0.3, compared with 1.1 for the CSOM (Reference van Asselt, Dirksen and Arntz26).
The majority of studies included were of European origin (76 percent) with the remaining studies representing the USA and Canada (17 percent), Asia (2 percent), and a mixture of these (5 percent). The data did not suggest any significant variation by country or region (not shown), although it is interesting to note that different valuation sets are used for the EQ-5D index score in different countries (Reference Szende, Oppe and Devlin10), and thus country variation within the same disease group could occur.
Correlation between Patient and Societal Values
In most studies reviewed here, the validity of EQ-5D as a measure to reflect clinical state is good, meaning that deteriorations are generally associated with lower scores and vice versa (not shown). Although validity cannot be proven conclusively, testing the direction of change in the EQ-5D index score and the comparator QoL score over several hypothetical scenarios (e.g., patients experiencing increasing pain and decreasing mobility) gives an indication of whether EQ-5D scores reflect the intended health states. In contrast, based on a comparison between patient reported VAS scores and EQ-5D indices, we find that only a small proportion of EQ-5D index scores are approximately equal to the patient's own perception of health, although the overall correlation between VAS and Index score was reasonable at Spearmans rho = 0.81. The correlation was particularly poor in patients with Chronic Obstructive Pulmonary Disorder (COPD) exacerbations (VAS 54 percent of index) (Reference Goossens, Nivens and Sachs27) and in stroke patients undergoing rehabilitation (VAS 197 percent of index) (Reference Pickard, Johnson and Feeny17). These are examples of opposite situations, where the patient feels significantly worse or significantly better than the population-derived tariff would predict, respectively, demonstrating both that there are significant areas of morbidity not captured by the EQ-5D, and that the patient's subjective perception of health can be better than would be expected.
Previous analyses have found different emphasis placed by patients and the public on different dimensions of health. Anxiety/depression appears to be more important to patients than pain/discomfort and mobility, while pain/discomfort followed by mobility has the highest impact on the public (hypothetical) evaluation of health (Reference Mann, Brazier and Tsuchiya28). Patients may to a greater extent be able to adapt to problems in pain/discomfort and mobility, but less so to mental health issues (Reference Mann, Brazier and Tsuchiya28). More importantly, it was suggested that the EQ-5D descriptive system might be unable to relay a true image of the described health state to the general public, in particular when mental health or pain/discomfort was addressed, both of which can be highly subjective in nature and difficult to imagine.
Psychometric Properties of the EQ-5D
Significant ceiling effects were noted in several studies. As would be expected, in at least one case where the ceiling effect was particularly pronounced, EQ-5D was less able to respond to clinical improvements than deteriorations: ES values in clinically improved HIV/AIDS patients were 0.32 compared with 1.61 for deteriorated patients in a cohort with 33 percent ceiling effect (Reference Stavem, Frøland and Hellum29). Other studies did not report performance on deteriorations, but only low responsiveness in improvements: Tinnitus patients with 25 percent ceiling effect at baseline and ES/SRM of 0.19/0.22 (Reference Maes, Joore and Cima30); females with urinary incontinence, 40 percent ceiling effect and SRM of 0.07–0.26 (Reference Haywood, Garratt and Lall31); patients with hearing problems, 44 percent ceiling effect and ES/SRM values of 0.02–0.05 (Reference Grutters, Joore and van der Horst32). This is particularly problematic for the assessment of treatments, which may show up as less effective.
The observed ceiling effect only gives a limited impression of the potential responsiveness. Patients who are not in perfect health at baseline but have high index scores nonetheless may also improve only slightly over time, as observed in a study of breast cancer patients surveyed after their final treatment and one year later. Those who remained stable or improved slightly over the study had higher baseline scores (0.78 to 0.82) than those who improved a lot (0.71)—in all three categories, the final index scores at follow-up were 0.80–0.83 (Reference Kimman, Dirksen, Lambin and Boersma33).
However, populations with significant ceiling populations in some instances displayed reasonable responsiveness to improvements, although these were mostly conditions where major improvements could be expected: proximal humeral fractures (Reference Olerud, Tidermark and Ponzer34) and inguinal hernia surgery (Reference Staerkle and Villiger35). For inflammatory bowel disease, a ceiling effect of 31 percent did not seem to impact responsiveness to improvement (Reference Stark, Reitmeir, Leidl and Konig36), while in breast cancer patients undergoing high dose chemotherapy, initial deterioration of the cohort after treatment could negate the effect of a 26 percent ceiling effect (Reference Conner-Spady, Cumming and Nabholtz21).
Dimensions not Captured by EQ-5D
It has been argued that questionnaires with only three levels of response (e.g., no problems, some problems, severe problems) such as the EQ-5D may fail to capture more subtle changes in health status (Reference Streiner37). This is supported by our findings where EQ-5D was more responsive in situations where larger changes in health status could be expected, including lower back surgery (Reference Solberg, Olsen and Ingebrigtsen19), stroke rehabilitation (Reference Pickard, Johnson and Feeny17), colorectal cancer with liver metastases (Reference Pickard, Johnson and Feeny17), and breast cancer patients undergoing high dose chemotherapy (Reference Conner-Spady, Cumming and Nabholtz21). One study looking at the same condition (osteoarthritis of the knee) in different treatment settings also demonstrated lower responsiveness in a regular clinic setting than in patients undergoing more dramatic total knee replacement surgery (Reference Brazier, Harper and Munro38). Responsiveness across several levels of outcome may be complicated by the fact that large changes may only be seen in a few patients with the majority making small or moderate improvements or deteriorations (e.g., Reference Eurich, Johnson, Reid and Spertus39). But even when the clinical change is great enough to cause reasonable responsiveness of the EQ-5D, the authors of some studies note it is not known whether the more subtle effects on QoL of cancer survivors such as fatigue, sexual dysfunction, depression, and body image are captured by EQ-5D (Reference Conner-Spady, Cumming and Nabholtz21). Anecdotal evidence from patients suggests that such aspects are indeed not captured.
Compared with the cancer specific EORTC QLQ-C30 tool, the EQ-5D was certainly not able to adequately reflect health changes that materialized over the course of treatment of newly diagnosed prostate cancer patients. In the initial stages of prostate cancer, the domains of greatest importance are sexual function, urinary function, and bowel function, neither of which are reflected in the EQ-5D, but to some extent are included in disease specific tools. Although the initial physical effects of treatment are negative, they are important because they persist for a long time. While the EORTC QLQ-C30 responded across all dimensions as patients were treated (causing some deterioration) and subsequently recovered, the EQ-5D remained virtually unchanged (Reference Krahn, Bremner and Tomlinson40). This is particularly important because curative therapy in some cases may improve life expectancy but not quality adjusted life expectancy (Reference Alibhai, Naglie and Nam41), making the choice to accept treatment or not partly a question of preference (Reference Fleming, Wasson and Albertsen42). In cases where patient preferences are a major determinant of the decision outcome, some authors argue a measure of societal preference for health states is inadequate (Reference Krahn, Bremner and Tomlinson40).
Responsiveness in conditions with slow progression is particularly problematic. In Friedreich's Ataxia, a neurodegenerative disease which progresses slowly over many years, one study with follow-up after 1 year found the scores were virtually identical to the baseline (no external criteria for determining improvement or deterioration were applied, although deterioration was implicitly expected in all patients) (Reference Riazi, Cano and Cooper43). Although it is possible these patients were still experiencing the same health state as the previous year, this result highlights the difficulty in gauging minimal clinical response over long timeframes and the subsequent impracticability of producing accurate and timely data for an HTA.
Comparison across Therapeutic Areas
As in some countries (including the UK) the EQ-5D to a large extent forms the basis for resource allocation in health care, it is also pertinent to note some potential inconsistencies. The same EQ-5D score may reflect very different conditions and severities, depending for instance on the patient population. In a sample of young men and women (mean age, 22.1 years) with acne, 52.8 percent reported moderate or severe anxiety or depression (4 percent severe) (Reference Klassen, Newton and Mallon44), while the figures were 67.5 percent (5 percent severe) in metastatic breast cancer patients scheduled for high dose chemotherapy (Reference Conner-Spady, Cumming and Nabholtz21). Similarly, 42.1 percent of acne patients reported moderate pain-discomfort (none severe), for cancer patients this was 40 percent (none severe). The obvious question at this point is whether the level of anxiety and pain are the same in both of these cases. The example becomes further complicated with the author's valid points that EQ-5D does not cover aspects of quality of life important to acne patients, including general embarrassment and the impairment of sporting activities and sexual relations (Reference Klassen, Newton and Mallon44).
The departure of subjective health state from EQ-5D index rating was particularly evident in severe rheumatoid arthritis patients, many of whom rated their subjective health somewhat better than the index score. In this patient group, the EQ-5D VAS score did not deteriorate significantly between the two highest levels of severity, suggesting self-rated health in these individuals was considerably more optimistic than that attributed by society (Reference Hurst, Kind and Ruta45). In other patient groups, the change in subjective health versus EQ-5D index was simply inconsistent, with those rating their own health as the same scoring higher index values, while those who believed they deteriorated had hardly any change in score (Reference Burton, Walters, Saleh and Brazer18).
CONCLUSIONS AND WAYS FORWARD
As judged by standard criteria for the responsiveness of QoL tools, we conclude that the EQ-5D mainly exhibits poor to moderate responsiveness to clinical change and does not adequately reflect the experiences of patients. This has implications for the economic evaluations of novel therapies, which rely on cost per QALY to assess cost-effectiveness and subsequently decide reimbursement status. Insofar as the full benefit to patients is not captured by the QALY measure, the cost per QALY could be over- (or under-) estimated.
It has been suggested the VAS might be an appropriate tool to gauge patient utility (Reference Wu, Jacobson and Frick25;Reference Torrance46). In this review, we find mixed support for this idea, with the VAS in some cases showing greater responsiveness than the EQ-5D index (Reference Kimman, Dirksen, Lambin and Boersma33;Reference Hunger, Sabariego and Stollenwerk47–Reference Nosyk, Sun and Bansback49) but in other cases performing worse (Reference Staerkle and Villiger35;Reference Luo, Ng and Lau50) (data not shown). In any case, the VAS is purely subjective and does not incorporate any form of societal preference into the score. In addition, the VAS asks “how good or bad your own health is today.” While this is clearly a reflection of subjective health state, it does not prompt the respondent to consider other important dimensions of quality of life, such as the mobility, social interaction dimensions, etc. included in the EQ-5D index score, or the quality of life implications of receiving medications by infusion in a hospital setting rather than as a pill at home. There are also conceptual limitations associated with the use of the VAS for QALY weighting, because it is not clear whether an improvement of 10 units at the top of the scale is equivalent to the same improvement at the bottom of the scale (interval property) (Reference Luo, Ng and Lau37), indeed some evidence suggests this is not the case (Reference Nord51). Under these conditions, the measurement of benefit would be skewed toward one end of the scale.
The limited scope for small/moderate clinical changes in a three-level questionnaire such as the EQ-5D has prompted the argument that a five-level version would be more responsive. Such a tool is currently being developed (Reference Herdman, Gudex and Lloyd52) and has had value sets derived for Spain, the Netherlands and China as of January 2013 (53). Although a five-level response scale is arguably necessary for improved responsiveness, it is by no means sufficient, which is demonstrated for example by a comparison of the 15D generic tool (fifteen dimensions, five levels) and EQ-5D showing that 15D was in fact less responsive than the EQ-5D in HIV/AIDS patients (Reference Stavem, Frøland and Hellum29). In addition, if the existing five dimensions of the EQ-5D do not adequately describe the patient health state, additional levels of response will not change this.
Because condition specific outcome measures (CSOMs) are built to capture all aspects relevant to patients, they are generally more responsive, but lack the ability to integrate public preferences and perform comparison across diseases. This has been addressed by scoring CSOMs based on public preferences using time-tradeoff experiments for the example of erectile dysfunction, in which both males and females participated in group sessions (Reference Stolk and Busschbach54). While there may be some merit to this approach, scoring all relevant CSOMs would be a significant undertaking—a review from 1990 identified more than 300 CSOMS (Reference Spilker, Molinek and Johnston55). In addition, for CSOMs to be acceptable denominators in a cost-utility analysis, they must possess interval measurement and ordinal scale properties (Reference Streiner37).
Based on the present analysis, it seems that in attempting both to quantify health outcomes and integrate a measure of public preference for resource allocation, the EQ-5D faces shortcomings on both accounts. It appears that EQ-5D scores do not react adequately to clinically important changes and that dimensions of quality of life that are important to patients are not captured.
The patient perspective is an essential input to HTA—without a measure of subjective treatment outcome, no conclusion on cost-utility can be drawn. An important question, then, is whether QALYs as computed on the basis of the EQ-5D are a reliable measure of the health states they represent. This work suggests there is considerable variation in how well the EQ-5D reflects patient experiences, and consequently that resource allocations based on this tool may be inefficient. There are situations in which some generic tools perform better than others, for example HUI-II and -III may be more responsive to hearing disorders (Reference Grutters, Joore and van der Horst32) because they include explicit dimensions on sensation and hearing, respectively. It is of course prudent to consider the existing evidence to select the most appropriate outcome tool; however, it is still far from clear whether sufficient aspects of Quality of Life are captured in situations where one generic tool is better than another. Therefore, it seems not only reasonable but necessary that additional patient evidence is included in HTA processes alongside the standard cost-utility evaluation. The challenges associated both with patient evidence and direct participation in the HTA process are numerous (Reference Facey, Boivin and Gracia5), and to date, no clear consensus has emerged on how to include patient perspectives and values in a way that is not considered anecdotal but on par with other evidence. It may be that the EQ-5D 5-level questionnaire will improve psychometric properties in some disease areas (Reference Pickard, De Leon and Kohlmann56), but the conceptual limitations remain.
SUPPLEMENTARY MATERIAL
Supplementary Tables 1 and 2, and Supplementary Figure 1 can be found at: http://dx.doi.org/10.1017/S0266462313000640
CONTACT INFORMATION
David Tordrup, MSc (dtordrup@gmail.com), London School of Economics, London, UK
Jean Mossman, BSc, European Brain Council, Brussels, Belgium
Panos Kanavos, PhD, Associate Professor in International Health Policy, London School of Economics, London, UK
CONFLICTS OF INTEREST
The authors have received an unrestricted grant from Bayer to develop training materials and survey the literature, and this paper has arisen as part of this process, and grants from Bayer, during the conduct of the study. Jean Mossman has received fees from Bayer and other medical companies for organizing meetings for patient groups.


