


Heart failure (HF) is a major health problem. It was estimated to affect 26 million people worldwide in 2014 (Reference Ambrosy, Fonarow, Butler, Chioncel, Greene and Vaduganathan1), and leads to over 10 million hospitalizations annually in the USA and Europe. The prognosis for chronic HF remains poor, with 1-year and 5-year survival rates, respectively, 86.5 and 56.7 percent (Reference Jones, Roalfe, Adoki, Hobbs and Taylor2) and a 1-year event-free survival rate of 49.1 percent for patients with a HF duration of >18 months (Reference Sugiura, Kitahara, Iwahana, Suzuki, Okada and Miyauchi3). Advances in medical therapy have improved the quality of life and survival of patients with end-stage HF. Heart transplantation (HTx) remains the best available treatment of end-stage HF in terms of mortality and quality of life. However, the lack of suitable heart donors means that patients often wait a long time for a heart transplant. To address this shortage, left ventricular assist devices (LVADs) have become an alternative for advanced HF. In 1966, DeBakey implanted the first pneumatically driven LVAD (Reference DeBakey4). VADs are increasingly being used as a bridge to the transplantation option (known as bridge-to-transplantation), providing circulatory support whereas patients await HTx, and more recently VADs are being used as a destination therapy, as a permanent alternative to HTx. However, these devices have a very high unit cost and are not free of risks; adverse effects such as bleeding, infection, device malfunction, stroke, and death are reported in the literature (Reference Kirklin, Pagani, Kormos, Stevenson, Blume and Myers5). With the increasing use of this medical device (Reference Kirklin, Pagani, Kormos, Stevenson, Blume and Myers5), questions remain about its cost-effectiveness. Although some authors have investigated this (Reference Nunes, MacArthur, Kim, Singh, Buchholz and Chatterley6;Reference Schmier, Patel, Leonhard and Midha7), the question of the quality of economic studies of VADs remains, and particularly their level of evidence. This information is valuable in health technology assessments (HTAs), which in turn support decision makers. Knowledge of the quality of available economic studies is essential to make an informed and fair decision, especially with these very high cost devices.
The purpose of this study was to perform a systematic review of the literature on economic evaluations of VADs to assess the methodological and reporting quality of the currently available publications on this topic. By highlighting this question of quality in published papers, we aim to provide valuable information to HTA analysts and policy makers dealing with VADs.
Materials and Methods
A systematic review of the literature was performed in 4 June 2019 to identify health economic evaluation studies relating to VADs. We followed accepted guidelines for conducting systematic reviews; the Preferred Reporting Items for Systematic Reviews and Meta-Analyses (PRISMA) guidelines (see Supplementary file 1, PRISMA Checklist). This review has not been registered.
Search Strategy
We selected articles from four electronic databases: PubMed, Embase, the National Health Service Economic Evaluation Database (NHS EED), and the Cost-Effectiveness Analysis Registry. A search strategy was developed using the PubMed database to identify all relevant studies published in the last 10 years (from 1 June 2009 to 1 June 2019) and was then applied to the other databases. The full strategy is available in Supplementary file 2 (Study protocol). The search terms combined a descriptor of the device (MeSH or not) and a term related to economics (MeSH or not).
Study Selection
First, duplicate articles were automatically removed. Then, titles and abstracts were screened independently by two reviewers (SF and LC) to select relevant articles regarding inclusion and exclusion criteria according to the PICOS format (population, intervention, comparators, outcomes, and study design) (Table 1) (Reference Schardt, Adams, Owens, Keitz and Fontelo8). Exclusion criteria were as follows: articles written in languages other than English or French, studies where VADs were not the sole topic, studies such as reviews, editorials, congress communications, letters, and non-economic studies. Disagreements were resolved by a third reviewer (NM).
Table 1. Study eligibility criteria in a PICOS format

PICOS, population, intervention, comparators, outcomes, and study design.
Quality Assessment
To assess the quality of articles screened, two reviewers (SF and NM) used three established checklists for appraising reporting and methodological quality of economic evaluations. These three tools are all qualitative instruments. In cases of discordant classifications, the two researchers discussed discrepancies until a consensus was reached.
First, general characteristics were extracted using international guidelines published by Drummond et al. (Reference Drummond, Sculpher, Claxton, Stoddart and Torrance9). These recommendations provide a general guidance about the way in which the results of economic evaluations should be reported. The authors must give information about the type of evaluation conducted, perspective chosen, and costs considered (direct, indirect, and both). They need to describe the comparators chosen, time horizon, incremental cost-effectiveness ratio (ICER), and source of funding.
Next, we used a second tool developed by Cooper et al. to evaluate the quality of the sources of evidence used in the studies (Reference Cooper, Coyle, Abrams, Mugford and Sutton10). This tool, which ranks the evidence used in studies on a scale of 1–6, assessed the quality of sources for the main clinical effect, baseline clinical data, cost data, and utility data. When the information was not clearly stated, the scale awarded a rank of 9. We then grouped the rankings into three quality categories defined by Cooper et al. (Reference Cooper, Coyle, Abrams, Mugford and Sutton10). Level A corresponded to the highest level of evidence quality, covering ranks 1 and 2. Level B corresponded to an intermediate level of evidence quality, covering a ranking of 3. Ranks 4, 5, 6, and 9 were grouped together into level C, corresponding to the lowest level of evidence quality.
Finally, we used the CHEERS (Consolidated Health Economic Evaluation Reporting Standards) checklist, which was published in 2013 (Reference Husereau, Drummond, Petrou, Carswell, Moher and Greenberg11). This is a practical tool used to assess reporting quality of health economics studies. This instrument includes twenty-four items in six categories (title and abstract, introduction, methods, results, discussion, and other). Three reviewers (SF, SS, and NM) assigned 1 point if the item was complete, a half point for a partial answer, and 0 points if the information was lacking. We used here a score that implicitly gives equal weight to each of the items in the checklist. This is a potential limitation of this approach, as some items may be considered more relevant or more important than others. The maximum score reachable with this tool is normally 24. Nevertheless, some items were not applicable; consequently, the maximum possible score was calculated for each article.
This methodology of combining several checklists was inspired by previous work on the quality of economic evaluations (Reference Nédellec, Pineau, Prognon and Martelli12–Reference Martelli, Devaux, van den Brink, Pineau, Prognon and Borget14). To our knowledge, there is no single checklist available that is able to appraise both reporting and methodological quality of economic evaluations. For this reason, we chose to merge these three qualitative instruments which explore different aspects of an economic evaluation: the global methodology assessed by the Drummond guidelines, the quality of the sources of evidence by the Cooper checklist, and the reporting quality by the CHEERS checklist. This strategy allows us to be more exhaustive in the appraisal of the articles screened and to offset the inherent weaknesses of a single tool.
Results
Selected Studies
Figure 1 summarizes the details of study identification and reasons for inclusion/exclusion. In the initial electronic literature search, 1,258 studies were identified. A total of 854 articles were obtained after removal of duplicates. After screening titles and abstracts, we excluded 786 articles as they did not meet the selection criteria: 462 studies did not solely discuss VADs, 229 did not have accepted designs, 80 did not deal with economics, and 15 were not available in English or French. Next, we read the full text of the remaining sixty-eight articles and excluded fifty-five articles because of their design (n = 2) or because they were not economic studies (n = 53). Our literature search identified thirteen studies that fulfilled the inclusion criteria. The selected articles were published between 2012 and 2018.
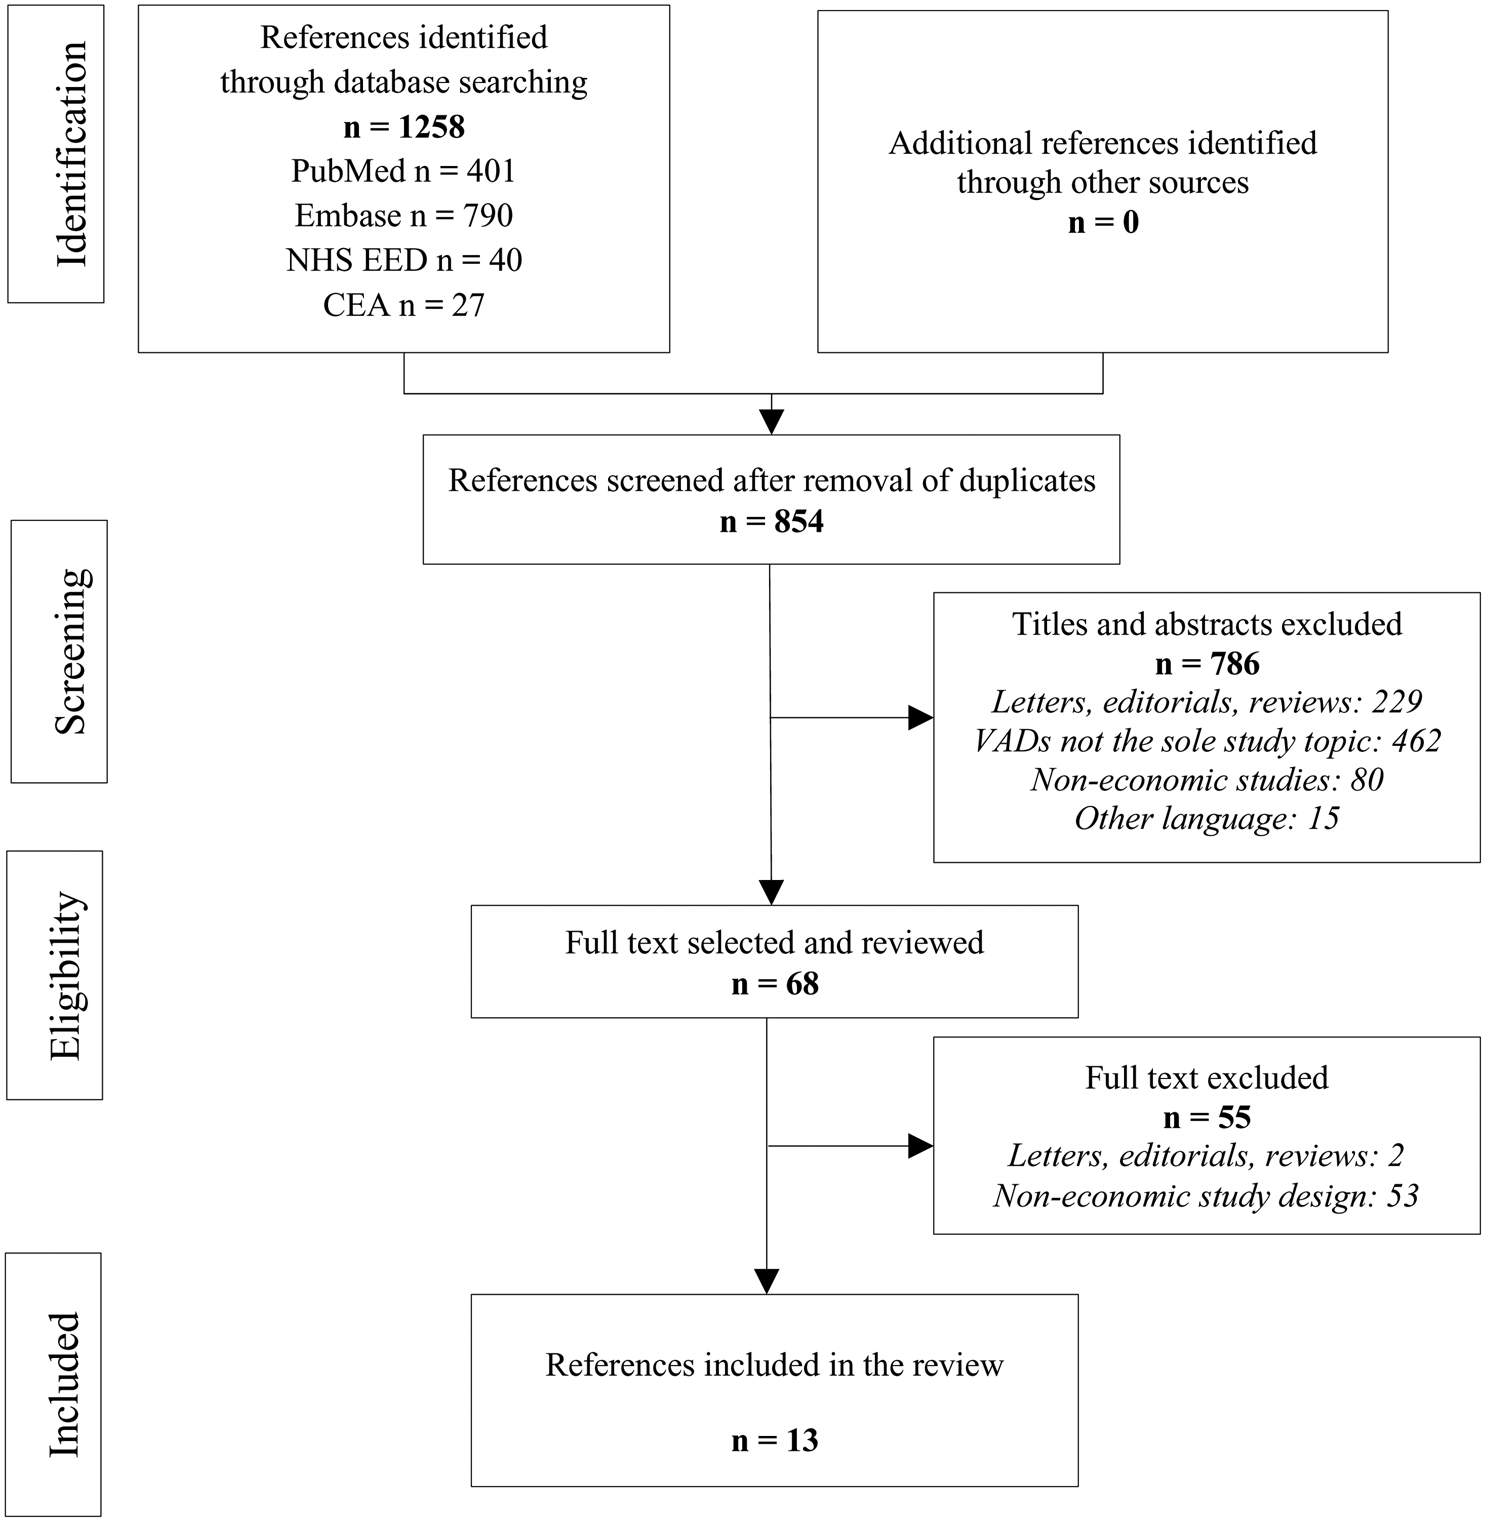
Fig. 1. PRISMA flow chart for study selection. CEA, Cost-Effectiveness Analysis Registry; NHS EED, National Health Service Economic Evaluation Database.
Characteristics of the Studies
Most studies were conducted in North America (n = 6, 46.2 percent) or Europe (n = 5, 38.5 percent). Nine studies (69.2 percent) were conducted in the last 5 years. Twelve studies (92.3 percent) were cost–utility analyses and one (7.7 percent) was a cost-effectiveness analysis (Table 2). A payer perspective was retained for nine studies (69.2 percent) and a societal perspective for three studies (23.1 percent) (Reference Baras Shreibati, Goldhaber-Fiebert, Banerjee, Owens and Hlatky15–Reference Long, Swain and Mangi17). One (7.7 percent) did not state a perspective for the analysis (Reference Alba, Alba, Delgado, Rao, Ross and Goeree18). In most of the studies evaluated, direct costs were used (n = 12; 92.3 percent). Only one study used total costs (Reference Tadmouri, Blomkvist, Landais, Seymour and Azmoun19). Authors considered a lifetime horizon in eleven publications (84.6 percent). Other horizons adopted were 5 years (Reference Magnetta, Kang, Wearden, Smith and Feingold20) in one study and 12 months (Reference Takura, Kyo, Ono, Tominaga, Miyagawa and Tanoue21) in another study. Five articles (38.5 percent) did not specify a funding source. Another five studies (38.5 percent) received public funding and three private (23.1 percent) funding. All publications performed an uncertainty analysis. Nine of the thirteen studies (69.2 percent) provided both deterministic and probabilistic analyses, two (15.4 percent) provided only deterministic analyses, and two other studies (15.4 percent) provided only probabilistic analyses. For deterministic analyses, details on the factors that greatly impacted the ICER are presented in Supplementary Table 1. The cost of the VAD seems to be the factor that had the strongest influence on the ICER in most studies. In the majority of cases (n = 8; 61.5 percent), VADs were compared with inotrope-dependent medical therapy (IDMT). For two studies (15.4 percent), comparators were “no LVAD.” For all economic studies, an ICER was calculated. ICERs varied between $33,014/QALY (quality-adjusted life-years) (Reference Pulikottil-Jacob, Suri, Connock, Kandala, Sutcliffe and Maheswaran22) and $414,275/QALY (Reference Moreno, Novielli and Cooper23). In those studies that considered LVADs/IDMT, all ICERs converged toward similar results. The average was $203,225/QALY with a 95 percent confidence interval ($120,177/QALY; $286,273/QALY).
Table 2. Details of the Drummond et al. criteria for each included study

BTT-VAD, bridge-to-transplantation ventricular assist device; CEA, cost-effectiveness analysis; CUA, cost–utility analysis; DT, destination therapy; ECMO, extracorporeal membrane oxygenation; ICER, incremental cost-effectiveness ratio; HMII, HeartMate II®; HTx, heart transplantation; HW, HeartWare®; IDMT, inotrope-dependent medical therapy; LVAD, left ventricular assist device; LY, life-years; QALY, quality-adjusted life-years; VAD, ventricular assist device.
If CUA, ICER was given in QALY only. If CEA, ICER was given in LY only.
Quality of the Evidence Sources
The quality of evidence sources for the studies was evaluated using the Cooper scale. Table 3 describes the results of applying the hierarchies of the data source criteria.
Table 3. Ranking of evidence for parameters used in the decision models using the hierarchy scale of Cooper et al.

NA, not applicable.
For four (30.8 percent) studies, clinical effect sizes and safety data were of high quality. One paper (7.7 percent) drew on a single randomized controlled trial (RCT) with a direct comparison with comparator therapy (Reference Magnetta, Kang, Wearden, Smith and Feingold20) and the three others (23.1 percent) drew on indirect comparisons using data from RCTs (Reference Neyt, Van Den Bruel, Smit, De Jonge, Erasmus and Van Dijk16;Reference Chew, Manns, Miller, Sharma and Exner25;Reference Rogers, Bostic, Tong, Adamson, Russo and Slaughter28). In addition, the four studies all measured final outcomes. The level of evidence used for the remaining publications was of poor quality (level C) and among those, one study (7.7 percent) gave no details about the source of data (Reference Takura, Kyo, Ono, Tominaga, Miyagawa and Tanoue21).
For seven studies, baseline clinical data were of high quality; one publication (7.7 percent) used reliable administrative databases specifically conducted for the study (Reference Takura, Kyo, Ono, Tominaga, Miyagawa and Tanoue21) and the six (46.2 percent) other studies used recent case series or analysis of reliable administrative databases covering the same jurisdiction. The level of evidence used for the six other studies (46.6 percent) was of poor quality (level C), using outdated case series or analysis of reliable administrative databases, or estimation from RCTs.
In most studies (84.6 percent), cost data were of high quality (level A). Among them, one study (Reference Takura, Kyo, Ono, Tominaga, Miyagawa and Tanoue21) estimated costs based on a reliable database from a specific study. For two publications (15.4 percent), cost data were of poor quality; one used price rather than cost (Reference Neyt, Van Den Bruel, Smit, De Jonge, Erasmus and Van Dijk16) and the other was based on costs from a different jurisdiction (Reference Magnetta, Kang, Wearden, Smith and Feingold20).
Sources of utility data varied from one article to another. Among the twelve cost–utility analyses, only four (30.8 percent) studies had utility data of high quality; one (7.7 percent) study contained data from a specific study and the three others (23.1 percent) assessed indirect utility data from a sample of patients with the disease of interest, using a tool not validated for the patient population. For four studies (30.8 percent), utility data were direct estimates from a previous study. Finally, the four others did not state the source for utility data. Details of the quality of life estimates are presented in Supplementary Table 2.
The CHEERS checklist is an instrument established to ensure high-quality reporting. Results are shown in Supplementary Table 3 and in Supplementary Figure 1. Question 12 was not applicable for all included studies and question 21 was applicable for only one study (Reference Alba, Alba, Delgado, Rao, Ross and Goeree18). For seven questions, less than the half of studies succeeded in obtaining full points. These questions concerned title, abstract, target population and subgroups, setting and location, comparators, time horizon, and sources of funding. None of the thirteen articles gave complete answers to question 7. This question explores the choice of comparators and its justification. In contrast, all studies obtained 1 point for a full description of the methods used to identify studies, for the source of clinical effectiveness data and for the description of the analytical methods supporting the evaluation. All studies were scored out of a total of 22 points, except for one study, which was scored out of a total of 23 points (Reference Alba, Alba, Delgado, Rao, Ross and Goeree18). The average score was 17.4 (range 15–19). The average score in percentage terms for the thirteen economic studies was 78.6 percent (68.2–86.4 percent) (Reference Baras Shreibati, Goldhaber-Fiebert, Banerjee, Owens and Hlatky15;Reference Pulikottil-Jacob, Suri, Connock, Kandala, Sutcliffe and Maheswaran22;Reference Clarke, Pulikottil-Jacob, Connock, Suri, Kandala and Maheswaran26). Three articles obtained less than 75 percent (Reference Baras Shreibati, Goldhaber-Fiebert, Banerjee, Owens and Hlatky15;Reference Magnetta, Kang, Wearden, Smith and Feingold20;Reference Takura, Kyo, Ono, Tominaga, Miyagawa and Tanoue21).
Discussion
This systematic literature review identified thirteen economic studies. To our knowledge, this review is the first to report the quality of economic evaluations of VADs in depth using three formal guidelines (Reference Drummond, Sculpher, Claxton, Stoddart and Torrance9–Reference Husereau, Drummond, Petrou, Carswell, Moher and Greenberg11). In fact, the objective of this systematic review was to assess the level of evidence of relevant economic studies and not to summarize what is known about the cost-effectiveness of VADs. Thus, we wish to contribute to the HTA process, which is not only designed to review and summarize outcomes but also to assess the quality of the evidence itself (Reference Draborg, Gyrd-Hansen, Bo Poulsen and Horder29).
Looking at the quality of the studies, we first showed that most of the studies fully complied with the Drummond guidelines. For example, ICERs were calculated in all studies, which is a particularly useful criterion for decision markers (Reference Drummond, Sculpher, Claxton, Stoddart and Torrance9;Reference Dakin, Devlin, Feng, Rice, O'Neill and Parkin30). In addition, all authors performed a sensitivity analysis following the ICER calculation, which makes it possible to assess the uncertainty of the calculation and to determine the robustness of the conclusions drawn. One of the most common flaws observed was a lack of detail about funding sources. This raises ethical questions; without this information, it is impossible to know who funded the study. As has been reported by several authors, studies sponsored by industry are much more likely to reach positive conclusions than similar studies funded by not-for-profit organizations (Reference Azimi and Welch31–Reference Barbieri and Drummond33). In addition, none of the included studies relevant here clearly indicated the level of involvement of the sponsor in the research.
We were unable to find previous systematic reviews of VADs that used the Cooper checklist. Using this checklist, we showed that most of the studies were based on clinical data (effect sizes and baseline) of poor quality. Studies using high-quality clinical data were supported by RCTs such as the Randomized Evaluation of Mechanical Assistance for the Treatment of Congestive Heart Failure (REMATCH) trial (Reference Rose, Gelijns, Moskowitz, Heitjan, Stevenson and Dembitsky34), which compared medical management alone with previous-generation pulsatile-flow LVADs, and the HeartMate II Destination Therapy Trial (Reference Slaughter, Rogers, Milano, Russell, Conte and Feldman35), which compared pulsatile-flow LVADs with continuous-flow LVADs. To our knowledge, no other RCTs have evaluated VADs (Reference Neyt, Van den Bruel, Smit, De Jonge and Vlayen27;Reference McIlvennan, Magid, Ambardekar, Thompson, Matlock and Allen36). According to the limited data available, in general the included studies used data from these two RCTs. Clearly, this was not possible when the chosen comparators were not the same as those in the RCTs, and in these cases data were sourced from studies of a lower methodological quality. Information on cost use and utilities use were determined with high-quality data in almost all studies. Even where authors included some cost approximations, the results remained valid, due to the important role of the cost of the VAD in the total cost of the procedure. Therefore, it is relatively easy to determine the total cost of a surgical intervention if the cost of the VAD is known.
We chose to use the CHEERS checklist to assess the quality of reporting and to calculate a score for each publication. The CHEERS checklist was intended to be used for qualitative assessment. However, it has been used repeatedly by authors for quantitative assessment (Reference Mangham-Jefferies, Pitt, Cousens, Mills and Schellenberg37–Reference Hiligsmann, Evers, Ben Sedrine, Kanis, Ramaekers and Reginster39). We observed that three-quarters of relevant studies had a calculated score higher than 75 percent. None had a ratio below 50 percent. The question of which threshold should be used remains unanswered. Several publications have suggested three categories for CHEERS evaluation; high quality for scores over 75 percent, medium quality for scores between 50 percent and 75 percent, and low quality below 50 percent (38;40). According to these categories, most studies included had a high-quality level of reporting. Studies receiving scores determined as high quality describe most of the essential elements required for transparent reporting. This has direct implications for decision makers, because poorly reported research can distort results and mislead the decision making process. In 2018, a systematic review assessed cost-effectiveness analyses of VADs (Reference Schmier, Patel, Leonhard and Midha7). The objective of the study was to identify, describe and summarize published studies on the topic. This study also used the CHEERS checklist. However, in contrast with our systematic review, no score was calculated to compare the quality of identified studies. Although most of the studies included fulfilled all the checklist fields, the authors surprisingly concluded that none of these studies were of sufficient quality to contribute to their understanding of the cost-effectiveness of VADs. These results appear to contradict our own. However, without a calculation of the scores, the conclusion reached by the authors seems not to be based on an objective appraisal.
Nunes et al. published a systematic review of the cost-effectiveness of VADs in 2016, in which eleven studies were identified (Reference Nunes, MacArthur, Kim, Singh, Buchholz and Chatterley6). To assess the quality of relevant studies, the authors used an adapted checklist developed by Neumann et al. (Reference Neumann, Stone, Chapman, Sandberg and Bell41) in 2000. This was based on information from previous versions of published guidelines and recommendations (Reference Siegel42–Reference Menon, Schubert and Torrance44). Most items are very similar to items from the Drummond and CHEERS checklists, but no justification is required for completion of each item. Eight publications were deemed to be of high quality, one of moderate quality, and one of low quality. However, contrary to our systematic review, no score was calculated to compare the quality of identified studies.
Our systematic literature review highlighted some limitations in the field. Thirteen economic evaluations in a 10-year period seems a small number for a pathology that is not rare, particularly as VADs have a high unit cost. In comparison, in a previous study we found seven economic evaluations in a 5-year period for a cheaper device that is used more infrequently (Reference Nédellec, Pineau, Prognon and Martelli12). This small number of studies makes it difficult to make strong conclusions. As stated above, the aim of this study was not to assess the cost-effectiveness of VADs. Nevertheless, we observed that all ICERs comparing LVADs and IDMT were higher than the cost-effectiveness threshold values of different countries. This poses a question about the cost-effectiveness of this technology.
A limitation of our study is that the search was performed in scientific journals and we did not include economic evaluations from gray literature. However, the same studies were identified over the same period of analysis in other reviews on this topic, confirming the reliability of our methodology (Reference Nunes, MacArthur, Kim, Singh, Buchholz and Chatterley6;Reference Schmier, Patel, Leonhard and Midha7). In addition, to determine the quality using the CHEERS checklist, we assigned points for each item, but differentiating between partial or full reporting was difficult for some items. To overcome this issue, we assigned a half point for partial reporting, which allowed accurate and more discriminative scoring.
Conclusion
In the current study, we show that the clinical data used in economic evaluations of VADs are of poor quality in general. This is a sadly common matter in the medical device sector (Reference Zheng, Dhruva and Redberg45). It poses a question about the appropriate level of evidence required in the decision making process about these health products, especially in the case of life-saving medical devices.
Supplementary Material
The supplementary material for this article can be found at https://doi.org/10.1017/S0266462320000409
Conflict of Interest
All authors have nothing to disclose.


