


Economic evaluations are playing an important role in decision making due to the increasing costs of healthcare combined with uncertainty regarding the effectiveness and costs associated with new health technologies. To improve the quality of economic evaluations of healthcare interventions and reporting transparency, several guidelines have been developed around the world. However, previous country-specific assessments conducted during the last decade in Canada (Reference Anis, Rahman and Schechter2;Reference Baladi, Menon and Otten3), Spain (Reference Garcia-Altes16), Australia (Reference Salkeld, Davey and Arnolda24), and more recently, in Italy (Reference Cornago, Bassi, De Compadri and Garattini11;Reference Garattini, De Compadri, Clemente and Cornago15), Germany (Reference Schwappach and Boluarte25), Korea (Reference Lee, Brouwer, Lee and Koo20), and South America (Reference Machado, Iskedjian and Einarson21) have shown that many studies do not fully adhere to the general principles proposed in these guidelines, although improvement has been noted over time. One aspect related to the conduct of economic evaluations that appears to require further clarification is the consistency of statistical methods to analyze cost and effectiveness data or to deal with uncertainty.
While inconsistent reporting of statistical methods for the analysis of cost data in economic evaluations conducted alongside randomized controlled clinical trials (RCTs) has been reported (Reference Barber and Thompson4;Reference Doshi, Glick and Polsky13;Reference Graves, Walker and Raine17), the proportion of studies using a statistical test for comparing costs has increased from 53 percent (1995) (Reference Barber and Thompson4) to 80 percent (2003) (Reference Doshi, Glick and Polsky13). However, among studies analyzing costs in 2003, 25 percent did not use appropriate methods to analyze cost data (e.g., using tests based on normal theory for skewed and positive data). Recognizing this problem, the 2005 ISPOR guidelines on economic evaluations alongside clinical trials provided detailed background and directions regarding cost data analysis (Reference Ramsey, Willke and Briggs23). Another methodological issue which has received little attention in the health technology assessment literature is the choice of statistical distributions for count data (e.g., number of episodes of asthma, number of physician visits). Similar to the analysis of cost data, this issue is important, as in some cases (e.g., low number of counts with a high frequency of zeros in the data, skewed data), methods based on normal theory assumptions may lead to inconsistent estimates (Reference Cameron and Trivedi6;Reference Greene18;Reference Hutchinson and Holtman19), which could in turn bias the results of the economic evaluation. Despite the fact that count data are common in economic evaluations of healthcare interventions, to the best of our knowledge, no information is available on the reporting of methods to analyze count data (effectiveness and resource utilization) in published economic evaluations.
The past decade has also seen important methodological developments in terms of statistical methods (Reference Briggs5) to treat and report uncertainty in economic evaluations, for example, probabilistic sensitivity analysis (Reference Claxton, Sculpher and McCabe10), cost-effectiveness acceptability curves (Reference Fenwick, Claxton and Sculpher14), but the recent literature (Italy (Reference Cornago, Bassi, De Compadri and Garattini11;Reference Garattini, De Compadri, Clemente and Cornago15), Germany (Reference Schwappach and Boluarte25), Australia (Reference Dalziel, Segal and Mortimer12)) has generally not reported at a national level how uncertainty was treated in economic evaluations. In addition, although Canada has introduced its third edition of economic guidelines in 2006 (7), no recent assessment of economic evaluation studies has been conducted in Canada. Motivated by these factors, the main purpose of this review was to describe recent published economic evaluations conducted from a Canadian perspective with a focus on data sources and statistical methods for the analysis of effectiveness measures, resource utilization, and uncertainty. We were also interested in knowing to what extent the evidence used to derive effectiveness measures and resource utilization data was Canadian. As requirements for drugs and nondrug technologies differ in Canada (e.g., regulatory, reimbursement), differences between economic evaluations of drugs and nondrug technologies were investigated.
METHODS
Literature Search
A search strategy was developed to identify the published literature evaluating healthcare technologies in Canada. The search was limited to English and French language literature published between January 2001 and June 2006. The primary computerized search was conducted by cross-searching OVID MEDLINE®, EMBASE, CINAHL, Health Economic Evaluations Database (OHE HEED), the Canadian Research Index, and CRD (Centre for Review and Dissemination), which includes DARE (Database of Abstracts of Reviews of Effects), NHS EED (National Health Services, Economic Evaluations Database), and HTA (Health Technology Assessment) databases. A bibliographic search of the included studies was also completed to ensure that all relevant studies were identified. Individualized search strategies for each electronic database using relevant subject headings were created accompanied by the use of the following keywords: Canada, economic evaluation, healthcare programs, cost benefit analysis, cost-minimization analysis, cost-effectiveness analysis, cost-utility analysis and cost consequence. Although we excluded cost consequence studies, it was important to include these keywords in case of misclassification of true economic evaluations.
Titles and abstracts of identified studies were screened for possible inclusion or exclusion before retrieving full-text versions of the publications. Included studies were the studies that examined and compared both the costs and outcomes associated with healthcare technologies from a Canadian perspective. Excluded studies were effectiveness studies, cost studies, studies performed outside of Canada, cost-consequence studies, methodological papers, letters, and commentaries.
Data Abstraction
A standardized abstraction form was created and used to extract key characteristics of the studies under review, including types of technology evaluated (i.e., drugs versus nondrugs), type of economic evaluation (cost-effectiveness analysis, cost-utility analysis, cost-benefit analysis, cost-minimization analysis), study design (patient-level when the analysis was conducted alongside the trial or decision-analytic model-based economic evaluations), funding (e.g., government, industry), and study perspective (e.g., societal). Each study was reviewed to identify information sources (e.g., trial, literature review, meta-analysis) and to classify the effectiveness measures into discrete (count data), continuous, or other types of variables (e.g., dichotomous, scale). For each study, we documented if statistical methods to compare treatment effects in patient-level economic evaluations or input efficacy parameters for decision-analytic models and resource utilization were clearly stated or if one was referred to another publication for further details.
A predefined list was used to classify the statistical methods (e.g., t-test, Chi-squared statistic, Poisson regression). Methods to deal with uncertainty were documented for each study (e.g., probabilistic sensitivity analysis for decision-analytic models, bootstrap for patient-level-based economic evaluations). Analyses were conducted for all included studies and for drug and nondrug evaluations. Statistical differences between drug and nondrug economic evaluations were investigated using the Chi-squared statistic. However, as the choice of statistical methods is primarily dependent on study design (e.g., patient-level data in trial-based evaluations versus secondary sources in model-based economic evaluations), statistical methods were stratified by study design rather than for drug and nondrug studies. All the information was entered into a Microsoft® Access database that was developed for the study purpose.
RESULTS
Literature Search
The literature search identified 1,743 unique citations following the removal of duplicates. After screening titles and abstracts, 1,420 citations were excluded, mainly because they were not economic evaluations or a full report (e.g., letter). A full-text review of the remaining 323 articles resulted in the exclusion of 170 citations, of which 31 were not from a Canadian perspective and 77 were cost-consequence studies (see Supplementary Figure 1, which can be viewed online at www.journals.cambridge.org/thc). Data were abstracted for the 153 Canadian economic evaluations published between January 2001 and June 2006 that met our inclusion criteria.
Description of Studies Included in the Review
Among the 153 articles included in this review, 75 articles (49 percent) were economic evaluations of drugs and 78 (51 percent) evaluated nondrug technologies. Nondrug technologies included procedures (14 percent), devices (12 percent), programs (12 percent), a combination of technologies (10 percent), and other (3 percent). Almost two-thirds of the studies (63 percent) used a government or third-party payer perspective and 23 percent a societal perspective.
Cost-effectiveness analysis (CEA) (N = 89) was preferred over cost-utility analysis (CUA) (N = 28), cost-benefit analysis (CBA) (N = 5), and cost-minimization analysis (CMA) (N = 6). Twenty-four studies used both CEA and CUA in their assessment, and one study evaluated a program using a CEA and a CBA (Table 1). Decision-analytic model-based economic evaluations (N = 101) were more common than patient-level-based economic evaluations (N = 28). Ten studies combined trial data with a decision analytic model and three of these ten studies extrapolated the results over a time horizon larger than 1 year. The category “other” (9 percent) included economic evaluations based on retrospective studies (e.g., chart reviews, case-control studies) or studies that were not based on trial data or modeling techniques (Table 1).
Table 1. Classification of the 153 Studies by Type of Evaluation, Study Design, Source of Funding and Type of Technology Evaluated

CEA, cost-effectiveness analysis; CUA, cost-utility analysis; CBA, cost-benefit analysis; CMA, cost-minimization analysis.
Approximately 80 percent of the studies disclosed their source of funding. Industry funded 67 percent of economic evaluations of drugs and 21 percent of nondrug evaluations, a difference that was statistically significant (Table 1). No statistical differences between economic evaluations of drugs and nondrugs were found in terms of type of economic evaluations or study design (Table 1).
Effectiveness Measures and Source of Evidence
Two hundred eleven (211) effectiveness measures were used in these 153 studies. The majority of the effectiveness measures were disease specific (56 percent) such as a 10-point improvement in a disease-specific scale or number of events avoided. Life-years gained (LYG) and quality-adjusted life-years (QALYs) represented 20 percent and 23 percent of the outcomes, respectively. Approximately one-third of all effectiveness measures were discrete outcomes (e.g., events or cases avoided) (see Supplementary Figure 2, which can be viewed online at www.journals.cambridge.org/thc).
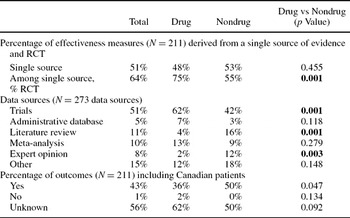
In terms of information sources, approximately half (51 percent) of the effectiveness measures were based on one single source of evidence, and two-thirds of the single source of evidence were based on randomized controlled trials. RCTs were used significantly more often in drug than nondrug economic evaluations (Table 2). Of the 273 data sources used to derive these 211 outcomes, approximately half (51 percent) of the information sources were trials (either patient-level or published literature). The remaining sources originated from literature reviews without a meta-analysis (11 percent), meta-analyses (10 percent), expert opinion (8 percent), administrative databases (5 percent), or other (e.g., chart review, literature sources cited without a comprehensive search strategy). Reporting of whether Canadian patients were included in the assessment of the effectiveness measure was uncommon (Table 2). Trials as information sources were used more often in drug assessments, whereas literature reviews and expert opinion were used more often in nondrug assessments, and these differences were statistically significant (Table 2).
Table 2. Data Sources and Canadian Evidence for Effectiveness Measures by Type of Technology Assessed
RCT, randomized controlled trial.
Resource Utilization, Unit Costs, and Source of Evidence
Most articles used published data (25 percent), trial information (23 percent), and expert opinion (14 percent) to derive resource utilization (Table 3). Administrative databases were cited 12 percent of the time. Half of the studies (51 percent) included in this review reported that the source of resource utilization was only Canadian, whereas non-Canadian evidence was reported in 14 percent of the studies. The only statistical difference between economic evaluations of drugs and nondrugs was related to the number of studies stating that resource utilization used in the evaluation was not 100 percent Canadian, which was more frequently observed for drug evaluations (Table 3). Almost one-quarter (24 percent) of the studies presented resource utilization assumptions in a table. With respect to unit costs, the majority of the studies (78 percent) reported the sources of unit costs and half of the studies (52 percent) presented unit costs in a table. Unit costs were derived from provincial formularies (29 percent), other studies (18 percent), and administrative databases (16 percent). One-third of the studies (33 percent) mentioned having updated costs to reflect current dollars.
Table 3. Data Sources and Canadian Evidence for Resource Utilization and by Type of Technology Assessed

Statistical Methods
Statistical methods used to analyze effectiveness measures in patient-level economic evaluations or input efficacy parameters in models were clearly stated in 69 of the 153 studies under review (45 percent). In five cases, the reader was referred to other studies for a description of the statistical methods. The reporting of statistical methods occurred more frequently when the analysis was conducted alongside a trial (82 percent) rather than when modeling techniques (29 percent) or when a combination of patient-level data and modeling techniques (30 percent) was used (Table 4).
Table 4. Reporting of Statistical Methods for the Analysis of Effectiveness Measures by Study Design

Note. Some percentages may not sum to 100% due to rounding.
ANOVA, analysis of variance; OLS, ordinary least squares.
A total of 125 statistical methods were reported in these sixty-nine studies (Table 4). Among these methods, t-test (27 percent) and Chi-squared statistic (20 percent) were more common in patient-level based economic evaluations to compare treatment effects while fixed or random-effect meta-analyses (42 percent) were the methods of choice for models for the input efficacy parameter (Table 4), with an equal proportion of fixed and random effects techniques. Although analyses based on Kaplan-Meier (KM) estimates represented 6–7 percent of all studies reporting statistical methods, KM was used more often when the study combined trial data with a model (33 percent). Less than 20 percent of the methods were based on regression models (e.g., ordinary least squares, hazard models) (Table 4).
For count data, statistical methods were documented for 13 percent of the sixty-seven effectiveness measures classified as count outcome, yielding a total of nine statistical methods: Mann-Whitney U (N = 1), Chi-squared statistics (N = 2), meta-analysis (N = 1), Poisson (N = 1), Student-t (N = 2), analysis of variance (ANOVA) (N = 1) and survival analysis (N = 1). Only four studies reported statistical methods for resource utilization, for a total of five methods: Poisson regression (N = 1), Wilcoxon test (N = 1), KM analysis (N = 1), Chi-squared statistics (N = 1), and ANOVA (N = 1).
Treatment of Uncertainty
To deal with uncertainty, authors relied predominantly on univariate (67 percent) or multi-way (17 percent) sensitivity analysis in which one or two parameters are varied while the other parameters are held constant (see Supplementary Table 1, which can be viewed online at http://www.journals.cambridge.org/thc). To deal with parameter uncertainty, probabilistic sensitivity analyses (e.g., Monte-Carlo simulations) were conducted in 24 percent of model-based studies. In comparison, bootstrap techniques to deal with sampling uncertainty were used in 36 percent of patient-level-based economic evaluations. Representation of uncertainty (e.g., any deterministic sensitivity analysis, probabilistic sensitivity analysis [PSA]) was illustrated graphically 28 percent of the time. Subgroup analyses were conducted 9 percent of the time (see Supplementary Table 1). The only statistical difference between evaluations of drug and nondrug technologies was related to the use of Monte Carlo simulations for decision-analytic models, which was more frequent for drug evaluations (33 percent versus 15 percent for nondrug technologies).
DISCUSSION
Our review included 153 economic studies published between 2001 and June 2006 from a Canadian perspective, of which half of the studies were evaluations of pharmacotherapies and half were funded by the industry. As observed elsewhere, our results indicated that CEA was the preferred method of analysis. Of concern, and as previously reported (Reference Anell and Norinder1;Reference Tarride, McCarron and Lim26), disease-specific end points were commonly used in CEAs, limiting our ability to compare different interventions. Although the 1994 (8) and 1997 (9) Canadian guidelines recommended a societal perspective as the reference case, less than one of four studies under review used a societal perspective.
Consistent with the review of the UK National Health Service (NHS) Economic Evaluation Database (EED) between 1994 and 1999 (Reference Nixon, Stoykova and Glanville22), the majority of the studies included in our review used decision-analytic models. Effectiveness measures were commonly derived from a single source of evidence (51 percent in our study versus 66 percent in the NHS study) or from trials (50 percent of data sources in Italy (Reference Garattini, De Compadri, Clemente and Cornago15) and in our review). Our results also indicated that two-thirds of the single sources of evidence were based on randomized trials and meta-analytic techniques were used in 10 percent of the studies. Although not directly comparable, these proportions are similar in magnitude with a recent Australian review of 245 interventions published from 1966 to April 2005 (Reference Dalziel, Segal and Mortimer12) indicating that 54 percent of the evidence for effectiveness measures was either derived from a RCT or a meta-analysis (i.e., strong evidence) versus 43 percent in our review. We also determined to which extent the evidence was Canadian. Results showed that less than 50 percent of the studies indicated whether Canadian patients were included in the determination of the effectiveness measures or if resource utilization were only Canadian. This may also be of concern due to potential differences in patient characteristics and healthcare systems between Canada and other countries. Our review also highlighted the need to increase the use of administrative databases to perform economic evaluations. Despite the wealth of Canadian administrative data, less than 15 percent of the studies used administrative databases for the determination of the resource utilization.
Statistical methods used to assess effectiveness measures were commonly reported in patient-level economic evaluation (82 percent of the time) but rarely in decision-analytic models (29 percent). Despite the fact that almost one-third of the reported effectiveness measures were discrete variables, count data models (e.g., Poisson, Negative Binomial distribution) were rarely reported. Within the limited number of statistical methods reported to analyze count data (N = 14), techniques based on normal theory (e.g., Student t, ANOVA) were used in almost one of three methods, despite the fact that the count data are bound to be nonnegative and discrete. Other results also showed that a large number of studies did not fully make use of statistical methods to deal with sampling uncertainty in patient-level analysis or parameter uncertainty in decision-analytic models but rather relied on univariate sensitivity analysis.
Although there are no studies to directly compare our findings, a recent review of methods to analyze cost data in economic evaluations conducted alongside randomized clinical trials (N = 115 economic evaluations published in 2003 of which 42 calculated a cost-effectiveness ratio) provides an insightful comparison with our patient-level analysis. In this review, Doshi et al. (Reference Doshi, Glick and Polsky13) found that 20 percent of the studies did not perform a statistical test for the comparison of costs (compared to 20 percent in our study for effectiveness) and one-third did not perform the appropriate test, which is also similar to our findings for count data. The use of regression techniques to analyze cost data in the review of Doshi et al. (Reference Doshi, Glick and Polsky13) or effectiveness data in our study was also similar (9 percent versus 11 percent, respectively). Our results regarding the proportion of economic evaluations conducted alongside a trial that dealt with sampling uncertainty were also consistent with the findings of Doshi et al. (57 percent in the review by Doshi et al. among studies calculated an incremental cost-effectiveness ratio versus 36 percent in our review). Our results also indicated that 80 percent of the decision-analytic model-based economic evaluations did not report any statistical methods for efficacy input parameters. This result may be explained by the fact that models are built from secondary sources of data, and it may not be possible to make statistical comparisons in some cases. However, the majority (75 percent) of the decision-analytic models did not fully explore the uncertainty associated with the model parameters by conducting a PSA, although univariate sensitivity analyses were commonly used. Compared to univariate sensitivity analyses, PSA in which all input parameters are sampled from predefined distributions presents a more realistic representation of the impact of parameter uncertainty on the results (5,10). When we compare our results to a recent review of 48 economic evaluations conducted by five Canadian HTA agencies (Reference Tarride, McCarron and Lim26), Canadian HTA agencies more frequently used probabilistic sensitivity analyses (67 percent versus 24 percent in our study) to deal with parameter uncertainty. Finally, our results indicated few differences between economic evaluations of drug and nondrug technologies in terms of types of economic evaluation, study design, and data sources for resource utilization. However, statistical differences were noted in terms of funding (i.e., industry funding mostly drug evaluations), data sources for the effectiveness measures (e.g., more trials and less expert opinion in drug evaluations), and use of probabilistic sensitivity analysis (e.g., more frequently conducted for drug assessments).
Several limitations associated with this study should be taken in consideration when interpreting the results. Due to the broad research question and the challenges associated with developing an inclusive literature search strategy, there is a risk that some studies may have been missed in the initial screening process. However, to minimize this risk, all references listed in the included studies were manually searched to identify potential “missed” studies. There is also a risk that some study characteristics may have been misclassified despite our attempts to develop a data abstraction form requiring minimal data interpretation. Although our results are similar to previous assessments in many respects, the results of this study may not be generalizable to other countries as only published studies conducted from a Canadian perspective were included in our assessment. Although we provide the first description of the statistical methods reported in the economic literature to analyze effectiveness measures (count and non count data) and resource utilization, we did not evaluate if the statistical methods were appropriate. This would have suggested to analyze all the data sources cited in these studies, which was beyond the scope of this review. This is an important avenue of research left for future research. However, although limited by the low number of reported methods, our findings seem to suggest some inappropriate use of methods for count data (e.g., t-test). Similarly, we did not evaluate the quality of these studies or compliance with the Canadian economic guidelines but rather provided a description of recent economic evaluations conducted from a Canadian perspective with a focus on data sources, statistical methods for effectiveness measures, resource utilization, and to deal with uncertainty.
Despite these limitations, our sample was composed of 153 economic evaluations conducted from a Canadian perspective and published between 2001 and mid-2006. As such, the trends observed in this assessment should provide a good overview of the characteristics of economic papers recently published in Canada. Our results are also comparable with previous assessments conducted elsewhere in terms of types of economic evaluations, study design, study perspective, sources of information, and treatment of uncertainty. These results have several implications. First, it will be important to appraise future economic evaluations conducted in Canada in light of the 2006 Canadian guidelines for economic evaluations of healthcare technologies and recent methodological advancements. More importantly, future textbooks and guidelines should provide guidance regarding the conduct and reporting of the statistical methods used to analyze effectiveness measures and count data resource utilization. For example, the more recent ISPOR guidelines for conducting economic evaluations of clinical trials provided guidance regarding the analysis of cost data (Reference Ramsey, Willke and Briggs23). Although costs and count data (e.g., one-third of all effectiveness measures in our sample of 153 economic studies, resource utilization) are equally important in economic evaluations and share similarities (positive data, skewed data), the analyst is provided with little guidance regarding the analysis of count data in economic evaluations. The authors of future studies should also be encouraged to fully explore parameter or sampling uncertainty in economic evaluations of healthcare technologies to increase confidence in the results. Education should remain a priority to train students, health professionals, and decision makers to conduct, report, and interpret economic evaluations of healthcare technologies.
In summary, our quest of evidence in published Canadian economic studies indicated the following: (i) half of the economic evaluations used strong level of evidence; (ii) half of the health outcomes were disease-specific; (iii) statistical methods used to determine input efficacy parameters in decision-analytic models were poorly reported; (iv) it was unknown if Canadian patients were included in the source of evidence in 50 percent of the cases; (v) it was unknown if Canadian resource utilization only were used 35 percent of the time; (vi) a minority of studies dealt with the uncertainty associated with the data in a comprehensive way. These results are aligned with recent reviews calling for an improvement in quality and reporting transparency in economic evaluations.
CONTACT INFORMATION
Jean-Eric Tarride, PhD (tarride@mcmaster.ca), Assistant Professor, Morgan E. Lim, MA (limme@mcmaster.ca), PhD Candidate, James M. Bowen, BScPhm, MSc (bowenj@mcmaster.ca), Program Manager, Catherine Elizabeth McCarron, MA, MSc (mccarrce@mcmaster.ca), PhD Candidate, Gord Blackhouse, MSc (blackhou@mcmaster.ca), Research Associate, Robert Hopkins, BA, BSc, MA (Econ) (hopkinr@mcmaster.ca), Research Associate, Daria O'Reilly, PhD (oreilld@mcmaster.ca), Assistant Professor, Feng Xie, PhD (fengxie@mcmaster.ca), Assistant Professor, Ron Goeree, MA (goereer@mcmaster.ca), Associate Professor, Department of Clinical Epidemiology & Biostatistics, McMaster University, Programs for Assessment of Technology in Health (PATH) Research Institute, 25 Main Street West, Suite 2000, Hamilton, Ontario L8P 1H1, Canada


