


Cervical cancer is caused by high-risk genotypes of the human papillomavirus (HPV). Frequently detected high-risk genotypes are HPV-16, detected in approximately half of the cervical cancers, and HPV-18, frequently associated with adenocarcinoma (25). Until recently, regular cytological screening (PAP test) was the only way to prevent cervical cancer, and in countries where screening is routinely performed every 3 to 5 years in women 25 to 64 years old, up to 80 percent of the cases of invasive cervical cancer can be prevented (Reference Day, Moss, Berrino, Choi and Clarke17).
Recently two HPV vaccines, Gardasil (Merck/Sanofi-Pasteur) and Cervarix (GSK), became available in Europe, both containing antigens based on HPV types 16 and 18 and providing a high level of protection against HPV infection with these types (20;Reference Garland, Hernandez-Avila and Wheeler21;Reference Harper, Franco and Wheeler23). In addition, Gardasil contains antigens based on HPV types 6 and 11, which are mainly of relevance for the prevention of HPV-associated genital condilomas. Vaccination with such vaccines was demonstrated to prevent infections with these specific strains and, as a consequence, vaccination could thus, in theory, prevent the associated cervical cancers.
HPV vaccination is already recommended for young females before sexual initiation in many European countries, but with varying degrees of reimbursement of the vaccine. In Belgium, the Health Council recommended HPV vaccination for girls aged between 10 and 13 years (15) and, since September 2007, the Commission for Reimbursement of Pharmaceutical Products (CTG/CRM) agreed on the reimbursement of Gardasil for girls between 12 to 15 years of age.
Many economic evaluations (Reference Bergeron, Largeron, McAllister, Mathevet and Remy5;Reference Boot, Wallenburg and de Melker8;Reference Brisson, Van de Velde, De Wals and Boily10;Reference Chesson, Ekwueme, Saraiya and Markowitz12;16;Reference Elbasha, Dasbach and Insinga18;Reference Goldie, Kohli and Grima22;Reference Kulasingam, Connelly and Conway26;Reference Kulasingam and Myers27;Reference Neilson and Freisleben de Blasio34;Reference Sanders and Taira36;Reference Taira, Neukermans and Sanders40) and reviews (Reference Newall, Beutels, Wood, Edmunds and MacIntyre35) of HPV vaccination programs have been published. Whether based on static or dynamic models, the reported cost-effectiveness ratios for 12-year-old girls' vaccination were all judged favorable by the authors of the respective publications. Due to the current lack of information (e.g., about the vaccine long-term characteristics and the natural progression of the disease), these models had inevitably to make assumptions on crucial parameters. Unfortunately, the possible implications of the joint uncertainty in those parameters were not always assessed in probabilistic sensitivity analyses (Reference Boot, Wallenburg and de Melker5;Reference Boot, Wallenburg and de Melker8;Reference Chesson, Ekwueme, Saraiya and Markowitz12;16;Reference Elbasha, Dasbach and Insinga18;Reference Goldie, Kohli and Grima22;Reference Kulasingam, Connelly and Conway26;Reference Kulasingam and Myers27;Reference Neilson and Freisleben de Blasio34;Reference Sanders and Taira36;Reference Taira, Neukermans and Sanders40). Furthermore, while some economic evaluations explore the effect of optimizing cervical cancer screening once HPV vaccination is established (Reference Goldie, Kohli and Grima22;Reference Kulasingam and Myers27), the risk that HPV vaccination could induce a false sense of security and reduce the existing screening coverage was never explicitly quantified.
The aim of the current economic evaluation was thus twofold: first, to assess the cost-effectiveness of the currently recommended HPV vaccination scheme in Belgium compared with the currently recommended screening program, and second, to quantify the potential detrimental health consequences of HPV vaccination, should this vaccination program induce a false sense of protection in the population and reduce the level of screening coverage. In this context, the impact of a reduction of the level of screening coverage on the intervention's cost-effectiveness ratio is also measured. Compared with earlier models, we aimed to minimize the number of assumptions for which no data were available by directly modeling the effect of vaccination on precancerous lesions and cervical cancer (without passing through the intermediate state of “HPV infection”) and we tested the remaining uncertainty extensively in a probabilistic sensitivity analysis.
METHODS
Model Structure
We developed a Markov model (1-year cycles) in Microsoft Excel®, following a cohort of 58,600 (the Belgian target cohort) 12-year-old girls over their lifetime, through various health states: susceptible, complete hysterectomy (for reasons other than cervical cancer), cervical cancer, cured cervical cancer, and death (Figure 1). High-grade precancerous lesions (CIN2+, i.e., CIN2 and CIN3) were included in the model as an event.

Figure 1. Structure of the Markov model for the screened (dotted+plain arrows) and unscreened (plain arrows) populations. The CIN2+ event (dotted circle and arrows) applies only to screened women. The arrow between the states “susceptible” and “cervical cancer” represent either, for the screened women, the incidence of cervical cancers not detected through screening (i.e., adenocarcinomas) or, for unscreened women, the natural incidence of cervical cancers (i.e.,adenocarcinomas and squamous cell carcinomas).
The model slightly differed according to the screening status of the women. The model assumes that women who are screened are completely protected against squamous cell carcinomas and may only develop those cervical cancers that are less detected through screening, that is, adenocarcinomas. Screened women in whom CIN2+ is detected are thus assumed to be all adequately treated in the same Markov cycle and return to the state “susceptible,” unless the treatment consists of complete hysterectomy or they die from causes unrelated to cervical cancer, in which case they move to “complete hysterectomy” or “noncervical cancer death,” respectively.
In the unscreened population, women move directly to the state “cervical cancer” if they develop cervical cancer (i.e., adenocarcinomas or squamous cell carcinomas).
Women who die within 5 years after the diagnosis of cervical cancer move to the joint “noncervical cancer or cervical cancer death” state. Death from cervical cancer and death from other cause are presented jointly because, in practice, the real cause of death would not be known. During these 5 years after diagnosis, we assume an additional mortality, above the noncervical cancer death, attributable to cervical cancer. Although presented jointly, the model allows thus computing the “noncervical cancer” and “cervical cancer” deaths separately. Finally, women who survive 5 years after cervical cancer diagnosis move to the “cured cervical cancer” state.
Economic Analysis
The model is used to assess the cost-effectiveness of HPV vaccination plus screening relative to screening only. The analysis is performed from the perspective of the Belgian healthcare payer, which includes the costs to the National Institute for Health and Disability Insurance (RIZIV/INAMI), the costs to the Ministry of Health and the costs to the patient. In the base-case analysis, costs are discounted at 3 percent and effects at 1.5 percent, conform to the Belgian pharmacoeconomic guidelines (Reference Cleemput, Van Wilder, Vrijens, Huybrechts, Ramaekers and (KCE)14).
Epidemiologic and Treatment Parameters
Age-specific mortality hazard rates in the general population are obtained from national statistics for 2001 (Reference FOD Economie and Energie1). The mortality for “cured cervical cancer” patients and the baseline mortality for “cervical cancer” patients (i.e., “noncervical cancer” death for “cervical cancer” patients, Figure 1) are assumed to be identical to that of the general population. An additional age-independent mortality hazard rate (0.0605/year) is attributed to cervical cancer patients for a 5-year period (i.e., “cervical cancer death” for “cervical cancer” patients). This additional mortality rate is obtained by comparing the observed 5-year survival of Belgian cervical cancer patients (68.4 percent) (Reference van Eycken and De Wever43) with the 5-year survival of a Belgian population with a similar age structure as cervical cancer patients (92.6 percent).
Age-specific incidence rates of CIN2+ lesions and complete hysterectomy for reasons other than cervical cancer were derived from the Belgian Minimal Clinical Dataset for the year 2004 using ICD-9-CM codes.
Age-specific cervical cancer incidence figures were obtained from the Belgian Cancer Registry (3). These incidence figures relate to the entire Belgian population, that is, including screened and unscreened women. Because we assume an average interval of 12 years between the occurrence of CIN2+ lesions and the development of cervical cancer based on Dutch data (Reference Meijer, Snijders and Van Den Bruel29;Reference van Oortmarssen, Habbema and van Ballegooijen44), screened women become susceptible to cervical cancers (adenocarcinomas and squamous cell) at 76 years old at the earliest (i.e., screening up to 64 years + 12 years cervical cancer development time). The observed Belgian cervical cancer incidence figures can then only directly be applied to women aged less than 25 and more than 76, as the recommended screening of 25- to 64-year-old women does not impact cervical cancer occurrence in these groups. For women between 25 and 76 years, the impact of the recommended screening should be taken into account. According to our model design and given the 12-year time interval, screened women only incur the risk of adenocarcinoma from 25 to 76 years of age, representing 19.5 percent of the observed cervical cancers based on the Belgian Cancer Registry (3). Unscreened women between 25 and 76, have higher incidence rates than those observed, but precise figures are not available for the natural history of cervical cancer. For this group, incidence rates are derived from an existing epidemiological model (Reference Myers, McCrory, Nanda, Bastian and Matchar32). We corrected the population incidence figures for hysterectomies, CIN2+ and cervical cancer to obtain the true incidences in women with a uterus.
Vaccination Strategies
The intervention consists of three doses of the HPV vaccine administered at the age of 12 years, or 16 in an alternative scenario. Similar to other studies, one booster is given 10 years after the initial vaccination in the base-case scenario. An alternative scenario assumes lifelong protection and, hence, no booster shots.
Vaccine Characteristics
In contrast to most modeling studies, we model vaccine efficacy in terms of protection against CIN2+ lesions and cervical cancer, regardless of the HPV genotype. Vaccine and booster efficacy (i.e., relative risk reduction) against all CIN2+ lesions is assumed to be 46 percent (95 percent CI: 24–62 percent) based on pooled Gardasil results in women testing negative for high-risk HPV at baseline and receiving at least one dose of the vaccine (30). Based on the observed efficacy for CIN2+ and a proportionally larger efficacy against cervical cancer as reported in a meta-analysis (Reference Smith, Lindsay and Hoots38), the vaccine efficacy against all cervical cancers in our model is assumed to be 60 percent (range, 31–81 percent). When administered at 16 years, vaccination effectiveness is assumed to be 32 percent against CIN2+ (linear interpolation between reported efficacies at 12 years (30) and at 20 years (20)) and 41.7 percent against cervical cancer.
The duration of protection against HPV infection after vaccination is highly uncertain. Data from clinical trials are limited to 5-year follow-up (Reference Villa, Costa and Petta45). In our base-case analysis, we assume a protection against HPV infection during on average 15 years (range, 5–25 years), based on a modeling study of HPV16 antibody levels (Reference Fraser, Tomassini and Xi19). The rationale for this strategy is that, with a booster at 10 years (the most frequently adopted booster frequency in literature), the protection against HPV infection must be assumed longer. Because evolution to CIN2+ requires persistent HPV infection (Reference Woodman, Collins and Young46), vaccination is assumed to confer an additional protection of 6 years (range, 2–10 years) against CIN2+ lesions. This means that women who are no longer protected against HPV after the initial three doses or the booster vaccination are still protected against CIN2+ for an additional 6 years. As explained before, we also assume a lag-time of 12 years (range, 4–20 years) between the occurrence of CIN2+ lesions and the development of cervical cancer. The total duration of protection against cervical cancer after initial vaccination or after the last booster is, therefore, 33 years (15 + 6 + 12) (Reference Thiry, Lambert and Cleemput41).
The coverage of the initial vaccination program is set at 84 percent (95 percent CI: 81.4–85.8 percent), similar to the coverage rate for the 12-year-old organized measles-mumps-rubella vaccination (Reference Van Damme, Theeten and Hoppenbrouwers42). The booster coverage rate is set at 59 percent (range, 30–80 percent), which corresponds to the estimated compliance rate with the 3-yearly cervical cancer screening in Belgium (Reference Hulstaert, Arbyn and Huybrechts24). The rationale behind this assumption is that booster vaccination will depend more on the women's individual initiative, and women who regularly visit their gynecologist will also be more likely to receive a booster dose of the vaccine when needed.
Comparator
The comparator is the recommended screening strategy in Belgium, that is, 3-yearly screening of women between 25 and 64 years of age (Reference Hulstaert, Arbyn and Huybrechts24). For screening coverage, we used the concept of “screening coverage equivalent,” which was calculated by calibration on the expected prevalence of cervical cancers in the model. The base-case screening coverage equivalent is thus equal to the percentage of screened women needed in the model to produce the currently observed number of cervical cancer cases in Belgium, in the absence of vaccination. This screening coverage equivalent was estimated at 79.1 percent (Reference Thiry, Lambert and Cleemput41).
In the base-case analysis, we assume that the screening coverage equivalent remains unchanged after vaccination. As this assumption might be too optimistic, because vaccination might reduce inclination for screening, an alternative scenario investigates the impact of a hypothetically lower screening coverage equivalent (59 percent) after vaccination.
Effects
Four outcome parameters are considered: life-years gained (LYG), quality-adjusted life-years (QALYs) gained, avoided cervical cancer cases, and avoided cervical cancer deaths. The number of LYG with vaccination resulted immediately from the model: the cumulative number of people alive at each Markov cycle in the screening strategy was subtracted from the cumulative number of people alive in each cycle in the vaccination strategy. A similar calculation was made to obtain the number of cervical cancer cases and deaths avoided by the vaccination strategy.
QALYs were obtained by weighing each year of life gained in a specific state by the quality weight of that state (Supplementary Table 1, which can be viewed online at www.journals.cambridge.org/thc). For the state “susceptible,” age-specific values from a population study in Flanders were used (Reference Cleemput13). Quality of life losses relative to these “norm” values due to CIN2+, cervical cancer, or cured cervical cancer states are derived from the literature (Reference Elbasha, Dasbach and Insinga18;Reference Stoykova39).
Costs
All costs are expressed in euros of the year 2006. Methods used to estimate costs were conform to the Belgian Guidelines for Pharmacoeconomic evaluations in Belgium (Reference Cleemput, Van Wilder, Vrijens, Huybrechts, Ramaekers and (KCE)14). According to these guidelines, the sum of reimbursement tariffs and patients' co-payment for health services should be used as a proxy for costs.
In the base-case, the price (ex-factory price with 10 percent discount for bulk orders) of the vaccine is set at €114.5 per dose. As booster vaccination is less likely to be organized, the cost of the booster is set at the public price of the Gardasil vaccine (€137.4 per dose) (4). We assume no additional administration costs for the first dose, because it can be administered alongside currently existing organized vaccinations, while subsequent doses each incur a cost equivalent to one general practitioner visit (€20.8).
Given the absence of Belgian data, the average treatment cost of cervical cancer is based on a French study and is estimated at €16,138 (95 percent CI: €11,854–€20,422) per case (Reference Arveux, Benard and Bouee2). The cost of a CIN2+ treatment is valued at €368.5, based on RIZIV/INAMI reimbursement tariffs. The cost of screening consists of the cost of PAP smear (€45.1, including 10 percent re-testing for abnormal results), the cost of a colposcopy for all positive PAP tests (€31.8) and the cost of biopsy for true positive PAP tests (€60.6). More details on these costs can be found in Supplementary Table 2 (which can be viewed online at www.journals.cambridge.org/thc).
Sensitivity Analyses
A probabilistic sensitivity analysis is performed, based on 1,000 Monte Carlo simulations, using a normal distribution for the cost of cervical cancer and beta distributions for the QALY weights, the durations of protection against HPV, CIN2+ and cervical cancer, the PAP test specificity, and the vaccination and booster coverage rates. The efficacy of the vaccine in reducing CIN2+ (and cervical cancer) is fitted with a normal distribution on the natural log, trimmed to its 99 percent confidence interval to avoid extreme values that induce impossible results.
In addition, scenario analyses are performed on the discount rates, the model time frame and the price of the vaccine. A summary of all modeling inputs and assumptions can be found in Supplementary Table 3 (which can be viewed online at www.journals.cambridge.org/thc). Results are presented as mean values plus the central 95 percent limits of the distribution (95 percent credibility interval, CrI) (Reference Brisson, Van de Velde, De Wals and Boily10).
RESULTS
Burden of Disease
In the absence of vaccination and with current screening, the model predicts that in a cohort of 58,600 twelve-year-old girls, 519 (95 percent CrI, 507–531) would develop cervical cancer of any HPV high-risk type, which would result in 168 cervical cancer deaths (95 percent CrI, 163–173 deaths). The associated (discounted) total direct medical cost (i.e., screening, CIN2+ and cervical cancer treatment costs) is anticipated to be €280.5 (95 percent CrI, €273.7–€287.4) per 12-year-old girl. The cohort's undiscounted calculated life expectancy at age 12 is 70.1 years or 57.3 quality-adjusted years per person. After discounting, this corresponds to 43.3 years or 36.3 quality-adjusted years per person after the age of 12. The distribution of cervical cancers cases over the cohort's lifetime, in the absence of vaccination is shown by the plain bold line in Figure 2.
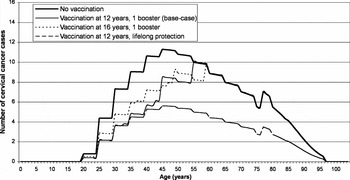
Figure 2. Yearly number of cervical cancer cases by age.
Vaccine and Screening Effectiveness
Under base-case assumptions, HPV vaccination would prevent 20 percent or 103 cases (95 percent CrI, 40–180 cases) of cervical cancers. This is illustrated by the area between the curves for “no vaccination” and for the base-case in Figure 2. With the most optimistic scenario of lifelong protection, up to 50 percent or 256 cases (95 percent CrI, 140–347 cases) of cancers would be avoided. HPV vaccination of 16-year-old girls would reduce the number of cervical cancers with 16 percent or 84 cases (95 percent CrI, 21–154 cases), under base-case assumptions.
The individual lifetime risk of cervical cancer for vaccinated and unvaccinated, and subsequently screened and unscreened girls as derived from our model are shown in Table 1. For an unvaccinated and unscreened woman, the lifetime risk for cervical cancer is 1 in 28. Vaccination alone, assuming lifelong protection against HPV, reduces this risk (1 in 70), but not as effectively as adequate screening without vaccination (1 in 217). The most effective strategy for reducing the cervical cancer risk is optimal screening combined with vaccination.
Table 1. Lifetime Risk of Cervical Cancer for Young Girls in Different Scenarios

Base-Case Cost-Effectiveness
In the base-case scenario, HPV vaccination results in a discounted gain of 3.2 days (95 percent CrI, 1.4–5.0 days) and 5.0 quality-adjusted days (95 percent CrI, 2.2–8.1 days) per 12-year-old girl. The additional costs of vaccination are only partly compensated by the reductions in screening-induced costs and CIN2+ and cervical cancer treatment costs. HPV vaccination above the 3-yearly screening results in a net total direct medical cost of €397 per person (95 percent CrI, €383–€410) and the incremental cost-effectiveness ratios (ICERs) are estimated at €32,665 (95 percent CrI, €17,447–€68,078) per QALY gained and €51,256 (95 percent CrI, €28,208–€103,147) per LYG (Table 2).
Table 2. Lifetime Discounted Incremental Health and Economic Outcomes (Mean and 95% Credibility Interval) of HPV Vaccination versus Screening Alone, Expressed per Individual (Costs in Euro 2006)

LY, life-year; QALY, quality-adjusted life-year; HPV, human papillomavirus.
Alternative Vaccination Scenarios and Impact of Reduced Screening Coverage after Vaccination
The scenario with assumed lifelong vaccine protection is the most clinically favorable and cost-effective, with an incremental cost of €14,382 (95 percent CrI, €9,238–€25,644) per QALY gained.
Vaccination of 16-year-old girls is associated with a cost of €45,020 (95 percent CrI, €19,601–€138,434) per QALY gained under base-case assumptions.
If HPV vaccination has a deleterious effect on screening compliance (screening coverage equivalent set a 59 percent instead of 79.1 percent), HPV vaccination costs more than screening alone and results in a loss of QALYs and LYG (Table 2). It is further expected to cause an increase in the number of cervical cancer cases (plus 149 cases, 18–256) and deaths (plus 45 deaths, 11–74). A threshold analysis showed that if screening coverage was reduced by more than 10 percent of its prevaccination level, no cases of cervical cancer would be avoided and costs would nevertheless be higher for the vaccination strategy than for the current screening strategy in the base-case. The corresponding threshold screening coverage equivalent, assuming vaccine lifelong immunity, was estimated at 49 percent.
Impact of the Discount Rates, the Model Time Frame, and the Vaccine Price
With the cost of HPV vaccination being incurred in the short term, the ICERs are rather insensitive to variations in the discount rate for costs. Varying the discount rate for effects, however, has a strong impact on the results, with more favorable (lower) ICERs the lower this discount rate (Table 3). With both costs and effects discounted at a 3 percent, as in some other studies, the base-case ICER becomes €56,149 (95 percent CrI, €31,213–€114,326) per QALY gained.
Table 3. Impact of the Discount Rates on the Base-Case Incremental Cost-Effectiveness Ratios (ICERs) (Costs in Euro 2006)

LY, life-year; QALY, quality-adjusted life-year.
Base-case results are sensitive to variations in the cost of the vaccine. When the vaccine public price is used (€412 for three doses), the ICER is €37,212 per QALY gained and with a price of €172 for three doses (half the base-case price), the ICER is €20,948 per QALY gained.
The benefits of HPV vaccination start many years after the initial vaccination. Using shorter time frames considerably increases the cost per QALY gained: from €45,337 at 50 years to €200,103 at 20 years, under base-case assumptions.
Probabilistic Sensitivity Analysis
From the probabilistic sensitivity analysis, the parameters contributing most to the uncertainty around the base-case ICER are all related to the vaccine effectiveness (i.e., vaccine efficacy in reducing CIN2+ and duration of protection).
The cost-effectiveness acceptability curves for the base-case, lifelong protection and the vaccination of 16-year-old girls scenarios are plotted in Figure 3. The curves represent, for each scenario, the probability that HPV vaccination is cost-effective for various threshold values of the cost per QALY gained. None of the curves cuts the vertical axis, meaning that HPV vaccination is never cost-saving from the perspective of the healthcare payer.

Figure 3. Cost-effectiveness acceptability curves for the base-case, lifelong protection and 16-year-old vaccination scenarios.
DISCUSSION
Given the lack of evidence on long-term end points, we modeled a conservative base-case scenario in terms of reduction in CIN2+ and cervical cancer. In the base-case scenario, using a single booster injection and assuming a limited duration of protection, we found a reduction of 20 percent in cervical cancers at a cost per QALY gained of €32,665. Compared with other economic evaluations of vaccine-preventable diseases performed in Belgium setting, HPV vaccination appears less cost-effective than pneumococcal vaccination (€10,000 per QALY gained (Reference Beutels, Van Damme and Oosterhuis-Kafeja6)) but more cost-effective than rotavirus vaccination (€50,000–€68,000 per QALY gained, depending on the vaccine used) (Reference Bilcke, Beutels and De Smet7).
A more optimistic scenario, that is, lifelong immune protection, resulted in 50 percent of cervical cancers prevented at a lower cost per QALY gained of €14,382. In both cases, the level of cervical cancer screening was assumed to stay at the current level.
Of crucial importance, this study's results highlighted that keeping screening coverage at high levels should remain a major priority if HPV vaccination is initiated, as decreases in screening coverage could not only wipe out the benefits of vaccination but even be detrimental to the population's health by resulting in a mean loss in QALYs and LYG compared with the prevaccination situation. Moreover, it would be a more costly strategy than the currently recommended screening program. An intervention that leads to a worse health state at a higher cost is clearly not worthwhile. Effective strategies to maintain or increase cervical cancer screening are conditio sine qua non for the effectiveness of an HPV vaccination program and monitoring the effectiveness of an HPV vaccination program could best be achieved if there are well-organized combined cervical cancer screening attendance and vaccination registries.
Discounting our base-case scenario with 3 percent for both costs and effects as in other studies (instead of a 1.5 percent discount rate for effects and 3 percent for costs) resulted in an ICER of €56,149 per QALY gained. This is higher than the ICERs reported in literature with the same time horizons and the same (or even lower) assumed protection duration of the vaccine. In North America, HPV vaccination compared with current screening was estimated to vary between €3,400 (Reference Chesson, Ekwueme, Saraiya and Markowitz12) and €22,200 (Reference Sanders and Taira36) (costs in Euro 2006 at purchasing power parity (Reference Thiry, Lambert and Cleemput41)) per QALY gained (Reference Brisson, Van de Velde, De Wals and Boily10;Reference Chesson, Ekwueme, Saraiya and Markowitz12;Reference Sanders and Taira36;40). In Australia, the ICER was recently estimated at €15,390 per QALY gained (Reference Kulasingam, Connelly and Conway26). In Europe, dynamic models report ICERs ranging from €8,687 per LYG in Denmark (16) to €31,500 per QALY gained in Norway (Reference Neilson and Freisleben de Blasio34), when the time horizon of this latter study is extended to lifetime. Results from static models vary between €8,400 and €13,800 per QALY gained in France (Reference Bergeron, Largeron, McAllister, Mathevet and Remy5), and are estimated to reach €24,000 per life-year gained in The Netherlands (Reference Boot, Wallenburg and de Melker8).
The main factor determining this difference is the assumed efficacy of the vaccine in reducing cervical cancers and CIN2+ lesions. Although limited data have been published on the vaccine efficacy in reducing the overall incidence of CIN2+, we decided to use the reported 46 percent (30) decrease for CIN2+ directly in our model, and derived from this number a 60 percent decrease for cervical cancer. By its simplicity, our model presents the advantage of limiting the number of assumptions required through by-passing the HPV-infected state, and of assessing the impact of HPV vaccination on the global incidence of CIN2+ lesions and cervical cancers. Another advantage of this approach is that any potential cross-protection or strain replacement effects are implicitly accounted for. Other studies model the impact of the vaccine on type-specific CIN lesions and cervical cancers through their theoretical impact on HPV infection (Reference Bergeron, Largeron, McAllister, Mathevet and Remy5;Reference Boot, Wallenburg and de Melker8;Reference Brisson, Van de Velde, De Wals and Boily10;16;Reference Elbasha, Dasbach and Insinga18;Reference Goldie, Kohli and Grima22;Reference Kulasingam, Connelly and Conway26;Reference Kulasingam and Myers27;Reference Neilson and Freisleben de Blasio34;Reference Sanders and Taira36;Reference Taira, Neukermans and Sanders40). Our major concern with this approach is that the natural evolution of HPV infection to cervical cancer is poorly understood. Most studies assume a 70 percent reduction in cervical cancer after vaccination, which is the proportion of cervical cancer samples testing positive for at least genotype 16 and/or 18 (Reference Munoz, Bosch and Castellsague31). Using a sensitive genotyping method, other high-risk genotypes are detected together with type 16 and/or 18 in approximately 10 percent of the samples (Reference Sigurdsson, Taddeo and Benediktsdottir37). Approximately 60 percent of the cancer samples are thus positive for HPV types 16/18 only, and more likely preventable by current vaccines.
Inevitably, our model has limitations. Our model is static, which prevents us from addressing population-related issues such as universal (i.e., girls and boys) HPV vaccination or concurrent catch-up vaccination since herd immunity effects are ignored. With high vaccination coverage for girls, however, the anticipated effect of herd immunity becomes limited (Reference Brisson and Edmunds9;Reference Taira, Neukermans and Sanders40). We did not model the impact of the vaccine on genital warts and other HPV-related cancers, the reduction in conizations in case of CIN2+ lesions in younger women (<25 years) or the reduction of possible treatments for CIN1 and pregnancy complications after CIN treatment. In addition, the administrative costs associated with the vaccination campaign (invitation or recall letter. . .) have not been accounted for.
In conclusion, the level of screening after vaccination is a major determinant for the clinical and economic outcomes of an HPV vaccination program compared with screening only. Therefore, with the main aim to avoid potential detrimental health consequences, an HPV vaccination program using the currently available vaccines should only be considered if the level of screening after vaccination can be maintained. Only continued monitoring of vaccination and screening programs can provide hard evidence upon which the many assumptions current health economic models are based.
CONTACT INFORMATION
Nancy Thiry, MSc (nancy.thiry@kce.fgov.be), Health Economist, Chris De Laet, MD, PhD (chris.delaet@kce.fgov.be), Senior Medical Expert, Frank Hulstaert, MD (frank.hulstaert@kce.fgov.be), Medical Expert, Mattias Neyt, Ph.D (mattias.neyt@kce.fgov.be), Health Economist, Michel Huybrechts, MD (michel.huybrechts@kce.fgov.be), Expert in Economic Analyses, Irina Cleemput, PhD (irina.cleemput@kce.fgov.be), Senior Health Economist, Belgian Health Care Knowledge Centre, Administratief Centrum Kruidtuin, Doorbuilding, 10th Floor, Kruidtuinlaan 55, 1000 Brussels, Belgium


