Type 2 diabetes is one of the diseases most closely related to unhealthy lifestyles, and develops frequently in individuals characterized by the metabolic syndrome (Reference Alberti, Zimmet and Shaw1). The worldwide increase in overweight and obesity, related to inadequate physical activity and unhealthy dietary habits, has led to concerns for a “diabetes epidemic.” This has, however, spurred interest in appropriate treatments for patients with diabetes, and in the possibilities to prevent the onset of diabetes.
Several trials during recent years have investigated the effectiveness and the cost-effectiveness of pharmaceuticals that decrease the glucose levels among high-risk individuals, that is, persons with impaired glucose intolerance or prediabetics, to decrease their risks for diabetes onset (Reference Gillies, Abrams and Lambert15). There are also trials that aimed to decrease the glucose levels among these individuals by nonpharmaceutical methods, that is, by improved diet, exercise, and weight reduction. These trials showed that lifestyle changes among prediabetics was possible; these changes led to decreased body weight and decreased glucose levels; hence, the risks for diabetes were reduced. Economic evaluations indicate that these programs are cost-effective (Reference Herman, Hoerger and Brandle18;Reference Hoerger, Hicks and Sorensen19;Reference Lindgren, Lindström and Tuomilehto22).
To our knowledge, programs that seek to prevent type 2 diabetes “up-stream,” that is, by changing lifestyles in whole populations, have, however, not been previously studied. This study reports a cost-effectiveness analysis on a 10-year community-based diabetes prevention program that aimed to promote lifestyle changes in the general population in three communities in Sweden.
MATERIALS AND METHODS
The Program
Stockholm Diabetes Prevention Program (SDPP) was a community-based program aiming to promote healthy lifestyles to prevent type 2 diabetes. The program was implemented during years 1995 to 2004 in three municipalities (denoted I1, I2, and I3) in the metropolitan area of Stockholm, Sweden. The program organization included a project leader in each of the program municipalities, a central support unit with a coordinator of the local work, and a central as well as local intersectoral steering groups.
The program focused on the preventable risk factors for type 2 diabetes, that is, physical inactivity, poor dietary habits, obesity, and tobacco use, by means of both individual lifestyle and community change. The main strategy was community organization and participation (Reference Bracht, Kingsbury and Bracht8) to develop community relations, and to educate and implement activities with local organizations. These activities sought to increase awareness of the risk factors (e.g., open seminar series and development of municipal public health plans and/or reports) as well as the availability of physical activities (e.g., construction of bicycle lanes and walking straits, and annual folders describing available activities in the municipalities), healthy food (e.g., a competition for the best lunch restaurant regarding nutritional content and a group of seniors advising grocery store customers and employees), a nonsmoking environment (e.g., in restaurants), and professional guidance to loose weight or start exercising (e.g., by means of an early version of exercise on prescription). The organizational structure, selection of strategies, and activities varied between the program municipalities, but networking and partnerships were central in most activities. The program has been described previously (Reference Andersson, Bjärås and Östenson2;Reference Bjärås, Ahlbom and Alvarsson6) and was subjected to extensive implementation evaluations (Reference Andersson, Bjärås, Tillgren and Östenson3;Reference Andersson4;Reference Bauman, Koepsell, Brownson and Pettiti5).
Effectiveness
The program effectiveness was investigated by means of a quasiexperimental cohort design, that is, data on a group of people at baseline and follow-up in the program municipalities and in two control municipalities were compared. The two control municipalities, called C1 and C2, were selected to match the program municipalities based on geographical and demographical characteristics. In the analysis, the two municipalities were merged into one control area.
The data were obtained from an epidemiological study, described in detail elsewhere (Reference Eriksson, Ekbom and Granath12). In the five municipalities, men and women (not men in municipality I1) aged 36–56 years without known diabetes were invited to a health examination; invited were individuals with a family history of diabetes (n = 5,689) together with randomly selected individuals without a family history (n = 5,921). The examination included medical tests and a lifestyle questionnaire, and was repeated after 8 and 10 years. The study group with both baseline and follow-up data, excluding individuals that had migrated from the baseline municipality, comprised 2,149 men and 3,092 women, that is, around 500 men and 600 women from each municipality, 16 percent of the population group.
Changes in three risk factors, that is, blood pressure (systolic), body mass index (BMI), and fasting plasma glucose (FPG), in the program areas during follow-up were compared with changes in similar groups in the control area. To account for different baseline risk factor levels in the groups, the changes were compared in terms of changes in future consequences, that is, in disease-related costs and health effects. Tests of statistical significance of differences over time within study groups were performed with a paired t-test and differences between groups with a parametric analysis of variance, in SAS version 9.2 (SAS Institute, Inc).
Cost-effectiveness Analysis
The economic evaluation was an incremental cost-effectiveness analysis with health effects measured as QALYs (quality-adjusted life-years) in a societal perspective, thus conforming to recommendations (Reference Gold, Siegel, Russell and Weinstein16;21). The comparison alternative was standard care, assumed to be represented by the development in the control area. Costs and health effects were discounted at 3 percent annually, and costs were presented as SEK (Swedish krona) in year 2004 (1 Euro = SEK9.13, 1 US$ = SEK7.35), converted by the Swedish consumer price index and the official rate of exchange. The study was approved by the regional ethics committee in Stockholm.
Program Costs
The societal costs of the program were collected retrospectively, during the last year of the program period, by use of the extensive project documentation and interviews with selected key collaborators (33 persons). The resulting cost estimates have been reported in detail (Reference Eriksson and Johansson13).
The program received project funds from the regional healthcare authority, Stockholm County Council, supplemented with funds from the local authorities in the program municipalities as well as resources committed by local collaborators and the target group, that is, the inhabitants in the areas. The time costs for employees were valued in six wage categories, ranging from SEK153 to 407 per hour including wage taxes of 40 percent. Time spent by unsalaried volunteers was valued at the average Swedish wage of SEK121 per hour, while 35 percent of that wage, SEK42 per hour, was used for time spent by participants in the target group. The value of other resources was taken from the project accounts, if paid by project funds, or from standards, such as for example, SEK200 for a meeting room. The 10-year costs were discounted 3 percent annually to a common price year.
However, the large number of activities within the program during the 10-year period inhibited a complete cost calculation, so the full resource consumption was sought only for the more extensive activities. The program costs were, therefore, underestimated. This was considered in a sensitivity analysis that tripled the program costs.
Markov Model
To estimate the future societal disease-related costs and health effects due to the risk factor levels in the groups, a Markov model adapted to Swedish circumstances was used. The model was constructed to reflect the metabolic syndrome, which is a combination of biological risk factors related to lifestyles such as physical activity and dietary habits, the lifestyles most affected by program activities. The metabolic syndrome risk factors, that is, obesity, blood pressure, serum lipids, and glucose levels, affect the risk of cardiovascular disease and diabetes (Reference Alberti, Zimmet and Shaw1). The model is fully described in a technical report (Reference Feldman, Lund and Johansson14), which details all data sources and assumptions, and discusses model uncertainty and validity.
The model was inspired by a previous metabolic syndrome model (Reference Caro, O'Brien and Hollenbeak10). The present model included coronary heart disease (CHD), divided into acute myocardial infarction, ischemic heart disease, congestive heart failure, and sudden death, as well as stroke, based on the risk estimates from the Framingham study. The risk of diabetes (only type 2) was taken from the U.S. San Antonio study, while the risks of diabetes-related complications were obtained from the British UKPDS. A sensitivity analysis included alternative Swedish disease risks. The diabetes-related complications were divided into macrovascular complications, which includes inter alia CHD and stroke, or microvascular complications or both, using the same definitions as the European CODE-2 study. Mortality risks were taken from Swedish registers, and included both disease-related mortality as well as unrelated mortality.
All societal disease-related costs, if available, were taken from previous Swedish studies, apart from the medical treatment costs. These were taken from the Stockholm County healthcare databases, which records all medical consumption for the inhabitants (1.9 million in 2004) along with diagnosis-related group-based costs for all in- and outpatient care, supplemented with Swedish standard costs for some primary care; see Feldman et al. (Reference Feldman, Lund and Johansson14) for details. The health-related quality-of-life (QoL) weights, to calculate QALYs, were taken from a Swedish study on the average age- and gender-specific QoL, combined with two studies on disease-specific decrements in QoL. The study on the QoL of diabetes patients reported no QoL effect from diabetes without complications, which seemed implausible and why an alternative valuation was used in a sensitivity analysis. All QoL-weights were obtained with the EQ-5D instrument.
The model was run as a Monte Carlo simulation, with 10,000 repetitions (interpreted as individuals). The model covers adults, with the termination age set at 85 years, after which no further health effects or costs are accumulated. Transitions between health states could occur once a year. The model was programmed in DATA Pro Health Care (Treeage Software Inc).
The model simulations were based on average levels of blood pressure, BMI, and FPG among men and women, respectively, in the program and control municipalities at baseline and follow-up. To purge the estimates of age effects, the average age at follow-up in the groups was used as the starting age. The use of average group data entails that the comparison between baseline and follow-up might be regarded as a comparison of the same individual, who experienced two different risk factor levels until age 85 years. In a sensitivity analysis, the average levels were replaced with the actual patient data. No data on cholesterol levels were available, which is why a low risk value was used; 4 mmol/L for total serum cholesterol and 1.5 mmol/L for high density lipoprotein-cholesterol, which leads to an underestimated disease risk.
Sensitivity Analyses
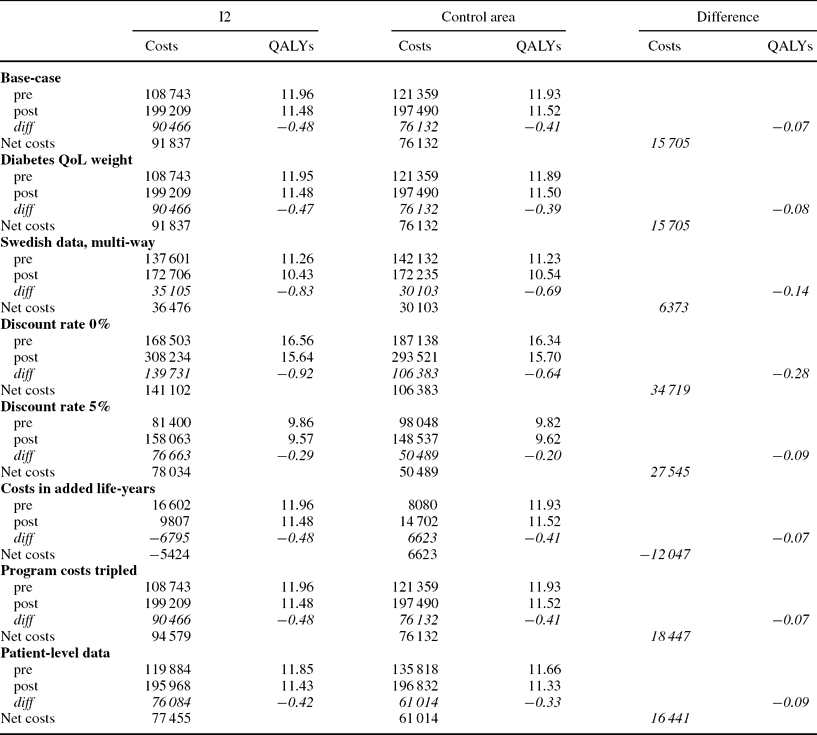
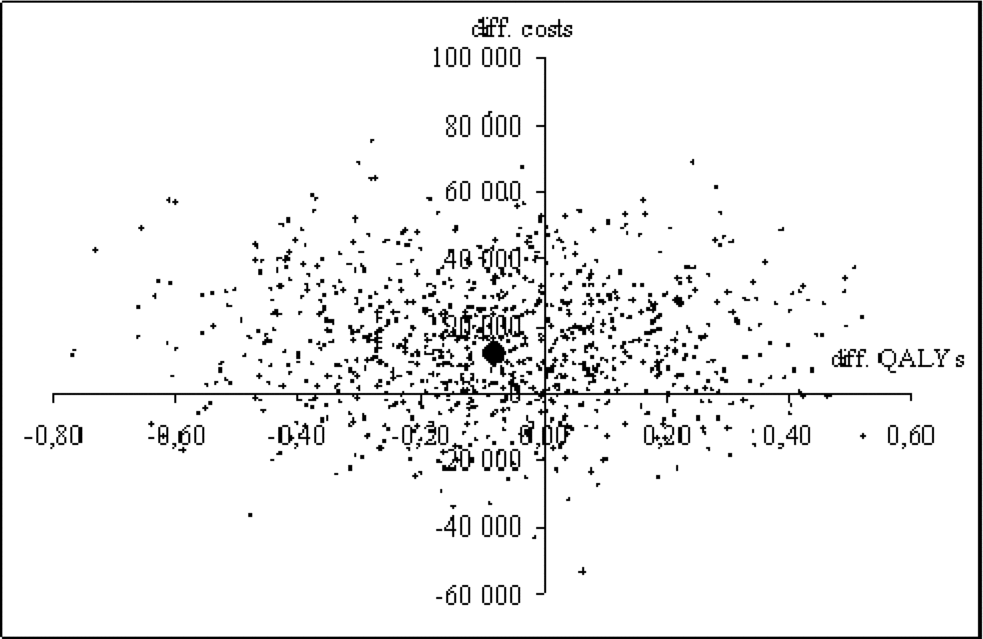
Changes in model parameters led to changed model estimates, reported in the model technical report (Reference Feldman, Lund and Johansson14). Here, sensitivity analyses were performed on men from I2 and the control area, to investigate whether any alternative data or methodology would change the base-case result on differences in costs and QALYs between the two groups. A one-way parameter sensitivity analysis incorporated a decrement in QoL of 0.02 for diabetes without complications, while a multi-way analysis investigated the effects of only including previously published Swedish data, as well as the risks of diabetes from the SDPP cohort study (unpublished data, A. Hilding, Karolinska Institutet, 2008). Another set of analyses investigated methodological aspects such as the inclusion of costs in added life-years (21) and alternative discount rates (0 and 5 percent). The program analyses included a threefold increase of the program costs and model simulations using the patient data, stochastically chosen, instead of average risk factor levels. Finally, a probabilistic sensitivity analysis with bootstraps of 1,000 replicates performed 1,000 times from the 10,000 Monte Carlo model simulations on men in I2 and the control area was reported on the cost-effectiveness plane (Reference Briggs, Drummond and McGuire9).
RESULTS
Program Costs
The total societal program costs during 10 years amounted to SEK36.2 million. The largest contribution came from the Stockholm County Council, with costs of nearly SEK28 million. Other contributors were the municipal authorities, with costs of around SEK3.3 million, closely followed by the target groups' expenses and time spent, valued at 2.9 million. Remaining costs were paid by voluntary organizations, private businesses, and other organizations.
The largest share of total costs financed the central unit, SEK14.5 million, while the program municipalities accrued costs of SEK8.5 million (I1), SEK7.8 million (I2), and SEK5.3 million (I3). The costs per inhabitant in the target ages 45–64 years, after dividing the central unit costs evenly among the program municipalities, amounted to about SEK1,350 each in I1 and I2, and to SEK1,100 in I3.
Effectiveness and Model Estimates
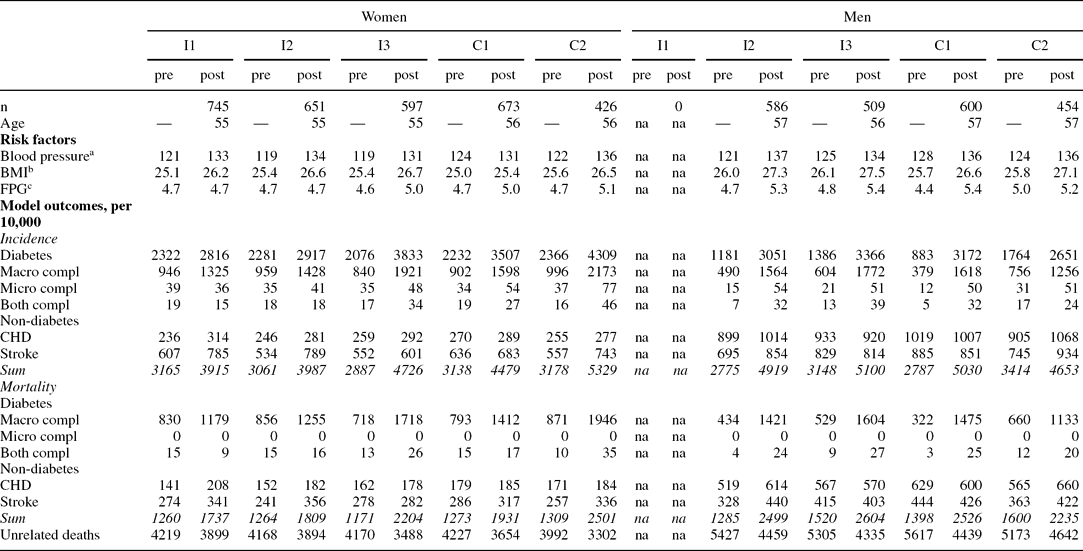
The effect evaluation result in terms of average risk factor levels in the program and control municipalities before (pre) and after (post) the program is reported in Table 1. Because the individuals are 8–10 years older at follow-up, it is unrealistic to presume that the program would have led to decreased risk factor levels; instead a low increase in levels would indicate that the program had had effect.
Table 1. Average Risk Factor Levels and Model Disease and Mortality Estimates Until Age 85 Years, by Municipality
aSystolic blood pressure (mm Hg).
bBody mass index (kilogram/m2).
cFasting plasma glucose (mmol/L).
BMI, body mass index; FPG, fasting plasma glucose; CHD, coronary heart disease; na, not available; –, not applicable.
In all areas for both genders, the average risk factor levels increased statistically significant, with the exception of fasting glucose levels (FPG) among women in I1 and I2. The changes in FPG were significantly lower in these two female groups in comparison with both controls. Among men, the increases in FPG were statistically significant lower in both program groups versus one of the control municipalities, C1. Thus, regarding FPG, positive effects are observed in all program groups except women in I3. There were also some statistically significant higher increases in risk factor levels in the program groups compared with the controls.
Higher risk factor levels led to increased absolute risks for diabetes and cardiovascular disease incidence and mortality. The increase was most pronounced for diabetes, also leading to higher incidence and mortality from the diabetes-related complications, in particular the macrovascular. With the postprogram risk factor levels, around 40–50 percent of the individuals would contract a metabolic syndrome disease according to the model, and 20–25 percent were expected to die in the diseases before the age of 85 years.
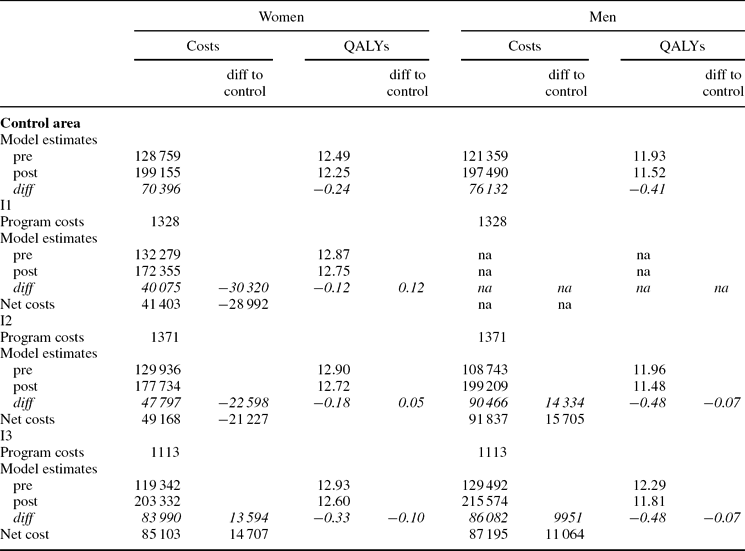
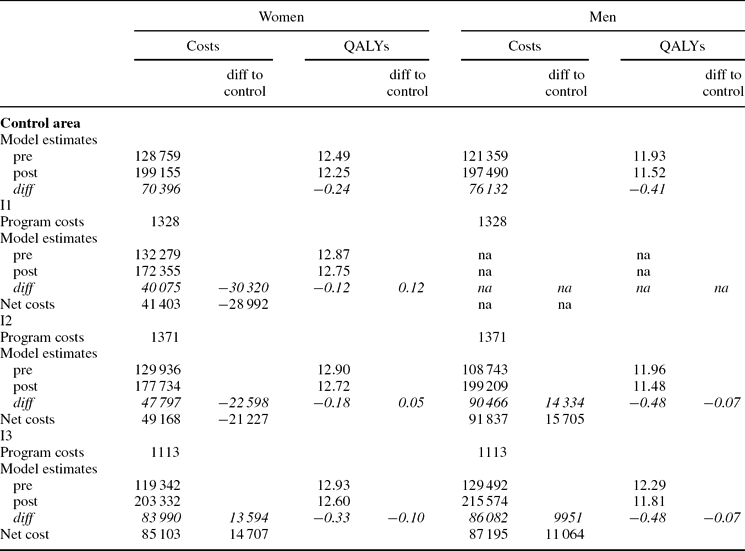
The increased disease incidence and mortality leads to increased societal costs and to losses in QALYs; see Table 2. In the preprogram period, the model estimated societal costs amounted to around SEK120,000–130,000 for the women and 110,000–130,000 for the men in the program municipalities, with estimated QALYs until age 85 years of around 13 and 12, respectively. In the postprogram period, the increased risk factor levels markedly increased the societal costs, with between SEK40,000 and 90,000 per individual, and the losses in health, between 0.12 and 0.33 QALYs per women and around half a QALY for males in the program municipalities.
Table 2. Program Costs, Model Estimates on Societal Costs and QALYs per Cohort Individual Until Age 85 Years, and Differences Between Control Area (Municipalities C1 and C2 Combined) and Program Municipalities
Note. Costs in SEK 2004.
QALYs, quality-adjusted life-years; na, not available
The development in the control area, that is, the two merged control municipalities, was similar as in the program municipalities. Increased average risk factor levels were estimated to lead to increased societal costs of around SEK70,000 for both men and women and to losses in health of 0.24 and 0.41 QALYs, respectively.
Cost-effectiveness Analysis
In the cost-effectiveness analysis, smaller increases in costs and smaller decreases in QALYs in the program areas versus the control area would be interpreted as positive effects from the program. Among the women, the cost increases were lower in I1 and I2, but higher in I3, compared with the control area. The QALY losses were also lower in I1 and I2 (0.12 and 0.18 versus 0.24 in the control area), but higher in I3. Among women, the program was thus estimated to lead to net cost-savings, that is, also including the program costs, and to health increases for two municipalities, I1 and I2. Among men in both program municipalities and among women in I3, the net costs were larger (with SEK10,000–15,000) and the QALY losses were higher (0.07 QALYs per individual among the men and 0.10 QALYs among the women in I3) than in the control area, and thus not cost-effective. The program costs, calculated per inhabitant in the age group covered by the effect evaluation, played no role in the cost-effectiveness analysis, as they were so low in comparison with the estimated disease-related costs per individual.
Sensitivity Analyses
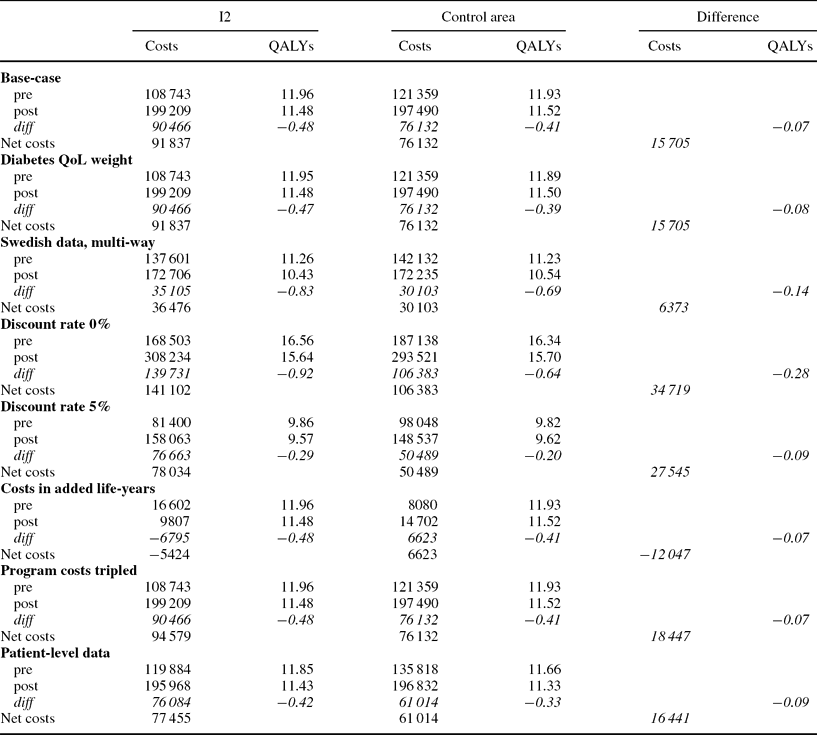
Across the sensitivity analyses, the cost increases and QALY losses for the men in I2 versus the control area men remained similar, apart from the inclusion of costs in added life-years that resulted in cost-savings in I2, see Table 3. The base-case result was thus not sensitive to alternative data and methodology. However, the probabilistic sensitivity analysis, in Figure 1, revealed considerable uncertainty in the QALY differences, with bootstrap estimates scattered over the cost-effectiveness plane, although cost-savings for men in I2 in comparison with the control area seem implausible.
Table 3. Sensitivity Analysis, Men in I2 and Control Area
Note. Costs in SEK 2004.
QALY, quality-adjusted life-year; QoL, quality of life.
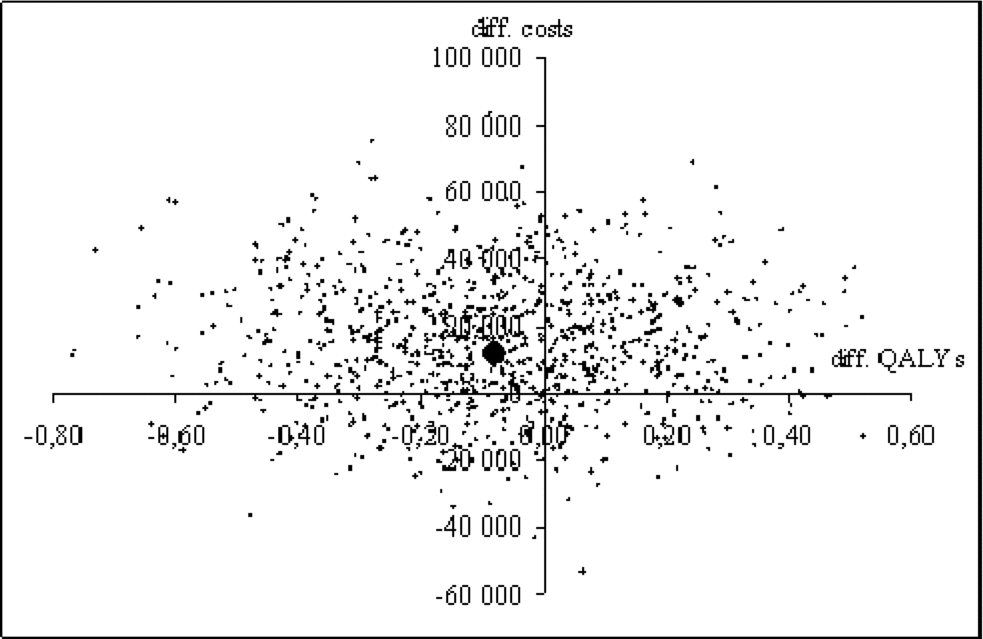
Figure 1. Probabilistic sensitivity analysis on the difference in costs (SEK 2004) and quality-adjusted life-years between men in I2 and control area (large dot denotes base case difference).
DISCUSSION
No firm conclusions can be drawn from this economic evaluation. The program appears to have saved societal costs and increased health among women in two program areas (I1 and I2) in comparison with the control group, but in the three other study groups the changes in costs and QALYs during follow-up are more unfavorable than in the control group.
The conflicting result might be due to different program effectiveness in the municipalities, that is, that the program did not succeed in all municipalities. It might, however, also depend on the design of the effect evaluation, that is, that we were unable to appropriately measure the effects. Yet another explanation might be the methodology of the economic evaluation, in particular whether all effects from the program were included in the analysis.
Although the program in the three municipalities shared objectives and theoretical basis (Reference Bjärås, Ahlbom and Alvarsson6), the actual program implementation differed (Reference Andersson4). The work was less intensive in I3, which was reflected in the lower program costs from the area. Differences in implementation over the municipalities might thus explain the result. It is also possible that the program activities were more suited to women, as there were no beneficial effects among the two male study groups.
The design of the effect evaluation sought to imitate the methods of many pharmaceutical trials; average changes in risk factor levels during follow-up in intervention and control groups were compared. As randomization of individuals into groups is difficult to achieve in community programs, a nonrandomized design, that is, quasiexperimental, is recommended for these program (Reference Bauman, Koepsell, Brownson and Pettiti5). In these designs, changes attributable to the intervention depend on changes in the control groups. It explicitly assumes that the many measures and circumstances that affect individuals' living conditions and subsequent risk factor levels, such as medication and working conditions, were similar across all areas, and, therefore, disappear with the comparison.
However, if there was a strong secular trend and/or similar interventions were implemented in the control areas, the effects from the programs might be difficult to discern (Reference Bauman, Koepsell, Brownson and Pettiti5). In fact, there had been similar interventions in the control municipalities, for example, promotion of physical activity followed by an obesity program in C2, and both control municipalities had employed health planners, with similar tasks as the SDPP local project leaders (Reference Andersson4). The effects from the measures taken within the program might thus have been underestimated.
The epidemiological study only covered individuals aged 36–56 years at baseline. Few of the program activities were, however, directed to specific individuals, but sought to enable healthy choices in the whole population. Effects on other age groups were, however, not taken into account in the evaluation. The follow-up period of the study was 8–10 years, which might be too short to fully reflect risk factor changes following changes in lifestyles.
In programs that seek to promote healthy lifestyles there is a long chain of events from the program activities to changes in individual lifetime societal costs and QALYs. Most of these events are not included in economic evaluations, even though they have been termed “valued outcomes” (Reference Johansson20;Reference Nutbeam24) in the health promotion field. This program's activities mainly consisted of structural long-term work to create supportive environments to enable individuals to make healthy choices. These activities are themselves deemed valuable by health promoters, as they lead to a more knowledgeable population and social action. If individuals do change lifestyles several effects ensue, some of which might affect individual utility and societal welfare directly. For example, increased physical activity such as bicycling might result pleasant for the individual, and also alleviate traffic congestion. This individual process utility and these societal externalities are not included in the economic evaluation.
The economic evaluation is solely based on changes in three biological risk factors in a certain group of people during a rather short follow-up period. The Markov model that estimates costs and health effects, furthermore, only includes the metabolic syndrome diseases, that is, diabetes, CHD, and stroke. Even though the economic evaluation took into account diseases not specifically addressed by the program, physical activity and other lifestyle factors affect even more diseases. There are two Danish studies that relate disease and disease-related costs and health effects to physical activity (Reference Sörensen, Horsted and Andersen25) and to intake of fruit and vegetables (Reference Gundgaard, Nielsen, Olsen and Sörensen17), but as the program sought to affect both aspects, we preferred to build a model that could take into account some effects from both lifestyles.
However, economic evaluations based on model estimates raise uncertainty and validity issues (Reference Briggs, Drummond and McGuire9), but the model seems to reflect Swedish disease patterns (Reference Feldman, Lund and Johansson14). The costs and QALY estimates are difficult to validate, as it is the first Swedish model on the metabolic syndrome, to our knowledge. The model sensitivity analyses confirmed the base-case result for men in I2, regardless of selected model data and modeling methodology, even though some uncertainty surrounding the health effects were revealed in the probabilistic sensitivity analysis.
This economic evaluation of a health promotion program sought to follow the methodology recommended within medicine (Reference Gold, Siegel, Russell and Weinstein16;21), which is most frequently used for pharmaceuticals and surgical procedures (Reference Neumann, Rosen and Greenberg23). Several potentially important effects from the program are, however, difficult to accommodate within this methodology (Reference Borghi and Jan7;Reference Drummond, Weatherly and Claxton11), suggesting that several aspects that might affect decision making on similar programs were not taken into account. Other methodologies, such as the cost-benefit analysis, might better reflect the societal value of similar programs.
CONCLUSION
The study showed conflicting results regarding the cost-effectiveness of the program. Still, community-based programs that seek to promote healthy lifestyles to prevent prediabetes and diabetes might be cost-effective, as evidenced by the result from two study groups. Several potentially valuable aspects of the program are not included in the cost-effectiveness analysis, so the societal value of the program might not be adequately reflected.
CONTACT INFORMATION
Pia Johansson, PhD (pia.johansson@ki.se), MMC, LIME, Claes-Göran Östenson, MD, PhD (claes-goran.ostenson@ki.se), Endocrine and Diabetes Unit, Karolinska University Hospital; Professor, Department of Molecular Medicine and Surgery, Agneta Hilding, LIC (agneta.hilding@ki.se), Endocrine and Diabetes Unit, Karolinska University Hospital; Statistician, Department of Molecular Medicine and Surgery, Camilla Andersson, PhD (camilla.andersson@haninge.se), Project Leader, Nestor FoU-Center, Haninge Kommun; Public Health Sciences, Clas Rehnberg, PhD (clas.rehnberg@ki.se), Associate Professor, MMC, LIME, Per Tillgren, PhD (per.tillgren@mdh.se), Professor, School of Health, Care & Social Welfare, Mälardalen University; Professor, Department of Public Health Sciences, Karolinska Institute, Nobels väg 15A, 171 77 Stockholm, Sweden


