


Crossref Citations
This article has been cited by the following publications. This list is generated based on data provided by Crossref.
Szőcs, Ildikó
Dobi, Balázs
Lám, Judit
Orbán-Kis, Károly
Häkkinen, Unto
Belicza, Éva
Bereczki, Dániel
Vastagh, Ildikó
and
Gall, Seana
2020.
Health related quality of life and satisfaction with care of stroke patients in Budapest: A substudy of the EuroHOPE project.
PLOS ONE,
Vol. 15,
Issue. 10,
p.
e0241059.
Dewitt, Barry
and
Torrance, George W.
2020.
Incorporating Mortality in Health Utility Measures.
Medical Decision Making,
Vol. 40,
Issue. 7,
p.
862.
Poder, Thomas G.
Guertin, Jason R.
Touré, Moustapha
Pratte, Gabrielle
Gauvin, Cheyenne
Feeny, David
Furlong, William
and
Camden, Chantal
2021.
Canadian French translation and linguistic validation of the health-related quality of life utility measure for pre-school children.
Expert Review of Pharmacoeconomics & Outcomes Research,
Vol. 21,
Issue. 6,
p.
1195.
Touré, Moustapha
Kouakou, Christian R. C.
and
Poder, Thomas G.
2021.
Dimensions Used in Instruments for QALY Calculation: A Systematic Review.
International Journal of Environmental Research and Public Health,
Vol. 18,
Issue. 9,
p.
4428.
Tremblay, Dominique
Touati, Nassera
Kilpatrick, Kelley
Durand, Marie-José
Turcotte, Annie
Prady, Catherine
Poder, Thomas G.
Richard, Patrick O.
Soldera, Sara
Berbiche, Djamal
Généreux, Mélissa
Roy, Mathieu
Laflamme, Brigitte
Lessard, Sylvie
Landry, Marjolaine
Giordano, Émilie
and
Clemence, Marianne
2022.
Building resilience in oncology teams: Protocol for a realist evaluation of multiple cases.
PLOS ONE,
Vol. 17,
Issue. 5,
p.
e0268393.
Pan, Tianxin
Mulhern, Brendan
Viney, Rosalie
Norman, Richard
Hanmer, Janel
and
Devlin, Nancy
2022.
A Comparison of PROPr and EQ-5D-5L Value Sets.
PharmacoEconomics,
Vol. 40,
Issue. 3,
p.
297.
Klapproth, Christoph Paul
Fischer, Felix
Rose, Matthias
and
Karsten, Maria Margarete
2022.
Health state utility differed systematically in breast cancer patients between the EORTC QLU-C10D and the PROMIS Preference Score.
Journal of Clinical Epidemiology,
Vol. 152,
Issue. ,
p.
101.
Klapproth, Christoph Paul
Fischer, Felix
and
Rose, Matthias
2023.
Scale agreement, ceiling and floor effects, construct validity, and relative efficiency of the PROPr and EQ-5D-3L in low back pain patients.
Health and Quality of Life Outcomes,
Vol. 21,
Issue. 1,
King, Madeleine T.
Revicki, D. A.
Norman, R.
Müller, F.
Viney, R.C.
Pickard, A. S.
Cella, D.
Shaw, J. W.
Aaronson, Neil
Brazier, John
Cella, David
Costa, Daniel
Fayers, Peter
Grimison, Peter
Janda, Monika
Kemmler, Georg
King, Madeleine T.
Luo, Nan
McTaggart-Cowan, Helen
Mercieca-Bebber, Rebecca
Norman, Richard
Revicki, Dennis
Peacock, Stuart
Pickard, Simon
Rowen, Donna
Velikova, Galina
Viney, Rosalie
Street, Deborah
Young, Tracey
and
Tait, Margaret-Ann
2024.
United States Value Set for the Functional Assessment of Cancer Therapy-General Eight Dimensions (FACT-8D), a Cancer-Specific Preference-Based Quality of Life Instrument.
PharmacoEconomics - Open,
Vol. 8,
Issue. 1,
p.
49.
The key message of this Commentary is a recommendation that studies should use two or more generic preference-based (GPB) measures. This Commentary is aimed at investigators who design, execute, report, and interpret health technology assessments (HTA) and economic evaluations of healthcare technologies. This Commentary is also aimed at the policy makers who use evidence from HTA studies in decision making. Standardizing on a single GPB across studies is attractive because it seemingly enhances comparability of results. However, there is no gold standard GPB measure. Because a GPB measure may not be responsive in a particular context, relying on a single GPB can be perilous. Within studies, a single GPB measure provides an estimate of effectiveness that is precise but of unknown accuracy. Using more than one measure provides important additional information on accuracy, and contributes to the rapid accumulation of evidence on the contexts in which particular measures perform well and situations in which they do not. Additional rationales are outlined below.
Background
Establishing confidence in a result often demands more than one criterion. GPB measures generate overall summary scores that are widely used to estimate health outcomes in clinical trials and observational studies; see, for instance, Feeny and colleagues (Reference Feeny, Wu and Eng1). GPB measures are also used in clinical practice for quality improvement and to assist in the management of individual patients; see, for instance, Santana and colleagues (Reference Santana, Feeny and Johnson2). In addition, GPB measures are included in population health surveys; see for instance, Fryback and colleagues (Reference Fryback, Dunham and Palta3).
A major use of GPB measures is in economic evaluation: cost-effectiveness and cost-utility analyses (CEA, CUA). CEA and CUA are important components of HTA. Evidence from CEA/CUA studies often plays an important role in decision making about the adoption and usage of healthcare technologies. Indeed, CUA submissions are required by agencies in several countries, including England (4), Canada (5), Australia (6;Reference Henry7), and Japan (Reference Shiroiwa, Fukuda, Ikeda, Takura and Moriwaki8). The measure of health effects favored by each of these agencies is the quality-adjusted life-year, the QALY. QALYs combine the effects of an intervention on mortality and morbidity and are estimated by multiplying the utility score for a health state, its desirability in terms of health-related quality of life (HRQL), by the duration of that health state.
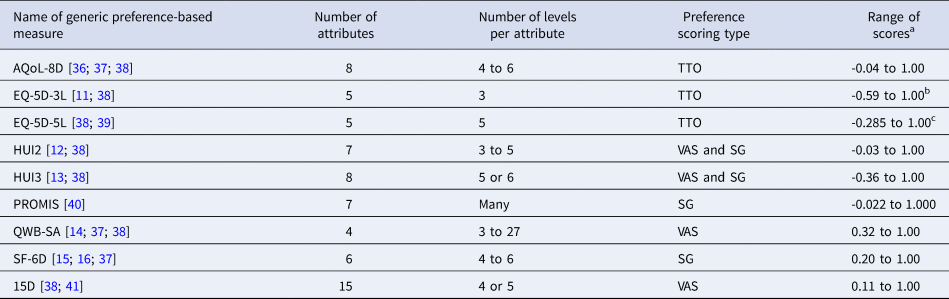
Each of these HTA agencies recommends the use of generic preference-based (GPB) measures as the source of utility scores for computing QALYs. The Canadian Agency for Drugs and Technologies in Health (CADTH) and the Pharmaceutical Benefits Advisory Committee (PBAC) in Australia recommend the use of GPB measures but do not identify a particular preferred GPB measure. Similarly, the 2nd Panel on Cost Effectiveness in Health and Medicine endorses the use of GPB for the reference case analyses (Reference Neumann, Sanders, Russell, Siegel and Ganiats9;Reference Feeny, Krahn, Prosser, Salomon, Neumann, Sanders, Russell, Siegel and Ganiats10) The EQ-5D is preferred by The National Institute for Health and Care Excellence (NICE) (4, p 39). Examples of widely used GPB measures are EQ-5D (Reference Rabin and de Charro11), Health Utilities Index (HUI) Mark 2 (HUI2) and HUI Mark 3 (HUI3) (Reference Torrance, Feeny and Furlong12;Reference Furlong, Feeny, Torrance and Barr13), the Quality of Well Being Scale (QWB) (Reference Kaplan, Anderson and Spilker14), and the Short-Form 6D (SF-6D) (Reference Brazier, Roberts and Deverill15;Reference Brazier and Roberts16). Table 1 provides a brief summary of the characteristics of nine prominent GPB measures.
Table 1. Brief Descriptions of Nine Prominent Generic Preference-Based Measures
Notes.
aThe range of scores reports the minimum and maximum scores generated by the measure on a scale in which the score for dead = 0.00 and the score for perfect/full health = 1.00.
bUnited Kingdom.
cEngland.
GPB measures are favored for numerous reasons including their broad coverage of components of physical and mental health, capturing comorbidity and unintended effects of interventions; being brief with little burden on respondents and research staff; being applicable across a wide variety of diseases and conditions, allowing for comparisons of the comprehensive burdens of disease and effects of interventions across conditions; and using scoring systems based on community preferences. GPB measures are also highly relevant for investigators when selecting a health-related quality of life (HRQL) outcome measure even if they do not contemplate doing a CEA or CUA.
All major GPB measures produce scores on the standard health scale where dead has a score of zero and perfect/full health as a score of one. Despite this, it is widely understood that scores from different major GPB measures are often not interchangeable (Reference Gamst-Klaussen, Chen, Lamu and Olsen17;Reference Chen, Khan, Iezzi, Ratcliffe and Richardson18). Gamst-Klaussen and colleagues (Reference Gamst-Klaussen, Chen, Lamu and Olsen17) review important reasons for this, including the attributes (dimensions, domains) of health status included in the measure, different methods for obtaining preference scores with which to estimate multi-attribute utility (scoring) functions, and the choice of different functional forms and estimation methods for creating scoring functions. Gamst-Klaussen and colleagues discuss various “mapping” or “cross-walk” approaches that provide evidence of relationships between scores from different GPB measures and the importance of head-to-head comparisons of instruments. While the mapping and cross-walk approaches focus on the relationships among measures and how to attempt to make scores from different measures more commensurate, the head-to-head comparisons approach is more inductive. In particular, focusing on longitudinal studies, this Commentary investigates whether measures perform well, or not, depending upon clinical context or population. Are major GPB measures equally responsive? Does responsiveness vary among measures within contexts? Should investigators rely on a single GPB measure for primary data collection in longitudinal studies? Below we provide a non-systematic review of several longitudinal head-to-head comparison studies that used two or more GPB measures and thus provide important illustrative information on the performance of GPB measures in a wide variety of clinical areas and contexts. Another criteria influencing the choice of case studies for review is the inclusion of health conditions and diseases that affect a wide range of attributes with varying degrees of severity. The illustrative studies are not intended to represent the universe of published results or be a random selection of such results. It should be noted that, given that the authors of the Commentary are among the developers of the HUI2 and HUI3, there is a tendency to focus on head-to-head studies that included HUI.
A Brief Primer on Measurement Properties
Context specific evidence on measurement properties is a key criterion that should influence the choices of GPB measures for a HTA study (Reference Fayers and Machin19;Reference Feeny, Eckstrom, Whitlock and Perdue20). Because many HTA studies extract GPB measure scores from the existing literature, evidence on cross-sectional construct validity of the GPB measure in that context is important. Does the measure capture the construct that it is supposed to capture? Does it distinguish among known groups? Does it identify the level of severity? For clinical trials and other longitudinal studies, there is an additional a key criterion: responsiveness (or longitudinal construct validity). Does the measure capture meaningful change when it occurs?
In a particular context a GPB measure may not be responsive because it omits an attribute for which there is important change in the context, it is subject to floor or ceiling effects, the responsiveness of a measure is attenuated due to the limited number of intermediate levels within its attributes, or other measurement issues. Floor effects occur when the range of a measure is insufficient for capturing higher degrees of impairment. Ceiling effects occur when the range of the measure is insufficient for capturing lower degrees of impairment. Examples discussed below illustrate the importance of these (and other) criteria.
Effectiveness in CEA/CUA is assessed by estimating the effects of the intervention both on the HRQL and longevity of those affected by the intervention. We define effectiveness with respect to assessing the effects on HRQL as follows. An intervention is deemed to be effective if it produces a clinically important difference (CID) in HRQL relative to its comparator. The concepts of CID, that is, minimal CID, patient-important difference, and the methods for developing empirical guidance on the threshold for CID, are discussed in Guyatt and colleagues (Reference Guyatt, Osoba, Wu, Wyrwich and Norman21) and Schünemann and Guyatt (Reference Schünemann and Guyatt22). An important component of this approach is that for the change to be important it must be both noticeable and important to patients, a patient-centric viewpoint.
Examples of Contributions by Studies That Use Multiple GPB Measures
Lack of Interchangeability
An example of studies using more than one GPB measure is found in two papers by Marra and colleagues (Reference Marra, Woolcott and Kopec23;Reference Marra, Rashidi and Guy24). A study of 313 rheumatoid arthritis (RA) patients being treated by one of eight rheumatologists examined the construct validity, reliability and responsiveness of four major GPB measures: EQ-5D-3L, HUI2, HUI3, and SF-6D. Numerous disease-specific measures were also used (Reference Marra, Woolcott and Kopec23). The authors note that overall scores differed substantially among the GPB measures, lack of interchangeability, and conclude that “each of the instruments were well-accepted, the overall scores are all able to distinguish between groups defined by measures of RA severity” (Reference Marra, Woolcott and Kopec23, pp 1580–1581).
The longitudinal component of the study by Marra and colleagues (Reference Marra, Rashidi and Guy24) examined test-retest reliability and responsiveness of the GPB measures in the same cohort of RA patients. The authors conclude that test-retest reliability was acceptable except for EQ-5D-3L (Reference Marra, Rashidi and Guy24, p 1341), that EQ-5D-3L was the most responsive measure in detecting worsening while HUI3 and SF-6D “were more superior in detecting improvement” (Reference Marra, Rashidi and Guy24, p 1342), and that HUI3 yield the largest change score while SF-6D yields the smallest (Reference Marra, Rashidi and Guy24, p 1342). The authors recommend HUI3 and SF-6D for GPB measures in clinical trials of RA (Reference Marra, Rashidi and Guy24, pp 1342–1343).
Fryback and colleagues (Reference Fryback, Palta, Cherepanov, Bolt and Kim25) compare the performance of major GPB measures in a population health survey. They note that while there appears to be a common core of physical and mental health reflected in all of the measures, the measures are also clearly not interchangeable.
Differences in Responsiveness
A study of teenagers with sub-threshold depression or depression as compared to a reference group of teens without depression provides useful information on the cross-sectional construct validity and responsiveness of several GPB measures including EQ-5D-3L, HUI2, HUI3, SF-6D, and the QWB-SA (Reference Lynch, Dickerson, Feeny, Clarke and MacMillan26;Reference Dickerson, Feeny, Clarke, MacMillan and Lynch27). With respect to known-groups construct validity all of the GPB measures performed well, although Lynch and colleagues (Reference Lynch, Dickerson, Feeny, Clarke and MacMillan26) noted that the duration of the interviews to complete the QWB-SA was substantially greater than for the other GPB measures. With respect to responsiveness, again all of the measures performed well. Furthermore, Dickerson and colleagues (Reference Dickerson, Feeny, Clarke, MacMillan and Lynch27, p 452) report that HUI3, SF-6D, and the QWB-SA were “among the most responsive measures while EQ-5D-3L was among the least responsive”.
Differences in Responsiveness
Langfitt and colleagues (Reference Langfitt, Vickery and McDermott28) compared four GPB measures (EQ-5D-3L with the U.K. and U.S. scoring systems; HUI2; HUI3; and SF-6D) in a longitudinal study of patients with chronic epilepsy. They report a substantial ceiling effect, a rate of 34 percent, for EQ-5D-3L, compared with < 10 percent for the other measures. Results for responsiveness across measures were mixed. Only changes in SF-6D and HUI3 were associated with improvements in seizure control. Langfitt and colleagues (Reference Langfitt, Vickery and McDermott28) conclude that SF-6D showed advantages in the study because SF-6D captured both the physical health consequences of seizures as well as the effects of seizures on social functioning.
Differences in Responsiveness
In a natural history study of recovery after stroke, Pickard and colleagues (Reference Pickard, Johnson and Feeny29) found that EQ-5D-3L and HUI3 were much more responsive than HUI2 and SF-6D. Among survivors, the mean gain in HRQL score registered during the six-month follow-up period was 0.31 for EQ-5D-3L (U.K. scoring system), 0.24 for EQ-5D-3L (U.S. scoring system), 0.25 for HUI3, 0.13 for HUI2, and 0.13 for SF-6D.
Lack of Coverage of an Important Attribute
In a study comparing a cohort of patients before and after cataract surgery, there were clinically important increases in vision-specific measures and in overall HUI2 and HUI3 scores, while there were no important changes in scores for the EQ-5D-3L, SF-6D, and QWB-SA (Reference Feeny, Spritzer and Hays30).
Lack of Responsiveness
EQ-5D-3L, HUI2, HUI3, QWB-SA, and SF-6D were used in a prospective cohort study of patients with congestive heart failure referred to a specialty clinic for care. According to a condition-specific measure, the Minnesota Living With Heart Failure instrument, clinically important improvement occurred in the cohort over the 6-month period from referral to follow-up. However, only three of the five GPB measures, that is, HUI3, QWB-SA, and SF-6D, showed clinically important improvement at the cohort level (Reference Feeny, Spritzer and Hays30;Reference Feeny31).
Floor Effects/Change Scores
HUI2, HUI3, SF-6D, the standard gamble (SG), and several specific measures were used in a longitudinal study of patients waiting for and undergoing elective total hip arthroplasty (THA) (Reference Feeny, Wu and Eng1). Among the four utility-based measures, SF-6D, HUI2, and HUI3 had the same order of magnitude of responsiveness, while the SG was less responsive. However, at the cohort level the four utility-based measures provided importantly different estimates of the gain in HRQL associated with THA, the mean difference between pre- and postsurgery scores. The difference was 0.10 for SF-6D; 0.16 for the SG; 0.22 for HUI2; and 0.23 for HUI3. Although patients reported improvements in physical functioning and reductions in bodily pain, floor effects associated with SF-6D (Reference Feeny, Eckstrom, Whitlock and Perdue20) led to a much lower estimate of overall improvement.
Specific Versus Generic Measures of HRQL
Generic measures are applicable across a wide variety of populations and health conditions and thus enable broad comparisons. GPB measures are a class of generic measures with scoring systems based on preferences for health states. Furthermore, there is guidance in the literature on CIDs for the major GPB (see, for instance, Feeny and colleagues) (Reference Feeny, Spritzer and Hays30). But it is often the case that specific measures are more responsive than generic measures (Reference Marra, Rashidi and Guy24;Reference Wiebe, Guyatt, Weaver, Matijevic and Sidwell32). Thus, there is the potential for disagreement between results based on GPB and specific measures. In the absence of a gold standard measure of HRQL, how should such cases be resolved? If both GPB and specific measures indicate that the intervention is not effective, one would conclude that the intervention is not effective. Similarly, if both indicate that it is effective, one would conclude that the intervention is effective.
It could be the case that the GPB indicates that the intervention is harmful while the specific measure indicates that the intervention is effective. This could result because of side-effects of the intervention that are not included in the specific measure (in arthritis an anti-inflammatory drug may reduce pain and swelling but result in gastro-intestinal distress) or an interaction with a comorbidity. The GPB provides overall information on the outcome: on net are patients better or worse off? It could also be the case that, while the specific measure indicates that the intervention is effective, the GPB does not. This could be the result of a lack of responsiveness of the GPB chosen. The use of two or more GPB measures reduces the risk of such an outcome.
Discussion
Inductive Propositions
It is useful to distill some generalizations from the case studies described above. For instance, virtually all GPB measures include an attribute assessing emotional health. For teen depression, Lynch and colleagues and Dickerson and colleagues found that all of the measures included performed well with respect to cross-sectional construct validity (Reference Lynch, Dickerson, Feeny, Clarke and MacMillan26, Reference Dickerson, Feeny, Clarke, MacMillan and Lynch27). However, with respect to responsiveness, HUI3, SF-6D, and the QWB-SA were the most responsive.
Given that HUI3 includes vision while EQ-5D and SF-6D do not, it is not surprising that HUI3 is more responsive in the cataract surgery study. An implication of these results is that to obtain valid preference-based scores it is necessary to use a measure that includes the key attributes important in that context. Another implication is that investigators need to consider the potential for floor and/or ceiling effects. SF-6D was responsive in the elective total hip arthroplasty study but under estimated the gain in overall HRQL.
In the context of chronic epilepsy, Langfitt and colleagues reported substantial ceiling effect issues for EQ-5D-3L and noted that only changes in SF-6D and HUI3 were associated with improvements in seizure control. Langfitt and colleagues recommend the use of SF-6D (Reference Langfitt, Vickery and McDermott28).
The attributes included in the GPB measures and the range of health status covered by those measures affects their performance. Results from the non-systematic review described above highlights the lack of interchangeability among these measures and illustrate contexts in which particular measures perform well or do not perform well.
These results have important policy implications in the context of HTA. There were substantial differences in the estimated change in HRQL among measures in the elective total hip arthroplasty and stroke studies. Results based on some of the measures would be quite favorable to the adoption and usage of elective total hip arthroplasty, while results based on other measures would be much less favorable. Measures that suggest only small or modest improvements in HRQL might result in incremental cost to incremental QALYs gained ratios above the “adoption” threshold. Policy decisions are subject to the choice of GPB measure.
Reprise: Rationale for Using Two or More GPB Measures to Assess Health Outcomes, Cost-Effectiveness and Cost-Utility
The key argument of this Commentary is a recommendation that investigators in their primary data collection use two or more, not just one, GPB measures per study. Similarly, when investigators systematically extract utility scores from the literature for modelling purposes, they should gather scores based on two or more, not just one, GPB measure. Estimates of QALYs would then be prepared separately for each GPB measure for which there are scores. Such a practice would benefit the CUA studies themselves as well as the fields of HTA and outcomes research.
In choosing among GPB measures investigators should take into account the potential range of effects and side-effects of the intervention as well as the nature of HRQL burden associated with the condition being studied. Does the measure being considered include all of the potentially relevant attributes and levels of severity? As Yang and colleagues note, “an inadequate measure may result in a misallocation of resources” (Reference Yang, Brazier and Tsuchiya33, p 42).
In a multi-GPB measure approach, the research protocol could ex ante designate one of the GPB measures as the primary measure and classify the other(s) as secondary. If, however, the designated primary GPB outcome measure is not responsive while the secondary one is, the HTA agency may give little weight to the results based on the secondary measure. Alternatively, the protocol could weight each measure equally, with multiple testing adjustment of statistical significance for study-wide comparisons, or use Bayesian analyses of existing evidence for specifying statistical significance. In any case, the investigators will have generated evidence to enhance the design of future studies, including studies for submission to HTA agencies.
An important additional benefit is the increase in scientific evidence on comparisons among measures, or in the language of economics, a positive externality. Information is a public good. Such evidence will better inform the selection and interpretation of measures for future studies. As noted above, studies that provide head-to-head comparisons of the performance of measures are especially valuable (Reference Drummond, Sculpher, Torrance, O'Brien and Stoddart34;Reference Gold, Patrick, Torrance, Gold, Siegel, Russell and Weinstein35). The fields of outcome measurement, CEA/CUA and HTA would benefit from an increased understanding of the advantages, disadvantages, and limitations of existing GPB measures in a variety of clinical areas. This is especially important in contexts in which there is uncertainty about the performance of GPB measures.
A potential disadvantage of using two measures is that investigators may “game” the system by choosing the GPB measure for which there is evidence on responsiveness in that context or through the selective reporting of results for the GPB that favors the intervention while omitting results for other GPB measures that do not. With respect to the first point, given the lack of a gold standard, selecting a GPB measure with a strong track record with respect to cross-sectional construct validity and responsiveness in previous studies in that context is appropriate and justifiable. Furthermore, it is important to note that the “gaming” issue also applies to the choice of one from the many GPB measures for use in the study. With modest revision, current standards for submissions to HTA agencies would probably be adequate to handle the selective reporting issue. For instance, requiring the submission to an HTA agency of study protocols before the study is conducted could guard against selective reporting. In addition, some journals publish study protocols.
Another disadvantage of using two measures is the increase in the burden to respondents and to research staff, and the increase in the cost of conducting the study. However, the commonly used GPB measures typically involve minimal respondent burden and low cost, in particular compared with the overall burden and cost of most studies. Note that licensing fees are associated with the use of some GPB measures. If a study uses multiple GPB measures, it may be advisable to randomize the order of their administration. In general, using two measures will represent a very small increase in overall burden and cost.
In conclusion, the routine use of two (or more) GPB measures enhances the rigor and accuracy of CUA studies and HTA. This argument also applies to HRQL studies that include GPB measures even if CUA and submission to an HTA agency is not among the objectives of the study. If both measures indicate that the intervention is effective or ineffective, the analysts can be more confident in that conclusion. If the two measures disagree and there is substantial empirical evidence that one of the measures performs poorly in that context, the analyst can avoid a false negative conclusion. The use of two (or more) GPB measures is feasible, justifiable and would add value.
Conflicts of interest
The authors report competing interests: It should be noted that David Feeny, William Furlong, and George Torrance have a proprietary interest in Health Utilities Incorporated, Dundas, Ontario, Canada. HUInc. distributes copyrighted Health Utilities Index (HUI) materials and provides methodological advice on the use of the HUI.