Systemic lupus erythematosus (SLE) is a disease with an economic impact on healthcare system either in terms of treatment of disease activity or of management of comorbidities and organ damage (Reference Agmon-Levin, Mosca, Petri and Shoenfeld1–Reference Nossent, Cikes and Kiss7). Panopalis et al. (Reference Panopalis, Clarke and Yelin8) affirm that both direct and indirect healthcare costs are notable in particular for patients with the most severe disease and with complications like lupus nephritis. Understanding the economic implications of the disease allows to highlight the burden of SLE and may support decision making in the allocation of healthcare resources. Currently, the studies evaluating costs related to this disease refer to a limited number of countries (Reference Mosca, Boumpas and Bruce9;Reference Turchetti, Yazdany, Palla, Yelin and Mosca10). The economic burden of disease rises from a systematic review on direct costs of adult patients with SLE in the United States (Reference Slawsky, Fernandes, Fusfeld, Manzi and Goss11). Direct costs range from $13,735 to $20,926; this wide range reflects the difference in cost between the clinical presentation and the severity of the disease. Lupus nephritis, in fact, accounts for the highest costs due to direct costs and loss of productivity ($29,034 and $62,641, respectively, versus $12,273 and $16,575, respectively, in patients without lupus nephritis).
In addition, literature data show a correlation between the growth in healthcare costs and the worsening of the disease: in the first year they amount to an average of $27,413 while the fifth year they exceed $50,000; in patients without nephritis mean annual costs increase of 16 percent until the fifth year (Reference Li, Carls and Panopalis12). The systematic review of Meacock et al. (Reference Meacock, Dale and Harrison13) reports mean annual direct costs per patient with SLE ranging from $2,214 to $16,875 and mean annual indirect costs estimates ranging from $2,239 to $ 35,540 (all values are referred to year 2010). The cross-sectional, observational cohort study performed by Bexelius et al. (Reference Bexelius, Wachtmeister, Skare, Jönsson and van Vollenhoven14) reports mean annual costs per patient according to the societal perspective. The total annual costs for the total sample of patients (n = 339) amount to €22,594, 65.4 percent of which is represented by indirect costs (all values are referred to year 2011 and converted from Swedisk Krona to euro).
The recent retrospective study LUCIE, carried out in five European countries (France, Germany, Italy, Spain, and United Kingdom) on 427 patients with SLE followed for 2 years, shows that the average cost for a patient with a severe condition is higher than that for a patient with a nonsevere condition (€4,748 versus €2,650; p < .001). Costs of drug treatments are €2,518 in severe patients and €1,251 in nonsevere patients, that is, 53 percent and 47 percent of total costs, respectively. In particular the severe flares are identified as the major predictor of cost with an increase of €1,002 per flare (Reference Doria, Amoura and Cervera15). These cost data agree with the study of Zhu et al. (Reference Zhu, Tam, Lee and Li16), which reports higher direct and indirect costs for patients with flares; in fact, the total annual direct costs are three times higher in patients with flares compared with patients without ($16,873 versus $6,034; p < .005).
To date, the only available source of Italian data in literature is represented by the Italian LUCIE arm (ninety-six patients, forty-nine with severe SLE, mean age 42.9 ± 11.7 years, 85.4 percent females) which involves four rheumatologic centers specialized in the treatment of SLE. The average annual direct costs amount to €2,513, minimum and maximum values (respectively, €239 and €15,536) show large variations in the direct costs related to the different profiles of severity and disease activity. The mean direct medical costs are 1.4 times higher in severe patients compared with nonsevere patients (€2,905 versus €2,104; p = .031). In the 2-year follow-up, the average cost for patients with flare is 2.4 times higher than that of patients without flares (€6,420 versus €2,718; p < .001). The number of severe flares is related to costs (p = .0487), with an incremental cost per exacerbation of €594,13 (Reference Mathieu, Doria and Perna17).
The aim of the present study was to assess, using a Budget Impact Model (BIM), the economic burden arising from the introduction of belimumab in the treatment of SLE. Evidence about the cost-effectiveness of belimumab for the management of SLE has been recently published (Reference Pierotti, Palla, Treur, Pippo and Turchetti18).
MATERIALS AND METHODS
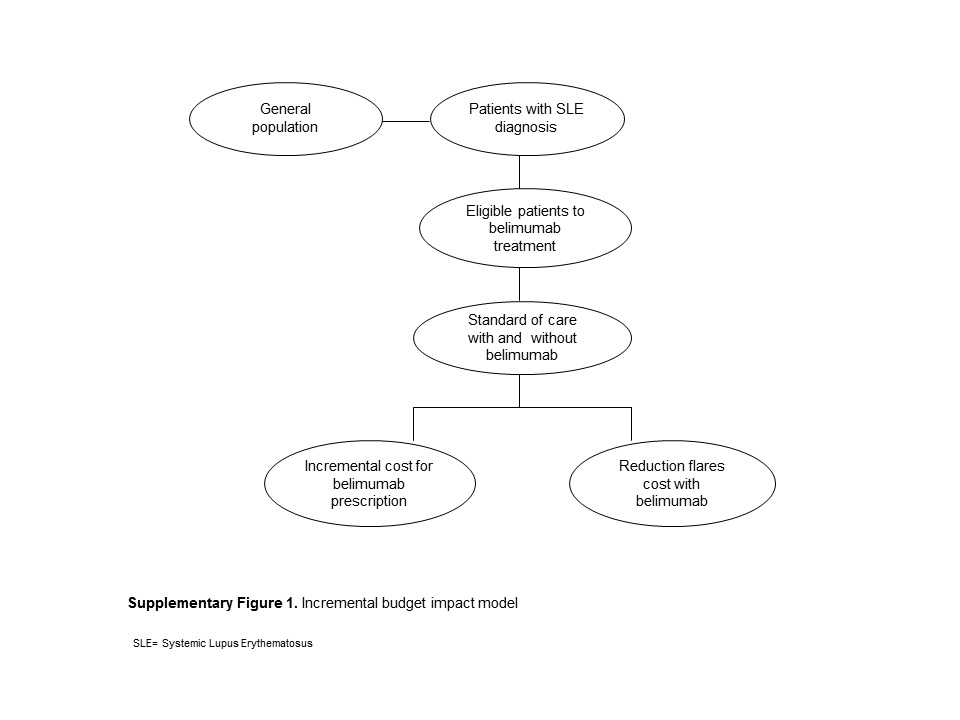
The analysis compared the impact on pharmaceutical expenditure of the Italian National Health System (NHS) for 4 years resulting from a strategy of treatment of SLE without belimumab (standard of care, SoC) and belimumab (SoC + belimumab, SoCB). Budget impact model was developed by GlaxoSmithKline in partnership with Sigmatic Ltd t/a Abacus International, which owns the intellectual property rights, and it was adapted to the Italian setting by the authors. BIM was structured to compare the costs of treatment, administration, and clinical monitoring of standard drug therapy in the treatment of SLE with the alternative scenario in which belimumab is administered in addition to the standard therapy. The model also compared, both in clinical and economic terms, the impact of the two different interventions on exacerbations (flares).
The budget impact analysis was designed to estimate the financial impact on direct medical costs resulting from the entry of a new treatment in the “market mix” of drugs already in use, taking into account also the clinical benefits of the new therapy and the related savings (Supplementary Figure 1). The financial impact was calculated in the perspective of the National Health System, with the possibility to replicate the analysis on a regional basis, to inform local decision makers. Discount rate was not applied according to International Society for Pharmacoeconomics and Outcomes Research recommended good practice for budget impact analysis (Reference Sullivan, Mauskopf and Augustovski19).
Data: Assumptions and Sources
A 4-year time horizon was adopted: the 0 year corresponded to the scenario before the entry of belimumab, and the years 1–3 to its introduction in clinical practice in addition to SoC. The choice of this time horizon enables both a short-term and a medium-term evaluation after the entry of belimumab, consistent with the time extent of the NHS planning (typically 3 years).
-
• Annual increase of general population was set equal to 1 percent, according to the Italian Institute of Statistics (ISTAT) data (20).
-
• In the first year of treatment, belimumab was administered on days 0, 14, and 28, then every 28 days for a total of 14 doses/year. In the subsequent years, belimumab was administered every 28 days for a total of 13 doses/year.
-
• Patients treated with belimumab in the first year could discontinue therapy after 6 months. This probability was estimated adopting the rate of discontinuation observed in clinical trials BLISS-52 and BLISS-76 and was equal to 19.5 percent (Reference van Vollenhoven, Petri and Cervera21). This value took into account the adverse events (7.9 percent), the noncompliance of the patients (0.7 percent), the lack of clinical efficacy (6.6 percent), the patients’ request (3.0 percent), and the decision of the clinicians (1.3 percent). Total costs did not take into account belimumab costs and cost savings due to a lower incidence in flares in patients who, for whatever reason, discontinued belimumab treatment.
-
• Belimumab ex-factory price was used, according to the Italian Official Gazette, and expressed per mg. This cost did not take into account the confidential patient access scheme agreed between Italian Medicines Agency (AIFA) and the company holder of the marketing authorization.
-
• Because belimumab doses are calculated on a body weight basis, when the solution is reconstituted, the exact volume is drawn for the administration and the remaining solution should be discarded. As a consequence, to reason on a more realistic scenario, the model took into account the wastage and, calculated for each patient the cost of the entire vial, regardless of the dosage actually used. In the major referral centers for the treatment of SLE, it could be argued that belimumab is administered on a given day in a certain number of patients per day with predefined body weight characteristics to limit/avoid the waste of the vials (as it is usual, for example, in the case of rheumatoid arthritis with infliximab). Anyway, such an efficient scenario does not seem applicable to the majority of clinical settings.
-
• Average weight of patients was assumed equal to 68 kg. This assumption derives from the LUCIE study (Reference Mathieu, Doria and Perna17) and it is supported by the fact that the sample largely consists of female patients with active disease and treated with SoC. Moreover, this figure was consistent with the Italian setting, although it was higher than the average value of the phase 3 clinical trials (approximately 61 kg) (Reference Navarra, Guzman and Gallacherm22;Reference Furie, Petri and Zamani23); thus, it would suggest higher cost of therapy.
-
• The model estimated the total number of severe and nonsevere flares according to the pooled data analysis of clinical trials BLISS 52 and BLISS 76, related to weeks 0–52 (Reference van Vollenhoven, Petri and Cervera21;Reference Petri, Levy and Merrill24). Accordingly, the incidence of severe and nonsevere flares was 0.63 and 2.68, respectively, for SoC; while for SocB the incidence of severe and nonsevere flares was 0.37 and 1.83. The frequency of flares at week 52 was then assumed constant in the subsequent years in both arms of intervention.
-
• Patients with flares in clinical practice are assessed for infectious diseases, serological tests and sometimes hospitalized, the hospitalization rate depending on the severity of flares. The model assumed that the costs of any further pharmacological treatment administered during the hospitalization are included in the DRG (disease related group) reimbursement.
-
• Each treatment was characterized by a series of tests and medical visits scheduled with a definite frequency per patient per year (clinical monitoring). The definition of such follow up was based both on the LUCIE study (data on file) and on a specific questionnaire (reference year 2010). The questionnaire was administered to four highly experienced clinicians from SLE tertiary centers with the aim to detect and/or validate information about treatments, flares, therapies modality in drug administration, and management of complications.
-
• Cost items of the model were measured using the National Tariffs List of outpatient specialist care (25), the reimbursement charges of drugs Class A and H of AIFA (A: drugs reimbursed by NHS dispensed in pharmacy; H drugs reimbursed by NHS dispensed in hospital) (26) and the reimbursement charges of Hospital Care for acute hospitalization (DRG) (27).
-
• Reimbursement charges were not updated because they represented the most recent reimbursed values currently available.
-
• All assumptions and hypotheses underlying BIM were validated by a panel of external experts (Reference Turchetti and De Waure28).
Population Eligible for Treatment with Belimumab
According to EMA approval, the profile of patients eligible to belimumab treatment is the following: “Benlysta is indicated as adjunctive therapy in adult patients with active systemic lupus erythematosus (SLE), autoantibody-positive, with a high degree of disease activity (e.g., anti-dsDNA positive and low complement), despite standard therapy.” Table 1 reports the details of the whole population and of the patients’ subgroups(Reference Davidson, Galway and Egger29;Reference Ippolito, Wallace and Gladman30). The proportion of patients with active disease was the mean value between the cohort studies of Nikpour et al. (Reference Nikpour, Urowitz, Ibanez and Gladman31) and of Zen et al. (Reference Zen, Bassi and Nalotto32). The first study reported prospective data (reference year 2004) to determine the incidence of flares and of patients with active disease (SLEDAI-2K ≥4 in at least two consecutive visits); the latter developed an analysis on the basis of the same classification parameters.
Table 1. Population Eligible for the Treatment with Belimumab

IP, Italian population. PSLE, Patients with SLE diagnosis: 0.047% of IP. PAS, Patients ANA seropositive: 96% of PSLE.PAD, Patients with active disease: 50% of PAS. PLCA, Patients with low complement and anti-dsDNA positive: 39.58% of PAD. PSLN, Patients without severe lupus nephritis: 97.40% of PLCA.
The LUCIE study showed that 39.58 percent of patients present low levels of complement fractions and anti-dsDNA positivity, while 2.6 percent suffer from a severe lupus nephritis (data on file), a condition for which belimumab use was not studied and is now under evaluation (which represents a contraindication to belimumab). The eligible population for belimumab amounted to 5,273 patients.
Treatments and Costs
The model analyzed the following pharmacological treatments: nonsteroidal anti-inflammatory drugs, corticosteroids, antimalarials, immunosuppressants, and biologics (rituximab is used off-label). A reference drug (the most used according to experts’ opinion) was defined for each class (Supplementary Table 1); for the immunosuppressants class, the model considered both azathioprine and mycophenolate mofetil (usage ratio 4:1).
The percentage of patients receiving standard therapy resulted from data of the Italian arm of LUCIE study (Reference Mathieu, Doria and Perna17). In particular, the percentages of patients with anti-dsDNA positivity and low C3 or C4 complement fractions during the 2-year follow-up were considered to estimate the number of patients using the different medical treatments each year. The year 0 value referred to this cohort and represented the current state of care for patients receiving treatment for SLE. The shares of corticosteroids and immunosuppressants were the sum of oral and injectable doses. The total number of treatments per year was greater than the total number of patients, as each patient may be administered simultaneously multiple drugs.
GlaxoSmithKline provided belimumab from 0 percent at year 0 when belimumab is not on the market, to 10 percent at year 1, up to 49.3 percent at year 3 (Supplementary Table 2). The belimumab market shares reflected the mean time to inclusion of a new product in Regional and Hospital Formularies, that is, the need of clinicians to increase their disease knowledge and to gain expertise before extending the use of the product.
The use of belimumab is in add-on with respect to other nonbiologic treatments, then it was not expected to change the patients distribution per year and per therapy. The annual percentage of patients treated with belimumab was calculated taking into account the percentage of cases (19.5 percent) discontinuing the therapy after 6 months and continuing SoC only.
The entry of belimumab modified the distribution of patients treated with rituximab as the use of the two drugs is mutually exclusive which means that the entry of belimumab on the market will gradually erode rituximab's market share (used off-label). The model assumed a reduction of patients treated with rituximab coherent with the patient uptake of belimumab (10 percent at year 1, 33.5 percent at year 2, 49.3 percent at year 3).
In the subsequent years, the patient numbers were increased 1 percent per annum according to ISTAT estimates. The pharmaceutical costs were calculated based on AIFA lists of reimbursement (maximum reimbursed price). Annual therapy cost per patient was calculated adding the drug cost and the administration/monitoring cost, including test, exam, and visit costs performed during the year for each patient (Supplementary Table 1).
The model assumed that the discontinuation of therapy with belimumab could occur after 6 months: in these cases, only the costs related to this period were considered. Total costs of the arm with belimumab were obtained adding the cost of SoC to belimumab ones.
The total annual cost of treatments was calculated on the target population (Table 2). The value was obtained multiplying the total annual cost of each treatment by the number of treated patients, taking into account belimumab patients uptake and treatment discontinuation on a yearly base.
Table 2. Annual Total Costs Therapies

SoC, standard of care; SocB, standard of care + belimumab.
Flares Costs
A flare is a temporary, clinically significant event which usually requires a change of treatment. The annual incidence of severe flares was obtained from the trials BLISS-52 and BLISS-76 relative to 0–52 weeks, considering the patients subgroup with low complement and positive anti-dsDNA (Reference Navarra, Guzman and Gallacherm22). Flares were classified using the modified SELENA SLEDAI index: moderate/slight flares present a change ≥3 in SLEDAI, severe flares a change >12 or defined clinical manifestations.
The number of severe and moderate/slight flares in patients treated with standard therapy with/without belimumab was estimated multiplying the annual incidence (assumed constant) by the number of patients (Supplementary Table 3). If the patient discontinued belimumab treatment, the benefit of the drug was not accounted and an incidence of flares equal to the SoC was considered. The economic evaluation of exacerbations took into account costs for diagnosing infectious diseases, for serological tests and for hospitalization, according to the tariffs available during the year 2011.
The tariffs (DRG 240 for severe flare: connective tissue diseases with complications; DRG 241 for nonsevere flare: connective tissue disease without complications) were applied to the percentage of patients requiring hospitalization due to flares. The proportion of patients needing hospitalization was estimated to be equal to 10 percent in case of nonsevere flares and 100 percent in case of severe flares. Scenarios with SoC and with SocB were compared to evaluate the total annual costs of flares and treatments.
RESULTS
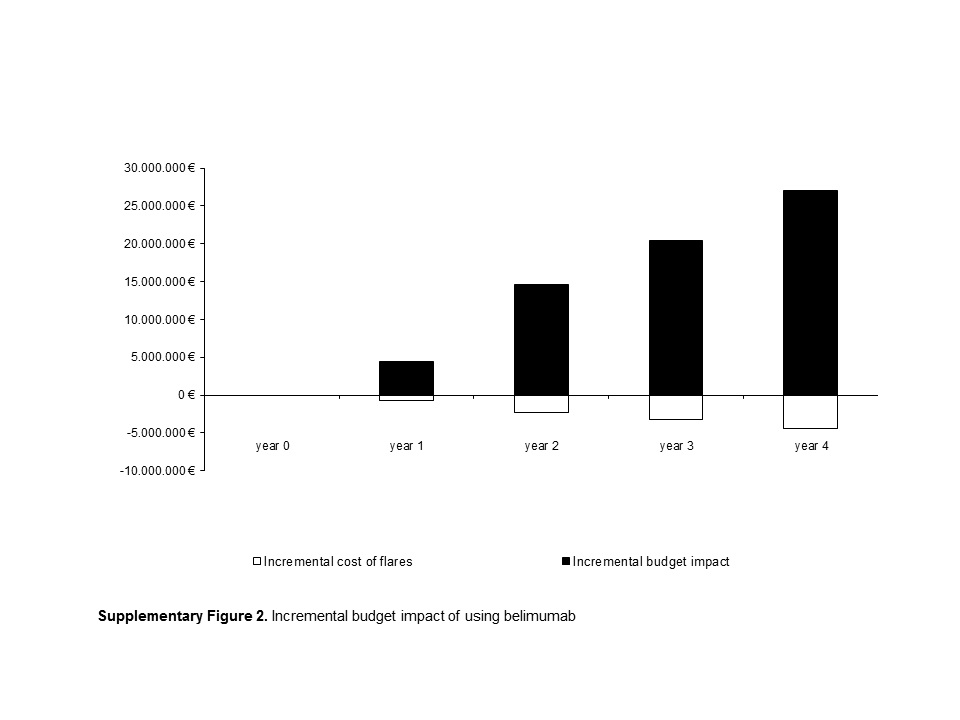
The budget impact due to the entry of belimumab was calculated as the difference in costs between the two scenarios (Soc and SoCB) for the treatment of patients with active SLE, autoantibody positive, with a high degree of disease activity (positive anti-dsDNA and low complement C3–C4) despite standard therapy. Total costs of treatments in the arms with and without belimumab included the cost of drugs, drugs administration and clinical monitoring (tests, exams, scheduled visits), and the costs of flares. Wastage of belimumab was considered. The incremental impact on the budget in the first year after the entry of the new technology was equal to €4.4 million, while the cumulative 3-year impact was of €39.4 million (Supplementary Figure 2).
The use of belimumab allowed a reduction in the total number of severe and nonsevere flare equal to 1,111 and 3,631 episodes, respectively, during the 3-year period of use. The decrease in number of flares was relevant as this was associated with a decrease in the overall costs of €6,238,549. The cost difference between SoC and SocB amounted to €670,681 in year 1, to €2,275,094 in the year 2, and to €3,292,775 in year 3 (Table 3). The decrease in the number of flares due to the use of belimumab might be relevant from a clinical point of view, and it resulted in a partial compensation (approximately 16 percent) of the cost of introduction of the new technology (Supplementary Table 4). The model did not consider the additional clinical and economic benefits due to the prevention of organ damage and to the slowing in the progression of the disease.
Table 3. Annual Costs for Flares

SoC, standard of care; SocB, standard of care + belimumab.
Sensitivity Analysis
Univariate sensitivity analysis (Figure 1) changes one at a time the values of certain parameters value and compares budget impact results to base case results. The tornado diagram showed the range of variation of the budget for each parameter, while the range of each parameter is summarized in Supplementary Table 5. The prevalence of patients with SLE was the factor which mostly affected the impact on the budget. Applying to the model the minimum value available in the European literature (0.022 percent), the impact on the budget was €31,130,137 while using the highest value (0.071 percent) the impact was €100,465,442. The percentage of patients with active disease and the average body weight of the patient also had a significant impact on budget impact results.

Figure 1. Tornado diagram of one-way sensitivity analysis.
Probabilistic Sensitivity Analysis was also performed to take into account the degree of variability and uncertainty related to all parameters used in the model simultaneously. Beta distribution was used for SLE prevalence, percentage of patients with active disease; gamma and uniform distributions were used for costs and market shares, respectively. Performing Monte-Carlo simulations, values for all model parameters were randomly sampled from distributions assigned to parameters and the distribution of the estimated budget impact was then generated. Uncertainty intervals were estimated from the simulated data by taking the 2.5 and 97.5 percentiles values to represent the end points for a 95 percent interval. The uncertainty interval for the overall budget impact estimated from PSA ranged from € 26,057,629 to € 56,186,755, thus indicating a certain degree of variability of results from the base case analysis but also suggesting consistency of the results. Moreover, estimated of the costs of flares ranged from € -11,298,546 to € -3,473,369 and costs of treatment ranged from € 30,069,084 to € 64,726, 089.
Alternative Scenarios
Analyses related to three alternative scenarios were performed.
Scenario 1 took into account that in the clinical practice not all patients start the therapy at the beginning of each year (January 1) and continue it throughout the end of each year. In this case, treatments per year instead of patients per year were calculated. The model assumed that number of treatments corresponded to 60 percent of number of patients in the first year, 75 percent in the second and third year (from 304 treatments at year 1 to 1,721 at year 3). This scenario would provide a more realistic estimation of the budget impact after the introduction of belimumab: around €2.7 million for year 1 and €15 million for year 3, with a total budget impact of approximately €28.9 million (Supplementary Table 6). In this scenario, 811 severe flares and 2,652 nonsevere flares were cumulatively avoided, with total savings for the NHS equal to €4.6 million, over the 3 years.
In scenario 2, the use of rituximab (another biologic drug used off label in clinical practice) was not influenced by the market availability of belimumab. Starting from the conservative hypothesis that belimumab did not change the market shares of rituximab, the 3-year cumulative difference in total cost between SoC and SocB (Supplementary Table 6) was €47.6 million versus € 45.7 million of the base case scenario.
Scenario 3 assumed no waste of belimumab vials. This analysis showed a significant reduction of the budget impact over the years (Supplementary Table 6); however, the absence of product waste in the administration of belimumab was a purely theoretical scenario because, due to the low prevalence of the disease and the small number of patients eligible for treatment with belimumab, few centers would be able to schedule a simultaneous treatment for several patients in the clinical practice.
DISCUSSION
SLE is a chronic, non–organ-specific autoimmune disease that may affect many organs and systems. Chronic therapy with steroids and immunosuppressive drugs, in addition to the consequences of disease activity itself, is associated with increased damage accrual. Belimumab is the first novel drug approved for SLE since approximately 50 years. The efficacy of belimumab added to standard of care has been showed compared with SoC alone.
The introduction of a new drug always suggests the re-organization of the Health Care Budget. To help decision makers in their health economic planning, this budget impact analysis can provide an overview of the cost due to the implementation of belimumab as a new treatment for SLE in the Italian setting.
The analysis was based on referenced data and expert opinion, and, in some specific aspects, can be affected by the lack of specific evidence. Therefore, a major effort of the working group was to validate and share each assumption of the model.
The base case showed that budget impact ranges from €4.4 million in the first year to €20.3 million in the third year. Over 3 years, belimumab was able to prevent cumulatively 1,111 severe flares and 3,631 nonsevere flares, with a total saving for the Italian National Health System of approximately €6.2 million (Supplementary Table 3). The decrease in the number of flare partially counterbalances the costs of the new technology (impact attenuation of approximately 16 percent) (Supplementary Table 4).
These data elucidate the importance to control and monitor the disease progression and to prevent exacerbations, which are the major causes of the increase in costs paid by the NHS and by the society. As described for other rheumatologic conditions, further developments are possible as the model did not consider the additional clinical and economic benefits for prevention of organ damage avoided and the slowing of the disease progression (Reference Turchetti, Pierotti, Carnevali and Manzi33–Reference Turchetti, Spadoni and Geisler40).
Despite that results from the present analysis are not directly transferable to other countries, the approach, methodology, and structure underpinning the model could serve as a basis to perform similar analyses elsewhere.
SUPPLEMENTARY MATERIAL
Supplementary Figure 1: https://doi.org/10.1017/S026646231600057X
Supplementary Table 1: https://doi.org/10.1017/S026646231600057X
Supplementary Table 2: https://doi.org/10.1017/S026646231600057X
Supplementary Table 3: https://doi.org/10.1017/S026646231600057X
Supplementary Figure 2: https://doi.org/10.1017/S026646231600057X
Supplementary Table 4: https://doi.org/10.1017/S026646231600057X
Supplementary Table 5: https://doi.org/10.1017/S026646231600057X
Supplementary Table 6: https://doi.org/10.1017/S026646231600057X
CONFLICTS OF INTEREST
The work was supported by GlaxoSmithKline which sponsored the study design, the collection, analysis, and interpretation of data. PF, PI, LV and TG declare that their University received a research grant from the Company to carry out the project. PL was employed in GSK at the time of the study. The study is registered in GSK with the number H0-14-15813.