Liver transplantation for patients with end-stage liver disease was introduced in the 1980s (9). Initially, demand for this therapy/technology exceeded the available supply (17), and unfortunately for end-stage liver disease patients, transplantation is their only therapeutic option.
Although efforts to increase the number of organ procurements have successfully and steadily increased the supply of cadaveric organs, this increase has been consistently outstripped by increases in demand. Because demand is likely to continue to grow, one solution is to find alternate organ replacement technologies (ORTs). Organ replacement technologies already exist for several other organs. These technologies either fully or partially replace the target organ. For example, patients with end-stage kidney disease have the option of undergoing kidney dialysis, which has been well established since the 1950s. Patients with end-stage heart disease have technologies such as left ventricular assist devices and potentially complete artificial hearts (3;4;6). For sometime now, patients with less severe heart disease have devices to replace the electrical component of their hearts, that is, pacemakers.
There are several potential organ replacement technologies for livers. These include partial-liver living-donor transplants, which already account for several hundred transplants per year. Promising technologies such as tissue-engineered organs (12;13;20;21) and xenotransplants (8;15;16) are likely to see clinical application in the foreseeable future.
The objective of this study is to determine how good do these organ replacement technologies need to be with regard to volume, durability, and cost to make a significant difference in the waiting list, deaths, and time to transplant. We believe this information will help give researchers target parameters and help policy makers make decisions about technologies.
METHODS
We constructed a discrete-event simulation model of the liver allocation system in the United States. This model was calibrated against UNOS published data (7) from 1994 to 2000 and against the Pittsburgh liver allocation model natural history module (1;18). The calibration targets were waiting list length, deaths while waiting, number of transplants, and time to transplant. UNOS data (7) from 2000 to 2003 were reserved for predictive validation.
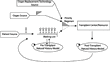
Figure 1 shows a schematic of our liver allocation model. This is modular in design, meaning that each section, for example, the patient source, is independent but communicates with the other modules in the system. This strategy allows continual updating of our model module by module. Patients are generated from the patient source module. They enter a waiting list where they wait for an organ to become available. While they are on the waiting list, their clinical state continues to evolve. The pretransplant natural history module governs this clinical evolution. They remain on the waiting list unless they are transplanted, die, or become inactivated. Organs are generated from the organ source module. They then enter the module governing the priority regimen, which is based on the mixed regional hierarchy/clinical urgency system that exists in the United States. This module then scans the patients on the waiting list looking for a suitable match. Toss-ups are resolved by wait time. If a suitable match is found, the patient is removed from the waiting list and, along with the organ, is transported to the transplant center module for transplant. If no suitable match is found within the procured organs viable period, it is removed from the system and considered wasted. In the transplant center module, the organ and patient entities are combined. The patients may experience surgical death at this point. If the patient survives the transplant, they are moved on to the post-transplant natural history model. In this module, the patients post-transplant survival, the graft's survival (which may be shorter than the patient survival), and the risk of retransplant are all simulated. Patients who go on to retransplant reenter the waiting list.

This is a schematic of the liver allocation model. It is modular in design. There are separate modules for source organs or organ replacement technologies, patients, the waiting list, the matching decision regimen, transplant centers, and pre- and post-transplant natural history. When patients arrive they are placed on a waiting list. Because the patients have a life expectancy of days to years while the organs have a life expectancy of hours, the organs drive the search algorithm.
Patient registration rates, organ procurement rates, pretransplant survival rates, and post-transplant survival rates of both patient and organ were derived from UNOS and the literature. ORTs were introduced into the model for model year 10, equivalent to 2002.
Cost-Effectiveness Analysis
Cost-effectiveness analysis (10) is the process by which two or more strategies are compared with regard to cost and effect. A preferred strategy is one that either provides the same or better effect at either the same or less cost or one whose incremental cost-effectiveness ratio is acceptable. This means the extra effect is worth the extra cost.
Costs include the cost of organ in ORT procurement, health maintenance costs while waiting for transplant, transplantation/hospitalization costs, and post-transplant follow-up costs. All costs were adjusted for each model year of the study based on the medical consumer price index. Total costs were calculated as the average cost of care per ORT recipient over their lifespan (Table 1).

The primary outcomes of interest were the time to a significant reduction in the waiting list defined as a 5 percent reduction in the total number waiting and the average number of transplants at year's end over the whole model run. The whole model run average was used in this analysis because the liver allocation system cannot be considered a stable system. Specifically, it is neither a terminating nor nonterminating system (2;11).
In dynamic system modeling, a terminating system is a system for which there is a clearly defined beginning and end. For example, a day in the life of a clinic (19). Outcomes of interest, for example, patients treated/day, are calculated based on this time interval. A nonterminating system is a system that has no formal beginning or end. For example, the air transport system or an emergency room (2). For nonterminating systems, it is conventional to choose a representative length of time within the steady-state to use as the basis for calculating your outcomes. The liver allocation system is a dynamic system that has not yet assuredly reached steady-state. Therefore, the period of analysis is the whole model run.
Base-Case Assumptions
The central assumption is that specific members of a technology class must operate within the same functional parameter space. Here tissue-engineered livers, xenotransplants, liver dialysis, cadaveric livers, and living donor partial livers are members of the technology class ORT that provide life support to patients whose livers have failed. This assumption is followed by several specific assumptions for the base case, which were tested through sensitivity analyses. They were (i) the cost for procuring and implanting an ORT was in the base case the same as the cost for protecting cadaveric organs, (ii) the current UNOS-managed allocation system remains unchanged, (iii) the quality of life resulting from implanting an ORT and cadaveric organ were the same, (iv) the production capacity for manufacturing ORT, once instituted grows at the same rate as a historical growth of transplant programs, (v) if a patient receives an ORT and it fails, they return to the waiting list ranked according to their clinical urgency but with their previously accrued waiting time reset to zero, (vi) there is no limit to the number of ORTs a patient may receive, (vii) cadaveric organs are continued to be procured at historic rates, and (viii) patients continue to register for transplant at historic rates.
Sensitivity Analyses
Sensitivity analysis is the process by which the value of a parameter important to the model is systematically varied over a test range. The purpose of sensitivity analyses is to understand both the behavior and the limits of the system being model. In this analysis, we varied the manufacturing volume from 250 ORT/year to 5,000 ORT/year. We varied the durability (time to failure) from 6 months to 5 years. We varied the procurement costs/manufacturing costs from .25 to 5 times the cost of procuring a cadaveric organ. A 5 percent change in the outcome parameters was deemed significant.
RESULTS
Calibration
Model output for both the calibration and validation phases closely matched published data on the four main calibration parameters. Model waiting list length (±2 percent), number of transplants (±2 percent), deaths while waiting (±5 percent), and time to transplant (±11 percent) were within published values (www.unos.org).
Sensitivity Analyses
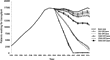
Waiting list reduction was dependent on both production volume and ORT durability. At lower production volumes of 250 ORT/year and durability <2 years, a 5 percent waiting list reduction from the expected waiting list length was not seen until between years 5 and 8 from the beginning of the introduction of ORTs. When durability exceeded 2 years, a 5 percent reduction was seen between year 4 and 5. For volumes of 500 ORT/year, this reduction was achieved between years 3 and 4 and for higher volumes within the first year (see Figure 2). At high volume and low durability, there is a temporary slight initial increase in the waiting list. This is a result of a relatively high volume of early ORT failures feeding back into the system.

Waiting list by scenario. The heavy solid line represents the base case. After organ replacement technologies (ORTs) are introduced, the other lines represent different scenarios of ORT production volume, ranging from 250 to 5,000/year with ORTs of different durabilities (time tofailure). ORT durability is varied from 6 months to 5 years. Invariably within these volume scenarios, the ORTs with the shortest durability show the least reduction in the waiting list and those with the longest durability show the greatest reduction.
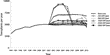
The time to a 5 percent improvement above the expected transplant volume depended on both the volume and the mass of patients left on the waiting list. For lower volumes, 250 ORT/year, a 5 percent reduction was not seen until between year 6 and 8 for the whole range of durability. For volumes of 500 ORT/year, this improvement over the expected was seen between year 2 and 3. For higher volumes, this improvement was achieved within the first year. At the high end of the production range, 5,000 ORT/year, there is a rapid rise and fall in the number of total transplants (cadaveric + ORT) as the unmet demand (the waiting list) is met. This change returns to near the baseline transplant rate at approximately year 6. At this point, the waiting list has been reduced to near zero, time to transplant has been reduced to less than 30 days, and the demand is being met by supply (Figure 3).

Transplants by scenario. The heavy solid line represents the base case. After organ replacement technologies (ORTs) are introduced, the other lines represent different scenarios of ORT production volume, ranging from 250 to 5,000/year with ORTs of different durabilities (time to failure). ORT durability is varied from 6 months to 5 years. Invariably within these volume scenarios, the ORTs with the shortest durability show the least improvement in transplant numbers and those with the longest durability show the greatest improvement.
With regard to cost-effectiveness, assuming base-case costs, all cases of ORT production volume and durability result in more transplants per year at less cost per patient than the current system. ORTs remain cost saving until the cost of manufacturing ORTs is >5 times the cost of cadaveric organ procurement, volume is <500 ORT/year, and durability is <6 months.
DISCUSSION
The purpose of this study is to estimate specifications for the volume, durability, and cost of organ replacement technologies to help both scientists developing these technologies and policy makers deciding in which to invest. Because demand is so high, almost any ORT production would be cost-effective. This statement holds true until the cost of procurement/manufacture exceeds 5 times the current cost of organ procurement and at the same time durability is less than 6 months and volume is less than 500 ORT/year. This set of circumstances is most likely to occur in the very earliest phases of the dissemination of these technologies. However, this should not remain a barrier to developing and investing in these technologies, because the cost of production, as with most other technologies, should drop over time.
Volume appears to be more important than durability for reducing the waiting list. For all production volumes we examined, the waiting list begins to be significantly reduced by between years 3 and 4. However, at high volumes, low durability organs may seemingly paradoxically induce a temporary increase in the waiting list. This finding is due to patients whose ORTs fail feeding quickly back into the waiting list. This phenomenon, however, works itself out within 3 to 4 years. At lower volumes, low durability may delay the reduction in the waiting list.
Despite this model being a simplification of a complex reality, it performed well in predictive validation. One potential limitation to this analysis, however, was the assumption that management of the allocation of cadaveric organs and ORTs would remain solely the province of a UNOS-like central organization. This may not necessarily hold true once the technology is proved safe and durable enough. For example, there are several manufacturers of pacemakers, stents, and joint replacements. The market for these is determined by cost, performance, and the willingness to pay of various health organizations and individuals.
With the three main candidate ORTs, there remain significant problems to overcome. Partial-liver living-donor transplants place healthy individuals at risk (5), xenotransplants need to overcome trans-species immunologic barriers and the potential risk of becoming a means for new infectious agents to enter the population, and tissue-engineered organs need to make the jump from tissue beds to three-dimensional organs. Despite these obstacles, if progress continues at its current pace, we should be seeing the beginning application of these technologies in the next few years. As noted earlier, partial-liver living donor transplants are already in use. However, because of the ethical issues and political issues surrounding live donors, it is unclear whether this procedure will ever see wide use and may be most suited to pediatric transplantations. This finding means that we will most likely see a mix of these technologies as they mature at different rates and each begins to fill different therapeutic niches. Tissue-engineered organs and xenotransplant technology seem to have the lowest threshold for creating the necessary large volume of ORTs needed to eliminate the therapeutic clinical bottleneck. Whatever the final mix, these organ replacement technologies, as long as they can meet the benchmark cost, volume, and durability criteria, have the potential of transforming the world of end-stage liver disease.
POLICY IMPLICATIONS
There is a range of liver ORTs that hold a great deal of promise. Setting goals for a technology is a good way to drive innovation and to judge its success or failure. Such goals and challenges in aviation, robotics, and heart replacement technologies (14;22) have to date led to many successes. However, wherever possible, these goals and criteria for success should be established to solve both identifiable problems and specific needs of the target system. With regard to liver ORTs, it appears that exceeding a minimum durability with a sustainable production volume is the most important goal. Therefore, one hypothetical policy strategy might be for policy makers to set a two-stage 5–10 year programmatic goal: first, to achieve a liver ORT with a minimum 6-month durability and second, to develop the technology to achieve a minimum production volume of 500 ORTs per year.
CONTACT INFORMATION
James E. Stahl, MD, CM, MPH (James@mgh-ita.org, jstahl@partners.org), Assistant Professor, Department of Medicine, Harvard Medical School; Assistant Physician, Department of Medicine, Massachusetts General Hospital, 101 Merrimac Street,10th floor, Boston, Massachusetts 02114
Joseph P. Vacanti, MD (jvacanti@partners.org), John Homans Professor of Surgery, Department of Pediatric Surgery, Harvard Medical School; Surgeon in Chief, Pediatric Transplantation, Massachusetts General Hospital, 15 Fruit Street, Boston, Massachusetts 02114
Scott Gazelle, MD, PhD, Professor, Department of Health Policy and Management, Harvard School of Public Health; Professor, Department of Radiology, Massachusetts General Hospital, 101 Merrimac Street, 10th floor, Boston, Massachusetts 02114