


Introduction
The requirements of higher throughput and data rates from consumers have forced modern telecommunication systems to move toward the employment of higher operating frequencies. The evolution of technology and industry, especially the Internet of Things and Industrial Revolution 4.0, has pushed communication services to expand and rise to another level [Reference Ghosh, Maeder, Baker and Chandramouli1]. The development of 5G technology aims to increase bandwidth and effectively support more devices at the same time. In other words, this communication technology aims to provide lower latency with high data rate services [Reference Andrews, Buzzi, Choi, Hanly, Lozano, Soong and Zhang2, Reference Vora3].
However, atmospheric phenomena must be considered when designing microwave line-of-sight (LOS) links in higher-frequency bands, particularly transmission links that are more than 10 GHz. Atmospheric phenomena such as rain, clouds, and water vapor could result in impairment of the transmission link. Among these phenomena, rain is the most dominant factor. It contributes to more severe impairment for radio links in heavy rain regions. In tropical regions such as Malaysia, heavy rainfall is common and high humidity prevails throughout the year. Moreover, rain attenuation on any path is highly dependent on frequency, path length, and polarization as well as specific attenuation contributed from raindrop size distribution (DSD).
In general, rain attenuation can be measured by a beacon or radiometer or predicted using models. Several prediction models have been proposed and developed by propagation researchers to estimate rain attenuation in both terrestrial and satellite communication links. The international telecommunication union recommendation (ITU-R) model has been widely used, owing to its higher global reliability. Nevertheless, other models have been shown to provide high accuracy, taking local data into consideration. The synthetic storm technique (SST) [Reference Matricciani4, Reference Mandeep5], SC-EXCELL [Reference Capsoni and Luini6], and MultiEXCELL [Reference Luini and Capsoni7] are among the models that predict rain attenuation. Rain attenuation characteristics were intensely investigated by propagation researchers over the past few years in both tropical and temperate regions. In a tropical region, Lam et al. investigated rain attenuation using DSD measurements over slant-path links via SST by means of stratiform-convective rain [Reference Lam, Luini, Din, Capsoni and Panagopoulos8, Reference Yunus, Din, Jong and Lam9]. Rain rate contour maps in Peninsular Malaysia have been produced for microwave applications [Reference Chebil and Rahman10]. On the contrary, in the temperate region, researchers focused extensively on predicting 1-min rain rate statistics from 1-h rain rate statistics [Reference Capsoni and Luini11] and predicting yearly and monthly rain attenuation statistics [Reference Capsoni and Luini12]. Also, rain attenuation for microwave links at higher frequencies has been studied by researchers in the temperate region by incorporating a regression factor and a rain-rate adjustment factor in the proposed prediction model [Reference Shrestha and Choi13, Reference Lu, Zhao, Wu, Lin, Thiennviboon, Zhang and Lv14]. In recent years, research has focused on 5G communication systems. Shayea et al. studied rain attenuation for 5G networks using real measurement in Malaysia.
This paper presents monthly statistics and rain attenuation contour maps and it proposes a rain fade margin for the 5G network in Peninsular Malaysia. The rest of this paper is structured as follows. Section “Background of study” summarizes the background of the study, and the methodology is briefly explained in Section “Methodology.” Section “Results and discussion” presents the results and discussions of the monthly statistics and rain attenuation contour map. Finally, a conclusion is drawn in Section “Conclusion.”
Background of study
The rain rate is the main element in predicting rain attenuation. Commonly, rain rate statistics with 1-min integration time provide more meaningful results with respect to the rapid signal fluctuation as compared to the 1-h integration time of the rainfall rate statistics. However, the 1-min rainfall rate is scarce and rarely available, as the dense rain-gage networks used in meteorological applications are usually recorded at a 1-h integration time. Hence, the ITU-R P.837-7 [15] model was used in this study to convert the available 1-h rainfall data from the Malaysian Meteorological Department (MMD) rain-gage network into a 1-min rainfall rate. Furthermore, due to the unavailability of the measured rain attenuation for the 5G network in Malaysia, ITU-R P.530 and SST models were employed to convert the rainfall rate statistics to rain attenuation, taking into consideration link parameters such as path length, frequency, and polarization type. The relationship between the rainfall rate and rain attenuation is explained by equation (1). This relationship is called the power-law relation, where the rain attenuation, A over a terrestrial path is the product of specific attenuation, γR (in dB/km) and the effective length of the propagated path, deff (in km). The effective length of the propagated path refers to the length of the path with rain that is distributed horizontally along the path:

ITU-R P.837-7 model
In this study, ITU-R P.837-7 has been used to estimate the 1-min rainfall rate statistics from the measured cumulative distribution of 1-h rainfall rate collected by MMD. Generally, the conversion of rainfall rate statistics from higher integration time to lower integration time is based on the movement of synthetic rain cell simulation. Yet, in a graphic user interface in MATLAB, this conversion has been developed, and it can be obtained directly from the recommendations of the ITU website. In fact, this conversion is an upgraded version of the EXCELL model in [Reference Capsoni and Luini11]. Interestingly, the genetic algorithm is required as one of the input parameters besides the geographical coordinates, percentage time of exceedance, and the rainfall rate at a different time of percentage. More details of the genetic algorithm are given in [Reference Goldberg16].
Chebil model
In 1999, Chebil developed a prediction model to estimate the 1-min rainfall rate from the 1-h rainfall rate in Malaysia [Reference Chebil and Rahman17]. This prediction model was proposed using the rain rate conversion factor, CF 60 that is defined as the ratio of the rain rate in 1-min integration time, R 1 to rain rate in 1-h integration time, R 60 at the same percentage of time, P in equation (2). The prediction model proposed by Chebil is given in equation (3) with the constraint that the percentage of the time, P is in the range of 0.001–1%:


ITU-R P.530-17 model
The terrestrial LOS link is based on the prediction method described in ITU-R P.530-17 [18]. Path length and specific attenuation play important roles in this method. As discussed earlier, the relationship between these parameters is described in equation (1). The effective path length is the hypothetical length that experiences rainfall. It is shorter than the actual path length, which introduces the path reduction factor. As a consequence, the effective path length, deff used in this method is based on the behavior of the reduction factor, which is the product of path length, d, and the reduction factor at 0.01% of time exceedance, r 0.01 as presented in equations (4) and (5):


The constant, α is the function of frequency, f in the range of 1–1000 GHz with horizontal and vertical polarizations. It can be obtained from ITU-R P.838-3 [19]. The r 0.01 represents the path reduction factor at 0.01% time of exceedance, d is the path length in km, f is the frequency in GHz, and R 0.01 denotes the rain rate at 0.01% time of exceedance. Furthermore, the rain attenuation, A exceeded for other percentages of time, p from 0.001 to 1% also be estimated from equation (6) to equation (10):

with


and

Synthetic storm technique
According to Matricciani, rain attenuation on a terrestrial link can be predicted using the SST [Reference Matricciani4]. This technique is based on physical and mathematical formulations, which can be applied to estimate the time series of rain attenuation by converting the time series of rain rate using the storm translation speed along the propagation path. Rain attenuation, A along the propagation path can be estimated if a point located along the path in the x-axis direction, xo, and the rainfall rate, R are measured at the same point. The expression of estimated attenuation is expressed in equation (11):

Changes of attenuation over time can be computed as in equation (12) by varying the initial point, xo, at the same rate to the speed, v of the rain cell:

Details of the procedure of the SST model can be found in [Reference Matricciani4]. In addition to application in terrestrial links, the performance of this prediction model has been analyzed in satellite communication links in Malaysia [Reference Lam, Luini, Din, Capsoni and Panagopoulos8, Reference Jong, Riva, D'Amico, Lam, Yunus and Din20]. Hence, this model has been well developed for both terrestrial and satellite links, as the results of this prediction model have been validated in satellite links. For this reason, the SST model has been applied in this study based on the time series of rain data in the experimental site and the reliability of this model in the terrestrial link.
Methodology
Rain rates with an integration time of 1-min were collected using a tipping bucket rain gage at Universiti Tun Hussein Onn Malaysia (UTHM) for 3.5 years along with 3 years of RD-69 disdrometer data from Universiti Teknologi Malaysia, Kuala Lumpur (UTM-KL). In addition, data with a 1-h integration time were collected using a tipping bucket rain gage in 75 other sites (more than 10 years for each site) as in Fig. 1 spread over Peninsular Malaysia. The details of each station are provided in Appendix Table A in the appendix.

Fig. 1. Locations of experimental sites.
In this study, the data collected in UTHM and UTM-KL were used mainly to develop monthly statistics in the equatorial region and validate the 1-h data collected by MMD. In the interest of ensuring the accuracy of 1-h to 1-min statistical conversion by the ITU-R P.837-7 model, the 1-min data collected in UTHM and UTM-KL were processed to 1-h rainfall rate statistics so that they have the same integration time as the data collected by MMD. The 1-h rainfall rate statistics are then converted to 1-min rainfall rate statistics by the ITU-R P.837-7 model. According to [Reference Capsoni and Luini11], this prediction method is applicable worldwide, and it is more precise than other estimation techniques like the one proposed by Chebil and Rahman [Reference Chebil and Rahman17]. As the 1-min rainfall rate statistics are obtained, ITU-R P.530-17 was applied to estimate the rain attenuation on a monthly basis. At the same time, rain attenuation was predicted from the measured 1-min rainfall rate statistics using the SST model. A comparison was made between the estimated 1-min rainfall rate statistics and the measured 1-min rainfall rate statistics to validate the accuracy of the conversion.
In this study, ITU-R P. 530-17 was chosen as the rain attenuation prediction model because it is simple and applicable worldwide. In addition, 1-min rainfall rates are not easy to obtain for all locations in Malaysia; therefore, the prediction of rain attenuation using the ITU-R model depends on the hourly rainfall data provided by MMD as input. Furthermore, with the intention to validate the reliability of the ITU-R model, the SST model was employed in this study because of its ability to adapt localized time series rain rates to produce more reliable statistics. Subsequently, the fade margin of the 5G network is proposed to network planners in the interest of maintaining signal performance based on long-term statistical results.
Testing activity is necessary to check the accuracy of the model. The appropriateness of the ITU-R P.837-7 model for converting 1-h rainfall data into 1-min rainfall data was tested for goodness of fit as recommended for ITU-R P.311 in [21]. The error of the prediction model, ɛ(P) used in the rain rate performance qualitative test is defined in equation (13), with probability levels ranging from 0.01 to 1% when both estimated and measured rain rates are available [22]:

where Rest(P) and Rmeas(P) represent the estimated and measured rain rates at the same probability level, P, and N is the total number of available probability values.
Similarly, testing activity was also performed for predicting rain attenuation using the SST and ITU-R models. This activity was performed to determine the prediction accuracy of the prediction models. The error of the prediction model, ɛ(P) of rain attenuation performance, is defined in equation (14) according to the ITU fascicle in [22] with 10 probability levels that range from 0.001 to 1% when both estimated and measured rain attenuation values are available:

where Ap(P) and Am(P) represent the predicted and measured rain attenuation values at the same probability level, P.
Rain attenuation is presented in the form of contour maps rather than line graphs. A contour map which focuses on the rain rate has been developed in [Reference Chebil and Rahman10] in Peninsular Malaysia. In this study, we presented the extended work up to the rain attenuation contour map with a specific focus on 5G operating frequencies. The maps will provide immediate graphic visualization of the 5G network performance with respect to the percentage of availability. A rain attenuation map that uses data from a 77-site rain-gage network, including UTHM and UTM-KL, is generated for the 5G network at a path length of 0.2 km. A similar procedure to estimate 1-min rainfall rate statistics from 1-h rainfall rate statistics using the ITU-R P.837-7 method was applied. Rain attenuation was then predicted using ITU-R P.530-17 before the contour map was developed. The constants k and α, both at horizontal polarizations, H used in all aspects of this study for different frequencies are obtained from DSD measurement and scattering computation [Reference Lam, Luini, Din, Alhilali, Jong and Cuervo23] as shown in Table 1.
Table 1. Coefficients of k and α

Results and discussion
As discussed in Section “Background of study,” rainfall rates are important for predicting rain attenuation. It is important to note that rainfall rate statistics could be plotted in different integration times as was done in [Reference Capsoni and Luini24]. Figures 2(a) and 2(b) show the conversion of 1-h rainfall rate statistics to 1-min rainfall rate statistics using ITU-R P.837-7 and the Chebil prediction models in UTM-KL and UTHM, respectively. In fact, Chebil used that dataset of UTM-KL to develop the prediction model. As a consequence, the results in Fig. 2(a) show that the Chebil model yields similar results and matches the measured rain rate. This shows that the 1-min rain rates estimated using the ITU-R model are close to the measured 1-min rain rate statistics, especially for the UTHM station. Figure 3 shows the error of the rain rate prediction model for UTHM and UTM-KL stations. Positive errors indicate that the prediction model is overestimated, and negative errors indicate underestimation. The error of the prediction model is 1.47% at 1% of time, −36.26% at 0.1% of time, and −5.10% at 0.01% of time in UTM-KL site. However, the errors of the rain rate prediction model at 1, 0.1, and 0.01% are in accordance with 140.82, −9.65, and 1.96%, respectively in UTHM. However, the error exceeded 10% at 1% of the time in UTHM. This might be because the prediction model provides long-term predictions because the input it receives is long-term data.

Fig. 2. Conversion of 1-h rainfall rate statistics to 1-min rainfall rate statistics in (a) UTM-KL and (b) UTHM.

Fig. 3. Error of the rain rate prediction model for UTHM and UTM-KL stations.
The worst-case scenario for the 5G network was considered where the rain fade is critical to horizontal polarization because of the increase of the size of the raindrops. Figures 4(a) and 4(b) compare the rain attenuation statistics from rainfall rate conversion using the two prediction models, SST and ITU-R, at frequency 28 GHz, horizontally polarized and 0.2 km path length in UTM-KL and UTHM. In UTM-KL, 13.85 dB is accounted for when the SST model is used and 13.57 dB of rain attenuation by the ITU-R model at 0.01% of the time. At 0.01% of the time, the SST model records 9.77 dB, whereas 9.66 dB is recorded by the ITU-R model in the UTHM site. The results show that both models can be used to predict rain attenuation for 5G communication systems in tropical regions, as both the SST and ITU-R models follow closely with each other in both experiment sites. Hence, it is agreed that the path length for the 5G network is as short as 0.2 km as was discussed in [Reference Rappaport, Sun, Mayzus, Zhao, Azar, Wang and Gutierrez25]. Figure 5 shows the error of the rain attenuation prediction model in both UTHM and UTM-KL sites. Once again, the prediction model gives positive errors if the predictions are overestimated and negative errors when the predictions are underestimated. At 1% of the time, an error of 70.10% is obtained in UTHM, but only 54.18% is recorded in UTM-KL. The justification for the error exceeding 10% could be that the long-term input distribution of rain rates resulted in long-term predictions by the prediction model. In UTHM, the error decreased to −13.43 and −3.10% at 0.1 and 0.01% of time, respectively. In UTM-KL, the error was −25.80% at 0.1% and 3.49% at 0.01% of time. At 0.001% of time, the error achieved 25.37% in UTHM and 42.22% in UTM-KL. This shows that the ITU-P.530-17 model is suitable for use in the monthly analysis in this study because the predictions from the ITU-R and SST models are comparable. Despite that, the SST model was employed in this study to compare the rain attenuation statistics for UTHM and UTM-KL stations, but it was not employed throughout the analysis for all locations because of the unavailability of 1-min rain data. It is also worth mentioning that 1-h resolution rainfall data are widely available from meteorological agencies that use them in meteorology applications, whereas propagation application requires 1-min rainfall intensity, which corresponds to the signal fluctuation. Hence, the conversion of 1-h rainfall data to 1-min rain intensity is crucial. In fact, the SST model uses the local 1-min rain rate as the input parameter. This can reflect the dynamic of signal fluctuation as well as the local peculiarities of rain attenuation, and it is much more reliable in producing statistics than the ITU-R model.

Fig. 4. Comparison of rain attenuation statistics using the SST and ITU-R models in (a) UTM-KL and (b) UTHM.

Fig. 5. Error of rain attenuation prediction model for the UTHM and UTM-KL stations.
Monthly rain attenuation statistics predicted for 5G networks operating at a frequency of 28 GHz and a path length of 0.2 km have been estimated using the SST and ITU-R models, as presented in Figs 6 and 7 for both UTM-KL and UTHM sites. The result in UTM-KL shows that the lowest rain attenuation occurs in July, whereas February recorded the highest rain attenuation at 0.01% of the time when the SST model was used. At the same time, August recorded the lowest rain attenuation, and the highest rain attenuation was recorded in March when the ITU-R model was applied. In UTHM, the lowest rain attenuation was recorded in March when the SST model was used. On the contrary, the lowest rain attenuation was recorded in February when predicted using the ITU-R model. At 0.01% of time exceedance, May recorded the highest rain attenuation when the SST model was applied, and when the ITU-R model was used, the highest rain attenuation occurred in October. The results show that rain attenuation varies with the geophysical and atmospheric dynamics at a particular location and when different equipment is used. The monthly statistics show that the predicted monthly outcome presents a clear view of monthly variability, and they are more reliable than yearly statistics in the equatorial region operating at the 28 GHz link. This agrees with the study of Carlo and Luini [Reference Capsoni and Luini12].
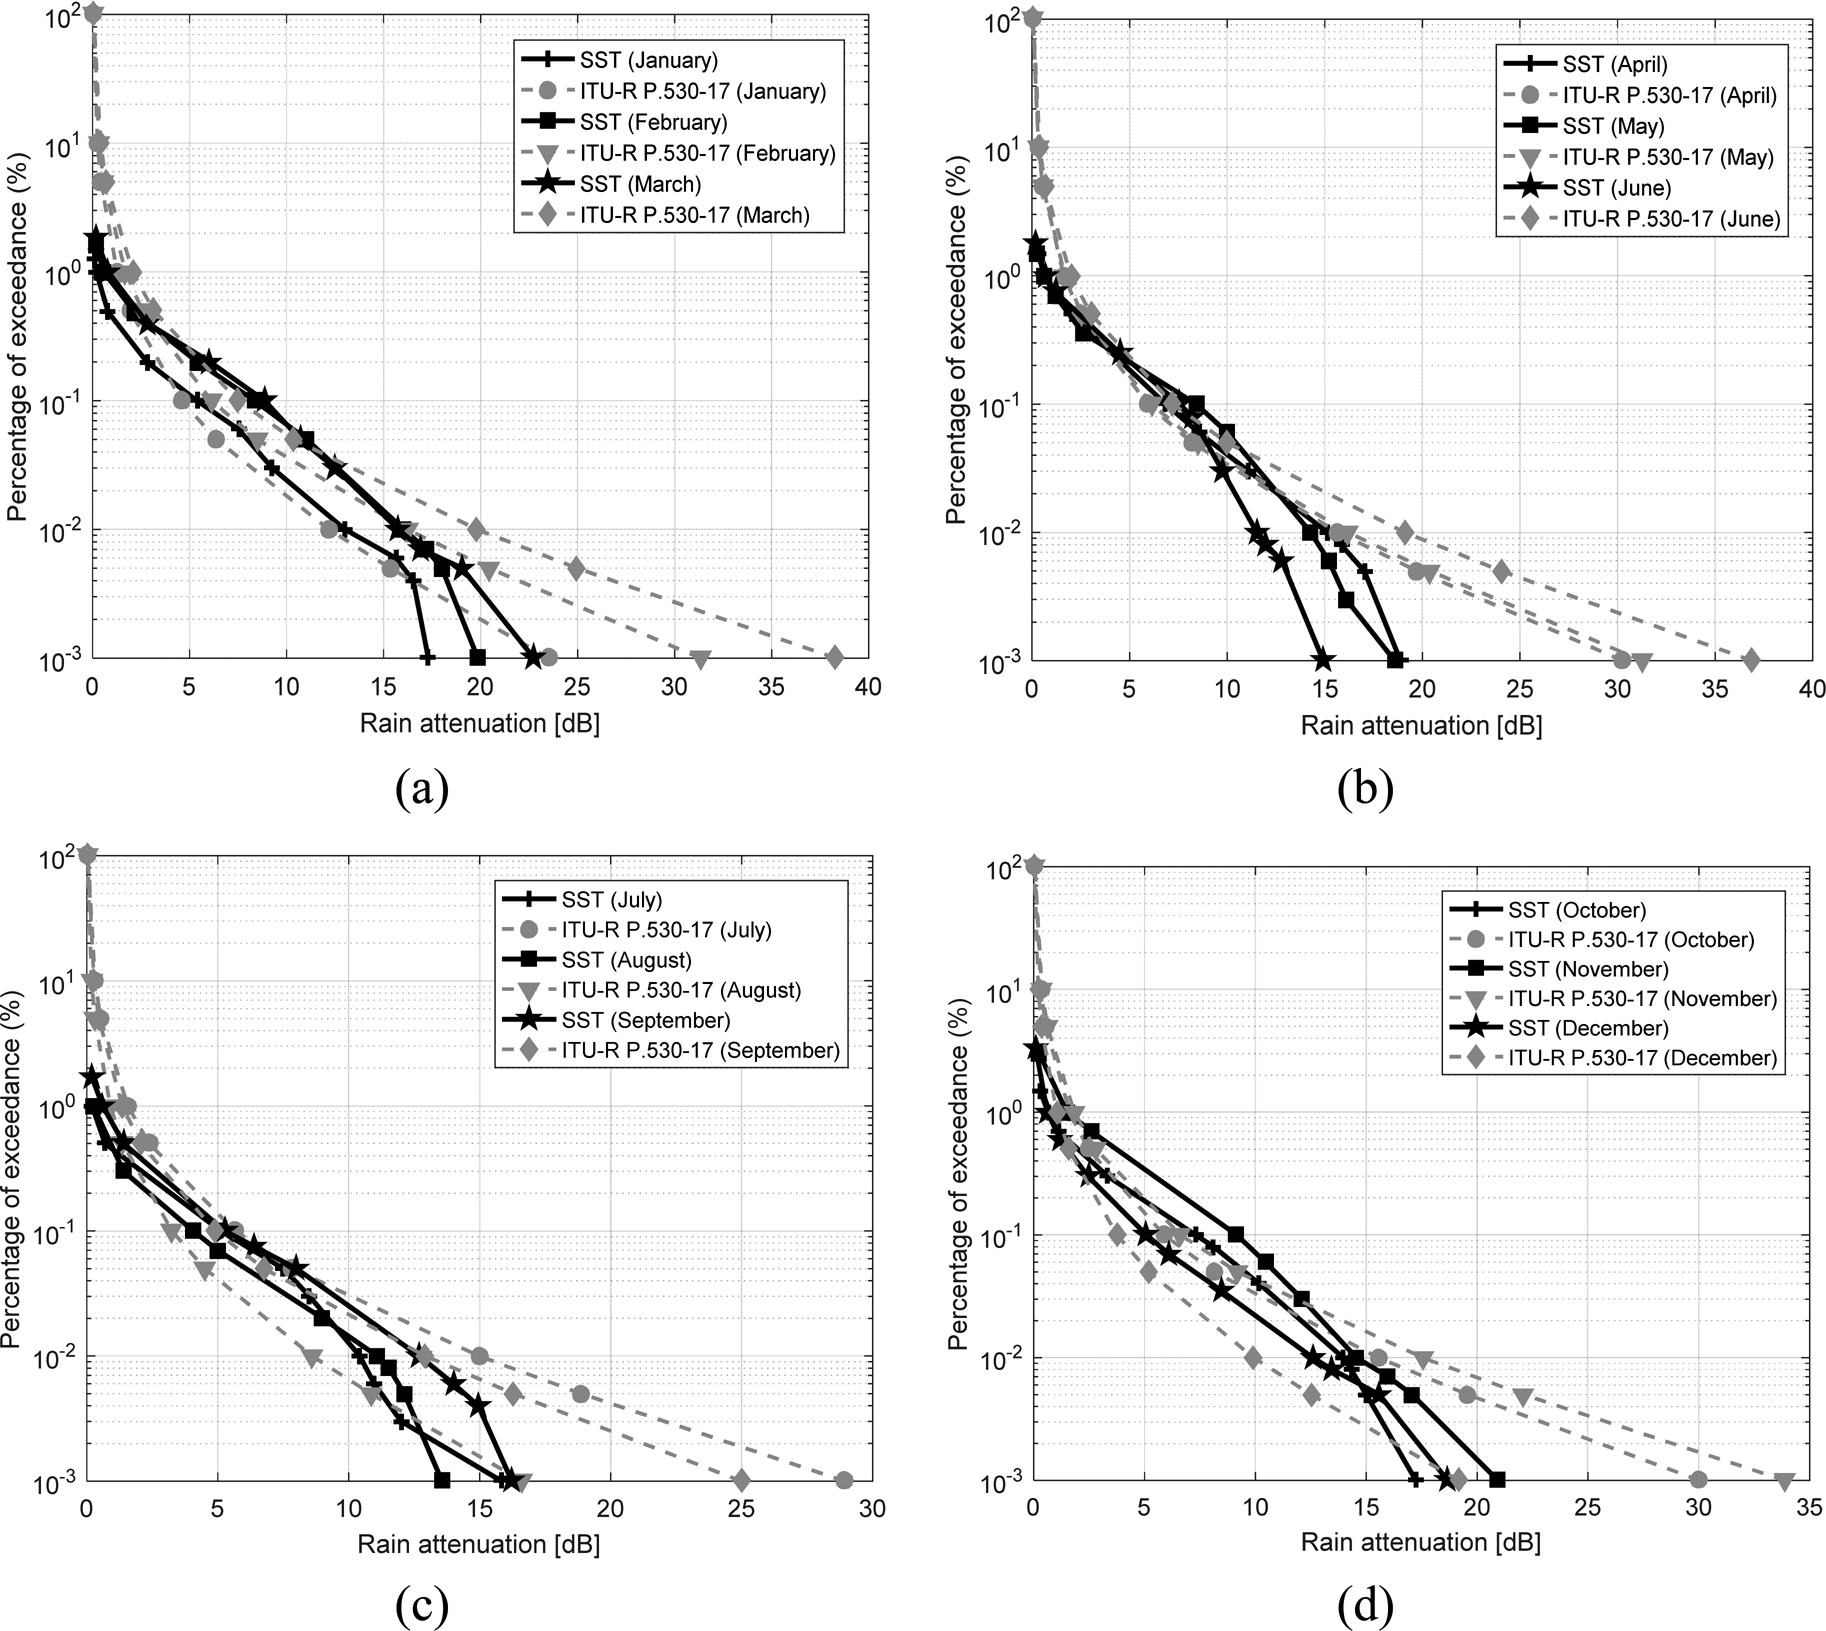
Fig. 6. Monthly SST and ITU-R predicted rain attenuation statistics in UTM-KL: (a) January–March, (b) April–June, (c) July–September, and (d) October–December.

Fig. 7. Monthly SST and ITU-R predicted rain attenuation statistics in UTHM: (a) January–March and (b) April–June, (c) July–September, and (d) October–December.
Table 2 summarizes the proposed rain fade margin in dB at different frequencies and different polarizations when the worst-case scenario is considered in Peninsular Malaysia. Meanwhile, Tables 3 and 4 show the proposed monthly rain fade margin for UTHM and UTM-KL stations, respectively. The results suggest that the communication system could set the optimum fade margin according to monthly variations and geographical locations.
Table 2. Summary of proposed rain fade margin in dB

Table 3. Rain fade margin in dB by month at 28 GHz and 0.2 km path length with horizontal polarization in UTHM

Table 4. Rain fade margin in dB by month at 28 GHz and 0.2 km path length with horizontal polarization in UTM-KL

Figure 8 presents the rain attenuation contour map at 0.01% of time exceedance at a frequency of 26 GHz. The attenuation values, A 0.01, of all locations have been labeled on top of the contour lines. It is estimated that for 99.99% of the data, the rain attenuation in the equatorial region at 26 GHz transmission link is as low as 6.50 dB, and the highest estimated rain attenuation is about 10 dB. As the frequency increases to 28 GHz as shown in Fig. 9, the rain attenuation at 0.01% of time exceedance records the lowest attenuation of 7 dB in this region, and it could reach as high as 11 dB in some locations in the region. In other words, the rain attenuation for the 5G network varies in the range from 6.50 to 10 dB and from 7 to 11 dB, depending on location, for 26 and 28 GHz links. This result indicates that the rain fade margin for the 5G network is in the range of 6.50–11 dB at 26 and 28 GHz links. Hence, the results obtained from the rain attenuation contour map for the 5G network based on prediction attenuation could provide an overview of the fade margin system across Peninsular Malaysia.

Fig. 8. Rain attenuation contour map at 0.01 percentage of time in 26 GHz predicted for 5G network.

Fig. 9. Rain attenuation contour map at 0.01 percentage of time in 28 GHz predicted for 5G network.
Conclusion
This study provides crucial information on rain attenuation in Peninsular Malaysia. Various analyses have been performed with respect to the model used in this study before it is employed for prediction and analysis. The analysis suggests that a 1-h rainfall rate can be accurately used for rainfall data analysis on a monthly basis as it is more reliable than yearly statistics. Furthermore, as little as about 14 dB of rain attenuation is obtained at 0.01% of the time for short paths. In addition, an optimal rain fade margin of 6.50–10 dB at 26 GHz link and 7–11 dB at 28 GHz link is proposed, based on the information in the rain attenuation map. These findings are of great significance for implementing 5G cellular telecommunications in heavy rain areas, as this study shows the optimal way to predict the performance of a 5G network with respect to the rain fade margin. It employed a combination of widely available local rain data and a highly accurate propagation model. Such outcomes indirectly address the need of societies and communities to remain linked at all times as 5G plays an important role in socio-economic development. It increases the productivity of work, improves healthcare by implementing e-healthcare services, and supports communication between families and friends.
Acknowledgements
This study was supported and funded by the Ministry of Higher Education under CRG Vot No. K262 and FRGS-RACER Vot No. K157, and Universiti Tun Hussein Onn Malaysia (UTHM) under Tier 1 Vot No. H262 and REGG Vot No. H885.
Appendix
The station number in the first column of Appendix Table A refers to the station drawn in Fig. 1.
Table A. Location of experimental sites

 Shi Jie Seah was born in 1994 in Kedah, Malaysia. She received her Bachelor degree in Electronic Engineering majoring in communication from Universiti Tun Hussein Onn Malaysia, in 2018. She is currently pursuing her Master degree in Electrical Engineering in Universiti Tun Hussein Onn Malaysia. She is a researcher in the area of satellite communication during her master degree study.
 Siat Ling Jong received her Bachelor degree in Electrical Engineering from Universiti Tun Hussein onn Malaysia (UTHM) in 2007. After that she obtained scholarship to pursue her Master and Doctorate degrees in Electrical and Communication Engineering in the field of radio wave propagation for satellite communication systems in Universiti Teknologi Malaysia (UTM) in 2009 and 2015, respectively. In 2007, she joined UTHM as an assistant lecturer. In 2012 and 2013, she obtained research attachment grant to Politecnico di Milano, Milan, Italy to do her research on rain effects and fade dynamics on satellite communication links. Since 2015, she is a lecturer in Electronic Communications at UTHM. Her research interests include rain attenuation, atmospheric science, radio wave propagation for satellite communication and terrestrial systems. Since July 2015, she involves in an experimental activity of a Ka-band propagation measurement campaign in close collaboration with European Space Agency, Joanneum Research (Austria) and UTM.
 Hong Yin Lam received his Ph.D. degree from the Universiti Teknologi Malaysia (UTM), Johor, 2013, in Electrical Engineering. He is currently a senior lecturer at the Department of Electrical Engineering Technology, Universiti Tun Hussein Onn (UTHM). His research activities has been relative to the field of radio wave propagation through the atmosphere, with specific focus on rain for propagation applications such as performance of SatCom and terrestrial wireless link systems
 Jafri Din received his B.Sc. degree in Electrical Engineering from Tri-State University, Indiana, USA, in 1988, and his Ph.D. degree from Universiti Teknologi Malaysia (UTM), Johor, Malaysia, in 1997. He has been the Head of Departments, Undergraduate Academic Manager and the Deputy Dean (Development) in Faculty of Electrical Engineering (FKE), UTM, from 2008 to 2015. He is currently the Director of Wireless communication Centre and a full professor at UTM. His research activities have been correlated with the fields of radio wave propagation, satellite propagation, high altitude platform station (HAPS), satellite TV broadcasting, weather radar and sound techniques for fisheries industry.


