I. INTRODUCTION
The measurements of the plasma density, the electron density profile but also density fluctuations, are essential for magnetized fusion plasma studies. Magnetic fusion research aims to produce energy by fusing hydrogen isotopes (deuterium-tritium) in helium. Tokamaks were invented by the Soviets in the 1950s. They are the most successful devices. They confined hot plasma by strong magnetic fields [Reference Wesson1]. Derived from radar principle, the first application of reflectometry to magnetized fusion plasmas was realized in France in the 1980s [Reference Simonet2, Reference Bottolier-Curtet and Ichtchenko3].
Rapidly, due to the small size of waveguide and the flexibility of microwave systems, reflectometry became a common diagnostic on magnetic fusion devices to measure the density profile [Reference Laviron4] and density fluctuations [Reference Mazzucato5]. However, first reflectometers suffer from phase jamming caused by plasma turbulence. Solid-state components that appeared on the civil market in the 1980s led to a technical revolution. Based on solid-state components, we developed a new generation of reflectometers for Tore-Supra tokamak.
The paper is organized as follows. The reflectometry principles are first recalled, the schematic set up of Tore-Supra reflectometers is then presented, and then the characteristics of the main/key components/elements are given. The last part deals with density profile reconstruction, illustrating the great potential of Tore-Supra reflectometers.
II. THE PRINCIPLES OF REFLECTOMETRY
A) Propagation of a microwave beam in plasma
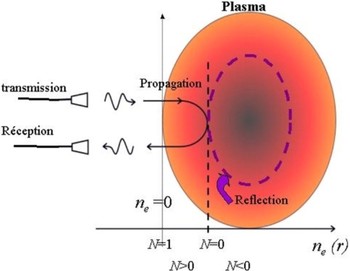
In non-magnetized plasma, an electromagnetic wave propagates if its frequency f is above the plasma cut-off frequency f pe that is proportional to the local electronic density n e: ![]() . When the wave reaches the cut-off layer where f = f pe, the optical index N vanishes and the wave is reflected (Fig. 1).
. When the wave reaches the cut-off layer where f = f pe, the optical index N vanishes and the wave is reflected (Fig. 1).

Fig. 1. Propagation of a microwave beam up to the cut-off layer.
In fusion plasma, the electronic density n e increases from the edge to the core of the plasma. Its average value is in the 1019 m−3 range (i.e. a million times less dense than air) giving cut-off frequencies in the millimeter domain.
Increasing the frequency makes the wave to be reflected deeper inside the plasma. Sweeping the frequency allows to probe the plasma from edge to core but also to measure the time delay as for FW-CW radars.
In magnetized plasmas, two polarizations can propagate. When the wave's electric field E is parallel to the tokamak magnetic field B (ordinary mode), the cut-off frequency equals f pe like in non-magnetized plasmas. In the extraordinary mode, E⊥B, there are two cut-off frequencies that depend also on the magnetic field B. The upper cut-off presents the advantage of being able to measure very low densities in the plasma's edge. It accesses also the plasma core where the density is flat because in a tokamak the magnetic field increases from the outer to the inner side (B ∝ 1/R, R being the tokamak major radius). The lower cut-off frequency is below the plasma frequency f pe. This cut-off is not often used on present tokamaks but it is foreseen for ITER where plasma conditions will prevent core accessibility in ordinary or upper X-mode.
III. FREQUENCY SWEEP REFLECTOMETERS ON TORE SUPRA
A) Sources
The first reflectometers were based on the backward wave oscillator (BWO). The BWO full band was swept in one millisecond. The measurements were not reliable because the sweeping time was much longer than the characteristic time of plasma turbulence (10 µs). We chose to reduce substantially the sweeping time in order to “freeze” the plasma during the measurement like a photograph with a very short exposure time. In the 1990s, broadband voltage control oscillators (VCOs) below 20 GHz were available as well as the active frequency multipliers needed to reach the millimeter domain [Reference Silva6–Reference Wang8].
B) Choice for block diagram
The choice of our microwave setup was guided by two objectives: a much faster sweeping time and an heterodyne detection. In heterodyne detection, the reference and received frequencies are different to reduce the mixer noise [Reference Hartfuss, Geist and Hirsh9]. Two sources and a fast (considering the sweeping time) phase lock loop such as developed for Asdex-Upgrade reflectometer [Reference Silva6] was a first solution. However, with this setup it is difficult to decrease the sweeping time below 50 µs. With the same source for transmission and detection the sweeping time can be very short, but one frequency must be shifted. This could be simply done by introducing a large path difference between the reference and transmission lines as on DIII-D reflectometer [Reference Wang8]. We opted for frequency modulation because it produces a fixed and very stable intermediate frequency. A prototype 26–36 GHz reflectometer showed that a sweeping time of 10 µs improves the measurements and the reliability [Reference Moreau7]. It showed also that the signal-to-noise ratio was improved by 30 dB compared to the homodyne BWO reflectometers. After this validation, a new generation of reflectometers was developed for density profile measurements [Reference Clairet10, Reference Sabot11].
All of our reflectometers are designed according to the block diagram shown in Fig. 2, with a low-frequency source, a single side band modulator (SSBM) on the transmission line, frequency multipliers, and a heterodyne detection.

Fig. 2. Block diagram of a fast sweeping heterodyne reflectometer.
C) Frequency multipliers
To reach the desired output frequency, the VCO frequency is multiplied by a k factor of 3, 4, 6, or 9. In Q band (33–50 GHz), the output power reaches 20 dBm. In V (50–75 GHz) and W bands, it approximates 15 dBm. Above 110 GHz, the last multiplication stage is passive and the output power does not exceed 5 dBm.
D) Single side band modulator
A 100 MHz quartz oscillator provides the modulation frequency f m. A high-performance SSBM ensures a rejection of the image frequency and other side bands below the −25 dBc level that is required for a use with multipliers [Reference Sabot12]. As shown in Fig. 3 for the 50–75 GHz quadrupler, the power of the emitted frequencies delivered by a multiplier can be considered as coming entirely from the frequency shifted k. (F + f m). Figure 3 is a representation after demodulation of the spectrum emitted by a quadrupler. The power of the 4F + 4f m signal is well above all other side bands; the 4F − 4f m image frequency being rejected to −60 dBc.

Fig. 3. Output spectrum of a V band multiplier (k = 4) set up behind an SSBM modulated at 100 MHz after down conversion.
E) Reception
In order to reduce the thermal noise and to ensure a higher rejection of the harmonics, a second multiplier (xk′) is inserted before the mixer. Below 75 GHz, balanced mixers are used. In W and D bands, the multiplier output power is not high enough to drive a balanced mixer; third-harmonic mixers are used with conversion losses around −15 to −20 dB. The signal is then filtered and amplified.
A balanced mixer would not noticeably improve the signal-to-noise ratio, because above 75 GHz the plasma radiation is comparable to the mixer thermal noise. Indeed, the plasma radiates in the microwave range due to the gyration motion of the electrons in the magnetic field. At nominal magnetic field (B 0 = 3.9 T in the center), the cyclotron frequency varies between 75 and 150 GHz. In this frequency band, the plasma can be viewed as a black body radiating at the temperature of the plasma (108 K). The radiation power is significant: up to −115 dBm/Hz. This emission can be used to measure the plasma's temperature with microwave radiometers [Reference Segui13]. This emission is however in the orthogonal polarization, making the plasma noise and the mixer thermal noise comparable (~ −160 d Bm/Hz). Because of this plasma emission, the signal-to-noise ratio cannot be improved by amplifying the reflected signal contrary to the standard radar technique.
A delay line compensates for the return path of the wave between the antenna and the edge of the plasma.
F) Acquisition
To measure the density profile, the reflectometer is full band linearly swept. The propagation time in the plasma τ is several tens of nanoseconds (τ < 50 ns). The sweeping lasts 20 µs in the Q, V, and W bands that principally probe the plasma edge, and lasts 40–60 µs in the D band that reaches the plasma center. The bandwidth or the beat frequency F b = τ(t) middot (ΔF/Δt) stays thereby below 50 MHz.
A good measurement of the phase is essential for profile reconstruction. An I/Q demodulator extracts the phase Φ (t) by generating two signals in quadrature (amplitude and phase) A(t).cos(Φ(t)) and A(t)sin(Φ(t)). The signal is sampled at 100 MS/s. Acquisition cards can store up to 5000 measurements per plasma discharge. Measurements are usually sampled regularly throughout the discharge: the duration of the discharge varies from 10 s to several minutes. Series of profile measurement with a dead time between two profiles reduced to 5 µs can also be performed to observe transient phenomena. This burst-working mode is fruitful to follow the plasma density evolution after a supersonic injection of gas or of an injection of a deuterium ice pellet.
G) Antennas
The antennas are outside the vacuum vessel of the tokamak and look at the plasma through a silica window. Separate antennas are used for transmission and reception. They are as close as possible (few centimeters) to the window to minimize parasitic reflections. The antenna gain is high (typ. ~ 35 dBi) to increase the amplitude of the reflected signal, the plasma edge being at about 1.2 m from the antennas.
H) Installation of the reflectometers
To minimize the waveguide losses, the millimeter components (multiplier and mixer) are installed near the antennas. When possible the transmission/reception boxes are fixed on the antennas as in Fig. 4. The V and W band profile reflectometers are connected to the antennas by 2 m oversized X band waveguides.

Fig. 4. Antennas and transmitting and emitting boxes of the D band reflectometer.
Other components (sources, detection, modulators) are deported in a tray inserted in a standard cubicle 6–10 m away. The connection to millimeter components is made with coaxial cables. The cubicle contains also the control system and the acquisition cards.
I) Measurement of density fluctuations
Reflectometry is also used to characterize the plasma turbulence by the measurement of density fluctuations. One approach is to run a reflectometer at fixed frequency and observe the displacement of the cut-off layer. The phase fluctuations induced by the displacement are proportional to the density fluctuations at the cut-off layer [Reference Mazzucato5, Reference Sabot11]. Another method consists of performing series of fast sweeps. Properties of density fluctuations are extracted from the statistical analysis of the phase fluctuations between two sweeps [Reference Heuraux14]. A Doppler reflectometer [Reference Hennequin15] also measures the density fluctuations at small scale and the rotation speed of the plasma by Doppler effect [Reference Hirsh16].
The characteristic frequency of plasma turbulence or density fluctuations is few tens of kilohertz. This bandwidth does not induce noticeable broadening of the beat frequency of Tore-Supra profile reflectometers since this latter is three orders of magnitude larger. This was not the case for BWO reflectometers for which the beat frequency did not exceed few hundreds of kilohertz.
IV. MEASUREMENT OF THE RADIAL DENSITY PROFILE ON TORE SUPRA
Tore-Supra is a superconductive tokamak with a high magnetic field (B 0 ≤ 3.9 T). The plasma is a torus with a circular cross section. The major radius R 0 equals 2.4 m and the minor radius a = 0.72 cm. The plasma current can reach 1.5 MA. Tore-Supra profile reflectometers work in the upper cut-off. They cover the band 33 to 155 GHz in four bands to measure the density profile from low (B 0 = 2 T) to high magnetic field plasmas (B 0 = 4 T).
A) The reconstruction method
Plasma is a dispersive medium; the optical index varies from 1 at the edge (n e ≈ 0) to 0 at the cut-off layer. For that, the inversion method to reconstruct the position of the cut-off layer from the time delay or the phase is recursive: the density profile being reconstructed step by step [Reference Bottolier-Curtet and Ichtchenko3].
Knowing the density profile up to the reflection layer associated to F, the phase resulting from this profile at the frequency F + dF is calculated. The difference between this phase and the phase measured for F + dF gives the density profile between the two layers of reflection F and F + dF, and so on. The calculation of the profile is automatically made after each plasma discharge.
B) The reconstructed density profiles
Figure 5 shows an example of the density profile temporal evolution measured during a plasma discharge lasting 15 s. During this discharge (B 0 = 3.7 T, I plasma = 1 MA), the central density and the central temperature reach, respectively, 3.5 × 10¹⁹ m−3 and 1.7 keV (2 × 10⁷ K). The plasma diameter is 1.5 m: the outer edge is at R = 3.2 m and the plasma center at R = 2.5 m. The spatial resolution of each profile is one millimeter, whereas the overall uncertainty on the position of the plasma is in the order of one centimeter.

Fig. 5. 2000 density profiles reconstructed with three reflectometers (V, W, and D band).
C) Recent improvements
We have recently upgraded the reflectometers in the V and W band (50–110 GHz) in order to measure the density profile in 2 µs only (ANR StudyFus Project with the University of Nancy I and the Ecole Polytechnique). The frequency sweeping speed now reaches 10 GHz/µs. The frequency modulation of the SSBM was increased to 300 MHz in order to avoid the harmonics to overlap. A faster acquisition system (running at 2 GS/s) was installed. The objective is the observation of the radial propagation of turbulence and a better characterization of density fluctuations.
V. CONCLUSION
Owing to the progress of millimeter solid-state components reflectometry now measures reliably and routinely the density profile, with a radial millimeter resolution. With a very short measurement time, it is possible not only to follow the transient phenomena dynamics but also to characterize the plasma turbulence. Reflectometry is an essential diagnostic for magnetic fusion devices. Since May 2009, three reflectometers (V, W, and D band) based on Tore-Supra block-diagram have been in operation on JET, the world largest tokamak [Reference Bottereau17].
ACKNOWLEDGEMENTS
This work was supported by the European Communities under the contract of Association between EURATOM, CEA and the French Research Federation for fusion studies. The views and opinions expressed herein do not necessarily reflect those of the European Commission. Financial support was also received from the Agence Nationale de la Recherche under contract ANR06-blan0084.
 Jean-Claude Giacalone is born in July 7 1958 in Tunisia. He graduated as a technician in electronics on June 1978. He has worked since 1984 for CEA (Commissariat à l'Energie Atomique ie French Atomic Energy Authority) in Cadarache, South of France. He started as a process supervisor in a laboratory that studied plutonium chemistry. In 1991, he shifted to X and gamma ray measurements. He worked on tomographic reconstruction and gamma scanning of nuclear fuel rods irradiated. In 1996, he received an award from the French Nuclear Society for the realisation a scanner for high density irradiated fuel rods. Since 2004, he is working on microwave diagnostics for nuclear fusion plasma. He developed a 100–155 GHz reflectometer that is the reflectometer operating at the highest frequency. Since then, he has built several reflectometers, in particular for JET the European tokamak.