


Introduction
An ultra-wideband (UWB) defined by Federal Communications Commission enables users to utilize the bandwidth from 3.1 to 10.6 GHz [1]. Within this range, the UWB antenna has been widely developed for various applications, such as military, communication, medical and industry purpose, etc. [Reference Spiliotopoulos and Kanatas2–Reference Biswal and Das5]. One of the UWB-based techniques is using an impulse radar [Reference Négrier, Lalande, Bertrand, Andrieu, Couderc, Shalaby and Desrumaux6–Reference Schires, Georgiou and Lande8]. The applications utilizing the impulse radar technique can be included near zone sensing radars, such as ground-penetrating radar [Reference Zheng, Pan, Zhang, Jiang and Wang9–Reference Turk11], medical imaging [Reference Ren, Koo, Wang, Wang, Liu and Fathy12–Reference Lee, Nowinski and Augustine15], through-the-wall penetrating radar [Reference Engin, Çiftçioğlu, Özcan and Tekin16, Reference Bektas, Ozdemir, Orhan and Turk17], etc.
The impulse radar transmits a short pulse and receives an echo pulse reflected by the target at a given distance. The echo pulse is then analyzed in terms of the time required for light to travel the distance and amplitude of the echo pulse. Using this impulse radar technique, the target, which is in the vicinity of the radar, can be easily detected and reconstructed by the two- or three-dimensional images after post-processing. Owing to the use of the wide bandwidth, the multiple targets can be distinguished with a high resolution (centimeters in a spatial resolution).
The antennas for use in impulse radar applications should transmit a temporally short pulse with a less distorted waveform to receive the clear echo pulse shape. However, the radiated waveform of most antennas is distorted by the open-end structure of the finite antenna arm [Reference Maloney and Smith18, Reference Montoya and Smith19]. To transmit the pulse with a less distorted waveform, the resistive material has been loaded since the Wu-King resistive profile has been introduced in 1965 [Reference Wu and King20]. The Wu-King resistive profile is continuous internal resistances along the normalized dipole antenna arm [Reference Wu and King20]. According to the Wu-King resistive profile, the current along the arm effectively decreases toward the end of the arm; therefore, there is ideally no source to radiate at the end of the arm. Using this profile, the radiation characteristic of the resistive monopole antenna was numerically and experimentally investigated in [Reference Maloney and Smith18]. The various loading techniques on the monopole antenna, such as resistive and capacitive profiles, were introduced and their pulse radiation characteristics were numerically explored in detail in [Reference Montoya and Smith19, Reference Montoya and Smith21]. The tapered resistive loading was also utilized for the open-ended parallel-plate waveguide antenna in [Reference Shlager, Smith and Maloney22, Reference Maloney and Smith23]. In [Reference Maloney and Smith24], the resistively loaded conical monopole antenna was numerically investigated by the finite-difference time domain method. The pulse radiating characteristics were evaluated by the reflected voltage at the feeding transmission line, radiated electric field with various angles, and gain, etc. The pulse radiating performances of the resistively loaded bow-tie antenna were numerically and experimentally studied in [Reference Shlager, Smith and Maloney25].
The variously loaded antennas for use in impulse radar applications are present as shown in Table 1. The previous studies using the resistively tapered loading technique produced a planar type of the antennas. However, for the purpose of investigating the pulse radiating performances to the three-dimensional antenna, in this work we first explored the characteristics of a wrapped resistively loaded bow-tie antenna (WRLBA). The wrapped antennas are highly attractive for the cylindrical structures. This can be used for bio-medical and industrial applications. For instance, the combined wrapped antenna with the drone arm is promising for remote sensing applications such as detecting the landmines buried in the ground or sinkholes on the road. This paper is organized as follows. In the ‘Resistively loaded bow-tie antenna’ section, the resistive loading technique together with current flow on the bow-tie antenna arm is introduced. The numerical studies of the wrapped bow-tie antenna (WBA) and WRLBA are presented in the ‘Numerical investigation of wrapped antennas’ section. In the ‘Realization of wrapped antennas’ section, WBAs are realized and investigated in terms of pulse radiating characteristics in both frequency and time domains. The communication ability of each antenna is evaluated by the transmission coefficient, group delay, and receiving waveform in the ‘Wireless link investigation of wrapped antennas’ section. The final conclusion is then given in the ‘Conclusion’ section.
Table 1. Resistively loaded antennas for use in impulse radar applications

Resistively loaded bow-tie antenna
The geometry of the resistively loaded bow-tie antenna (RLBA) as shown in Fig. 1 is designed by FEKO software [31]. The RLBA has five slots on each radiator which is connected by chip resistors. Each slot on the radiator has five resistors which are in a parallel connection in a row. The number of slots and resistor value on each slot were determined by the evaluation of antenna performances. The resistance loaded on the bow-tie antenna arm can be calculated as [Reference Maloney and Smith24, Reference Shlager, Smith and Maloney25, Reference Amert, Wolf, Albers, Palecek, Thompson, Askildsen and Whites32]
 $$R\left( {\displaystyle{\rho \over L}} \right) = \left( {\displaystyle{1 \over 2}} \right)\left\{ {\displaystyle{{\displaystyle{\rho \over L}} \over {1-\left( {{\rm \;} \displaystyle{\rho \over L}} \right)}}} \right\},\quad 0 \le {\rm \;} \displaystyle{\rho \over L} \le 1,{\rm \;} $$
where ρ is the radial distance from the drive point to the end of the arm, L is the length of the arm, and R(1/2) is the resistor value where the position of the arm is a half way of the antenna arm. And it is a scaling factor which is related to the total resistance. The total resistance was determined using a trial and error method to reduce the antenna end reflection [Reference Shlager, Smith and Maloney25]. The first step was to divide the radial distance of the antenna arm into six divisions. The second step was to calculate the R(1/2) using the total resistance of the antenna. Then, each resistance is calculated using (1). The calculated total resistances on each distributed slot of the radiator from the drive point to end of the arm are 0.1, 3.3, 7.8, 17.2, 42.1 and 440 Ω, respectively for the total resistance of 500 Ω and R(1/2) of 11.8 Ω/square. The first calculated resistance is not considered as the value is very small and it does not significantly affect the performance as reported in [Reference Amert, Wolf, Albers, Palecek, Thompson, Askildsen and Whites32].

Fig. 1. Geometry of resistively loaded bow-tie antenna.
The resistances, as a function of the normalized length, which correspond to each slot on the radiator are plotted as shown in Fig. 2(a). The current distribution of the antenna arm is shown in Fig. 2(b) as a differentiated Gaussian pulse excited at the drive point (t/τ a = 0), where the time is normalized by τ a required for waves to travel through the antenna arm. The amplitude of the current distribution gradually decreases as the pulse travels from the drive point (t/τ a = 0) to the end of the arm (t/τ a = 1).

Fig. 2. Resistive loading characteristics: (a) resistances along the normalized bow-tie arm and (b) current distribution on the normalized bow-tie arm.
Numerical investigation of wrapped antennas
The wrapped antenna characteristics are numerically explored using the method of momentum-based FEKO simulator [31]. The proposed two antennas, which are the WBA is a rolling version of the conventional planar bow-tie antenna (CPBA) and WRLBA is a rolling version of the RLBA, are considered to investigate the antenna characteristics. Here, the regular 10-sided polygon with a side length of 8 mm is used to fully roll the antenna as shown in Figs 3(a) and 3(b). The antennas have only a metallic layer with sheet resistors in between radiators to investigate how effectively the antenna itself structures affect the performances.

Fig. 3. Proposed antenna geometry: (a) WBA and (b) WRLBA – five chip resistors on each slot are loaded to connect each radiator.
The antenna performances such as pulse radiating characteristics are explored as shown in Figs 4(a) and 4(d). The reflection coefficient as a function of the normalized frequency is shown in Fig. 4(a). The normalized frequency, k 0L = ωL/c (where ω is an angular frequency, L is the length of the antenna arm, and c is the speed of light), is the electrical length of the bow-tie antenna at a given frequency [Reference Maloney and Smith18]. It is observed that, the lower frequency matching is much improved for the WRLBA. This is because the resistive loading makes the bandwidth broad [Reference Lee14, Reference Lee, Nowinski and Augustine15]. The reflection curve of the WBA repeatedly shows up and down pattern, while that of the WRLBA is shown to be more stable in the vicinity of the peak frequency where the main energy is focused.

Fig. 4. Pulse radiating characteristics of the WBA and WRLBA: (a) reflection coefficient curve, (b) reflected voltage, (c) radiated electric field in the boresight, and (d) fidelity factor as a function of various angles on the XZ and YZ plane.
In the time domain analysis, the time axis is normalized by τ a = L/c (where L is the length of the antenna arm and c is the speed of light). Here, the unit-amplitude of a differentiated Gaussian pulse is excited as a source as [Reference Lee, Nowinski and Augustine15, Reference Maloney and Smith24, Reference Shlager, Smith and Maloney25]
 $$v_{in}(t) = v_0\cdot \displaystyle{t \over {\tau _p}}\cdot e^{\left\{ {-\scriptstyle{{{(t{\rm /}\tau_p)}^2-1} \over 2}} \right\}},$$
where v 0 is the unit-amplitude of the pulse, τ p is the characteristic time which is related to the pulse width as
 $$\tau _p = \displaystyle{1 \over {2\pi f_{\,peak}}},$$
where f peak is the peak frequency of the incident spectrum. In this study, the τ p is determined to satisfy τ p/τ a = 0.159, which means that the pulse width is very narrow for excited pulse to travel the length of the antenna arm.
The reflected voltage at the drive point as a function of the normalized time is shown in Fig. 4(b). The reflected voltage in the time domain response can be computed by multiplying the transfer function by the input spectrum as follows [Reference Lee14, Reference Lee, Nowinski and Augustine15]:
 $$v_r(t)\, = \,{\rm {\cal F}}^{-1}\lsqb {s_{11}(\,f)\cdot {\rm {\cal F}}\lcub {v_{in}(t)} \rcub } \rsqb ,$$
where v r(t) is the reflected voltage, s 11(f) is the transfer function of the antenna, v in(t) is the excited voltage of (2), and  ${\rm {\cal F}}^{-1}$ and
  ${\rm {\cal F}}$ are the Fourier operators.
For both WBA and WRLBA cases, at zero of the normalized time, there is a reflected pulse which is from drive point reflection. After that, it is clearly observed that the reflected pulses are repetitive at intervals of two of the normalized time for the WBA, while those are significantly reduced for the WRLBA. Note that the interval of two of the normalized time means the round trip for the light to travel the length of the arm. In other words, for the WBA, the reflected pulse goes back from the end of the arm to the drive point and then the reflected pulse again goes to the end of the arm at intervals of two of the normalized time and so forth.
The radiated electric field in the boresight direction (θ = 180°) as a function of the normalized retarded time is shown in Fig. 4(c). Note that the retarded time is the time difference between time and the observed time at the far distance such as (t r = t − r/c), where r is the far distance observation and c is the speed of light). For both WBA and WRLBA cases, at zero of the normalized retarded time, there is a radiated pulse which is from the drive point radiation. After that the antenna end radiation is observed at one of the normalized retarded time for both cases. The pulse is then re-radiated at intervals of one for the WBA, while the re-radiated pulses are noticeably reduced for the WRLBA. Note that the re-radiated pulses are due to remaining current, which contributes to radiate the second pulse and so forth.
The fidelity factor is used for evaluating the pulse radiating performance. The fidelity factor is a quantity value that indicates how closely the two pulses resemble each other [Reference Montoya and Smith19]. The fidelity factor is determined by calculating the maximum cross-correlation between two normalized pulses as [Reference Montoya and Smith19, Reference Hojjatollah and Zahra33]
 $${\rm Fidelity}\,{\rm factor} = \mathop {\max} \limits_\tau \; \left[ {\int_{-\infty}^\infty {{\tilde{v}}_{in}(t){\tilde{E}}^r_\theta (t + x)dt}} \right],$$
where  $\tilde{v}_{in}(t)$ and
  $\tilde{E}^r_\theta (t)$ are the normalized excited pulse and radiated electric field, respectively as:
 $$\tilde{v}_{in}(t) = \displaystyle{{v_{in}(t)} \over {\sqrt {\mathop \int \nolimits_{-\infty} ^\infty {\vert {v_{in}(t)} \vert } ^2dt}}} \,\,{\rm and}\,\,\tilde{E}^r_\theta (t) = \displaystyle{{E_\theta ^r (t)} \over {\sqrt {\mathop \int \nolimits_{-\infty} ^\infty {\vert {E_\theta^r (t)} \vert } ^2dt}}}. $$
The fidelity factor of the WBA and WRLBA on the XZ (ϕ = 0°) and YZ (ϕ = 90°) planes with seven angle polarizations is calculated as shown in Fig. 4(d). The overall fidelity factor of the WRLBA is higher than that of the WBA. This is because the radiated pulse of the WBA is distorted by multiple reflections arising from the end of the arm and the drive point of the antenna. The high fluctuation of the calculated fidelity factor for the WBA is also observed compared with that of the WRLBA. It is noted that a high value and less fluctuation of the fidelity factor are desirable for short pulse radiating applications.
The boresight (θ = 180°) gain as a function of the normalized frequency is shown in Fig. 5(a). The overall gain of the WRLBA is lower than that of the WBA. This is because the power is dissipated by sheet resistors loaded on the antenna arm. The high fluctuation of the gain of the WBA shows multiple dips and peaks over the normalized frequency. This is closely related to the multiple radiations which are in or out of the phase, resulting from the radiation of the end of the arm and the drive point of the antenna [Reference Montoya and Smith19].

Fig. 5. Antenna characteristics of the WBA and WRLBA: (a) boresight (θ = 180°) gain as a function of the normalized frequency and (b) antenna efficiency as a function of the normalized frequency.
The antenna efficiency is explored as shown in Fig. 5(b). The efficiency for both antennas is observed to be increased as the normalized frequency is increased. However, the efficiency of the WRLBA is in the range of 30–62% for the 3 dB bandwidth of the excited pulse, which is very low compared with that of the WBA. The resistive antennas have relatively low gain and efficiency at the expense of the high-fidelity factor and reduced end reflections [Reference Montoya and Smith19, Reference Wu and King20].
Realization of wrapped antennas
The antennas such as the CPBA, RLBA, WBA, and WRLBA are designed by an Ansys HFSS simulator [34]. The antennas are realized by a flexible substrate (Rogers RT/duroid 5870) having a dielectric constant of 2.3 and a loss tangent of 0.0005. The dimension of the planar antennas such as the CPBA and RLBA is 130 × 100 mm with 0.13 mm thickness as shown in Figs 6(a) and 6(b). The wrapped antennas such as the WBA and WRLBA are realized by fully rolling the planar bow-tie antennas using the regular 10-sided polygon with a side length of 8 mm made of an acrylonitrile butadiene styrene (ABS) created by the 3D printer technology as shown in Fig. 7(e). The ABS material was taken out after fully wrapping the antenna. The radiator of antennas has the balanced structure which is needed to design a balun for suppressing the unwanted radiation arising from the unbalanced equipment [Reference Venkatesan and Scott35]. In this regard, the exponentially tapered impedance balun is designed by a micro-parallel strip line which has the wide band characteristic [Reference Pozar36]. The designed balun consists of the microstrip line of 48 mm and parallel strip line of 32 mm. The corresponding impedance is then gradually transformed from 50 to 90 Ω and 90 to 150 Ω, respectively.
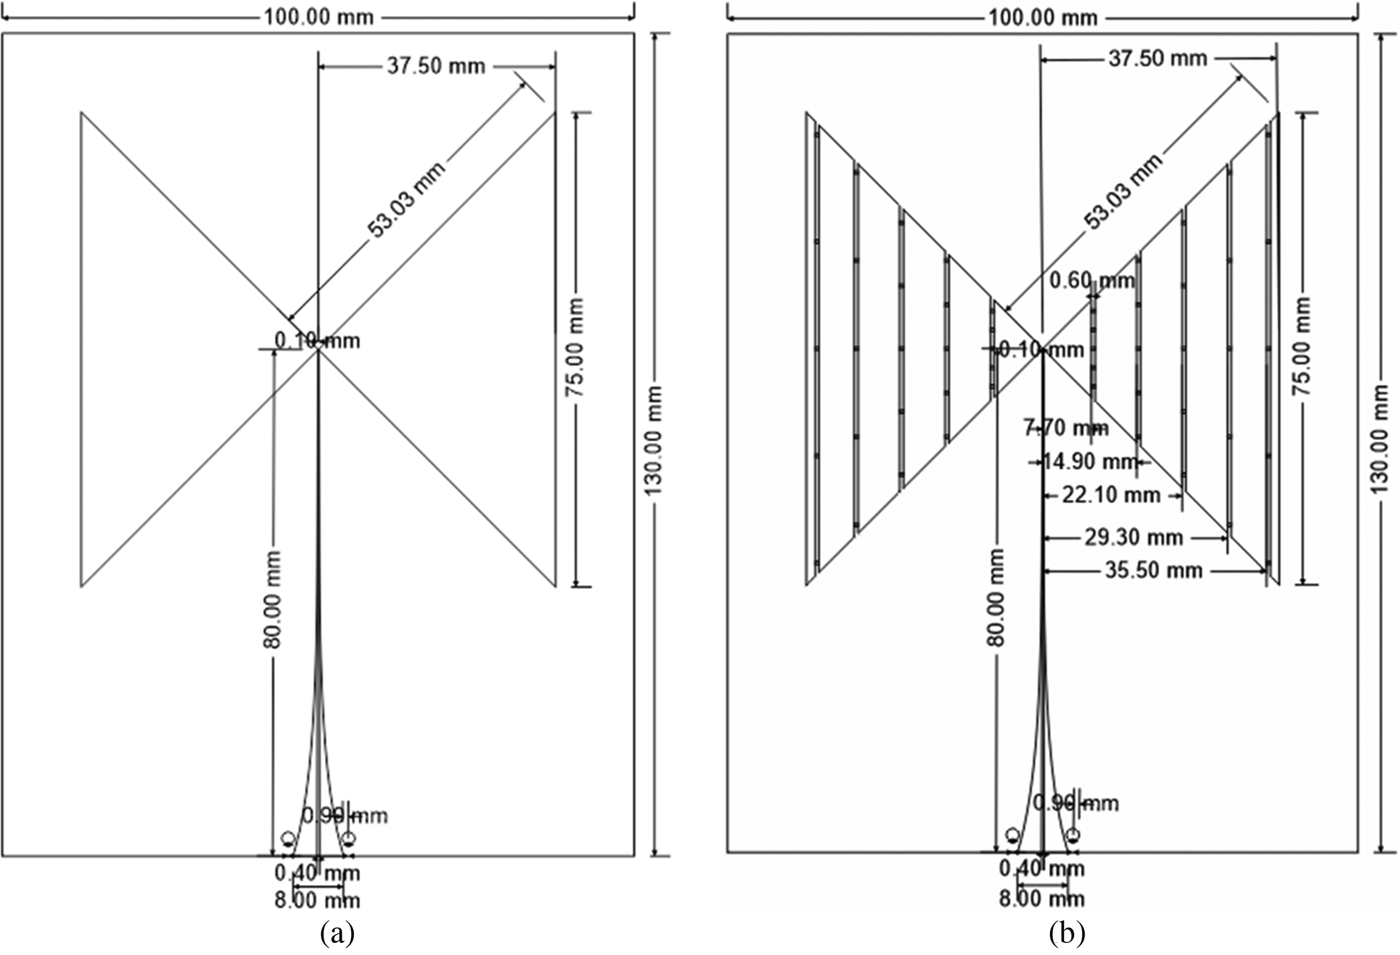
Fig. 6. Geometry of the planar antenna fed by an impedance tapered balun [Reference Lee, Melek and Shaker37]: (a) CPBA and (b) RLBA-SMD (0402 size) of chip resistors are distributed on both sides of the arm junctions.

Fig. 7. Fabricated wrapped antennas fed by an impedance tapered balun [Reference Lee, Melek and Shaker37]: (a) WRLBA on the side direction, (b) WRLBA on the front direction, (c) WBA on the side direction, (d) WBA on the front direction, and (e) scaffold to roll the antenna.
Figures 8(a)–8(c) show the characteristics of the balun in the frequency and time domains. The measurement is performed by configuring the back-to-back structure of the balun as shown in Fig. 8(a) to characterize the balun performances. The measured scattering parameters of the fabricated balun are in good agreement with simulated results as shown in Figs 8(b) and 8(c). The overall transmission characteristic is shown to satisfy −1.4 dB, while the reflection characteristic remains under −10 dB from 1 GHz to more than 10 GHz.

Fig. 8. Balun characteristics: (a) back-to-back configuration, (b) scattering parameters, and (c) time domain response.
The time domain response as shown in Fig. 8(c) is investigated by the reflected and transmitted pulse from the feeding point to the end of the balun. Here, the unit-amplitude of the differentiated Gaussian pulse with peak frequency of 2.5 GHz is excited as an incident pulse. The peak to peak amplitude of the reflected pulse is observed to be less than 0.2 V throughout the balun length. The peak to peak amplitude of the transmitted pulse is 1.7 V which has the overall transmission loss of −1.4 dB.
The planar bow-tie antennas with resistive loading and non-loading were characterized and these characteristics were compared with WBA to explore the effects of WBAs [Reference Lee, Melek and Shaker37]. On the other hand, the effects of resistive loading on WBA are explored here. The characteristics of the WBAs are presented in Figs 9(a)–9(d). The reflection coefficient curve of the WBA and WRLBA is evaluated with the excited pulse spectrum as shown in Fig. 9(a). The curve covers a range from 100 MHz to 10 GHz with 100 MHz step size. The measured and simulated results agree well each other. It is clearly observed that, the impedance matching over the lower frequencies is significantly improved for the WRLBA case in the vicinity of the peak frequency. Here, the discrepancy of the WRLBA around 2 GHz between measured and simulated reflection coefficient is observed due to the difference between the simulated and measured environment. Most of the power of the WBA is reflected around 2.5 GHz where most of the energy mainly focuses around this frequency in the excited spectrum.

Fig. 9. WBA characteristics: (a) reflection coefficient curve, (b) reflected voltage, (c) real part of the input impedance, and (d) imaginary part of the input impedance.
The antenna itself reflection is investigated when the unit-amplitude of the differentiated Gaussian pulse with a peak frequency of 2.5 GHz is excited as shown in Fig. 9(b). For both WBA and WRLBA cases, from 0 to around 1 ns, there is a reflection resulting from the balun. The radiator reflection is then observed for both antennas. The peak to peak amplitude of the reflected voltage for the WBA and WRLBA is 0.84 and 0.39 V, respectively. The corresponding dB scale of the WBA and WRLBA is −7.5 and −14.2 dB, respectively. The ringing with reflected pulse is noticeably observed for the WBA which is reflections arising from the end of the arm and the drive point of the antenna. In other words, the remaining current at the end of the arm repeatedly goes back to the drive point of the antenna and then the reflected pulse goes to the end of the arm and so forth.
The input impedance of the wrapped antennas is shown in Figs 9(c) and 9(d). One can clearly observe that the real part of the input impedance of the WBA as shown in Fig. 9(c) is relatively unstable until 4 GHz by comparison with WRLBA, which corresponds to the reflection coefficient characteristic. At higher frequency, the curve converges on 50 Ωover the wide band. In a similar way, the imaginary part of the input impedance as shown in Fig. 9(d) is stable from 1 to 10 GHz over the wide band, while that of the WBA gradually converges on zero after 4 GHz. Loading the resistors on the wrapped antenna arm controls the current flow, which eventually changes the electrical length of the antenna [Reference Lee, Melek and Shaker37].
Figures 10(a)–10(d) show the radiated electric field of the WBA and WRLBA on the XZ (ϕ = 0°) and YZ (ϕ = 90°) plane with θ polarization (interval of 30°). It is noted that, the desirable waveform of the radiated electric field for pulsed radar applications should be similar to the excited or time-derivative of the excited pulse shape [Reference Lee, Melek and Shaker37]. However, the radiated electric field of the WBA on the XZ (Fig. 10(a)) and YZ (Fig. 10(c)) planes is observed to be distorted and the re-radiated waveform is clearly observed after the main pulse. The time-derivative of the excited pulse is, however, radiated and the reduced re-radiated pulse is observed on the XZ (Fig. 10(b)) and YZ (Fig. 10(d)) planes for the WRLBA. Here, the calculated fidelity factor for the WBA and WRLBA on the boresight (θ = 180°) is 0.82 and 0.96, respectively. It can be concluded that, the resistive loading to the wrapped antenna can significantly improve the ability to radiate a temporally short pulse with a less distorted waveform which is desirable for impulse radar applications especially in the vicinity of the targets.
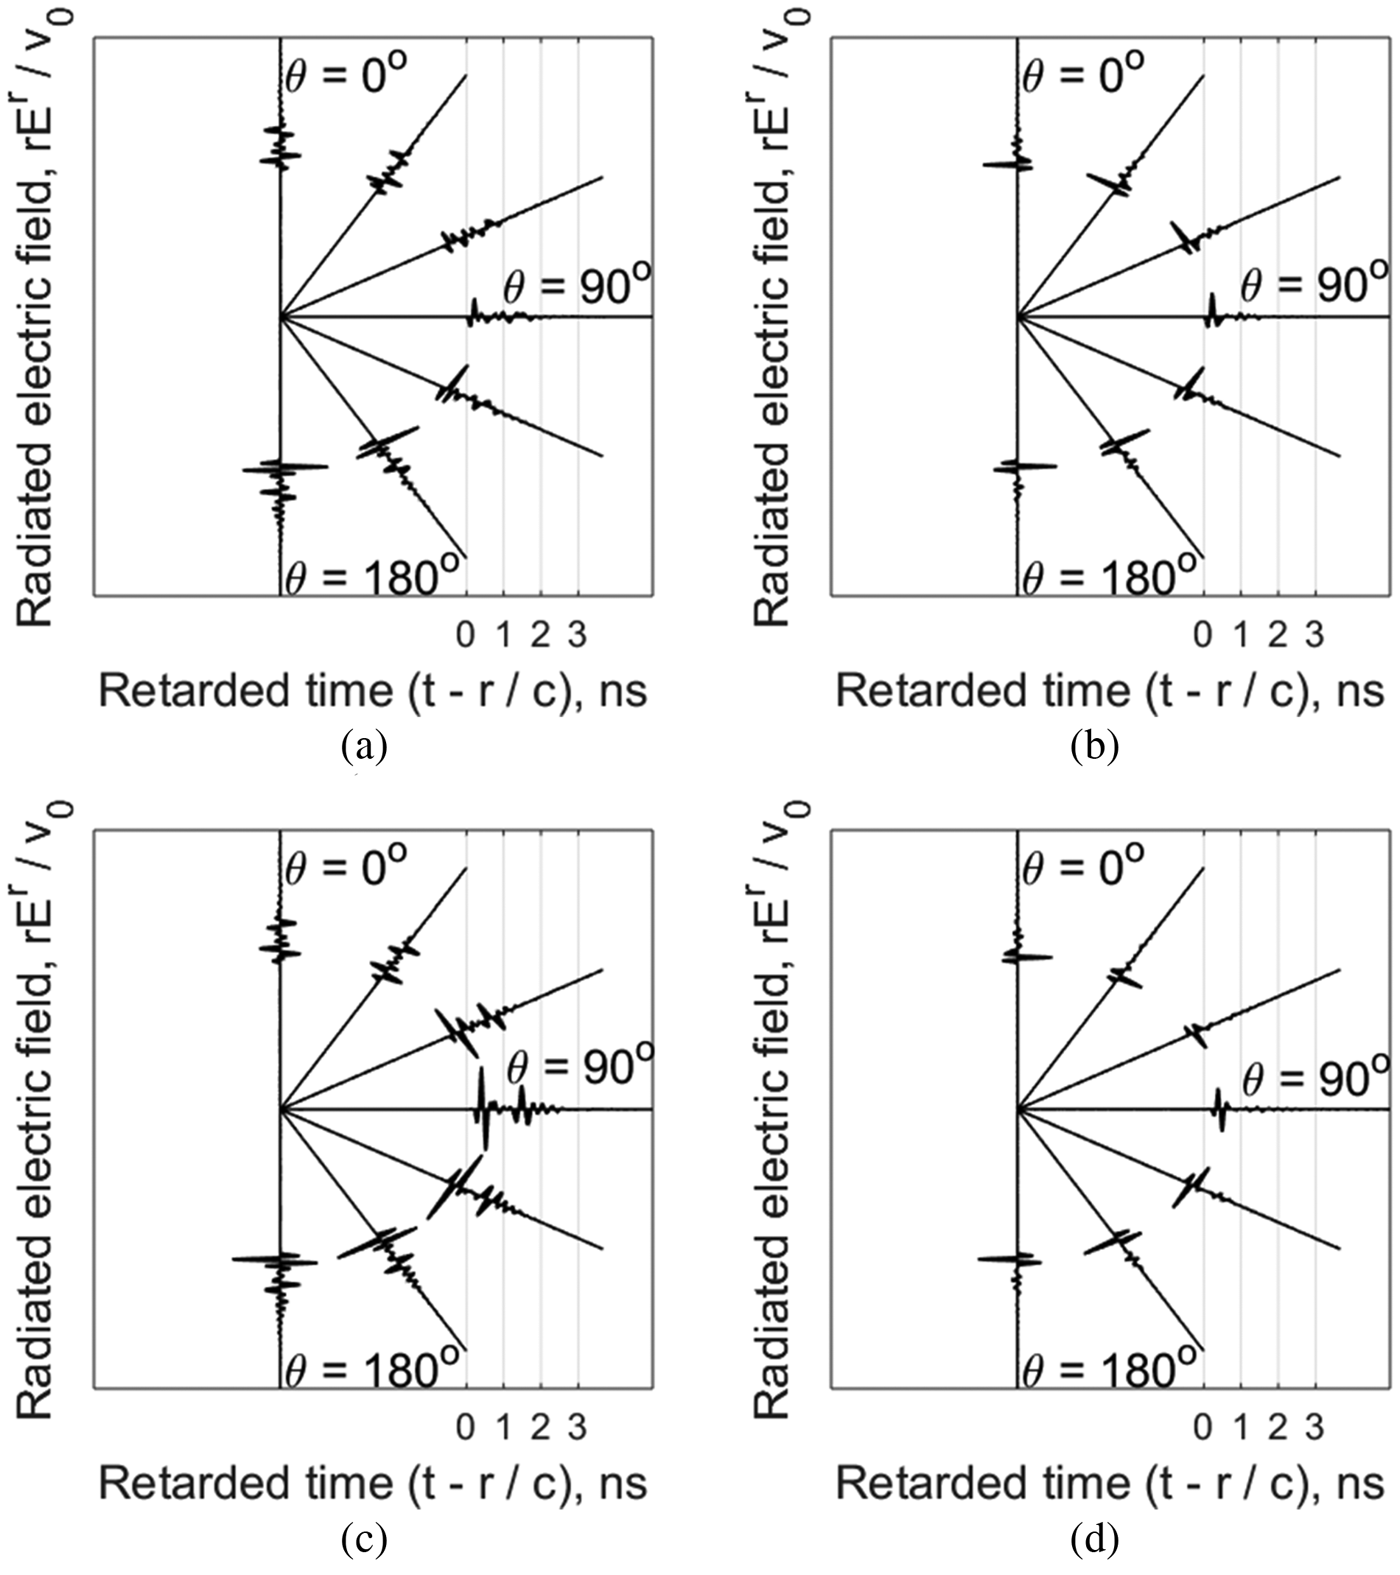
Fig. 10. Radiated electric field of wrapped antennas with θ polarization: (a) WBA on the XZ-plane, (b) WRLBA on the XZ-plane, (c) WBA on the YZ-plane, and (d) WRLBA on the YZ-plane.
The far field radiation pattern on the XZ (ϕ = 0°) and YZ (ϕ = 90°) planes withθ-polarization is plotted for various frequencies as shown in Figs 11(a)–11(h). Here, all measured patterns are normalized by the maximum value. The overall radiation pattern of the WBA and WRLBA for various frequencies is observed to be a directional characteristic which is more focused in the downward direction (θ = ±180°). The radiation pattern of the WBA on the YZ (ϕ = 90°) plane is similar to that of the WRLBA, while the radiation pattern on the XZ (ϕ = 0°) of the WRLBA is shown to be distorted compared with that of the WBA. The null point and side lobe in the pattern of the WRLBA are especially observed at 3 and 4 GHz.
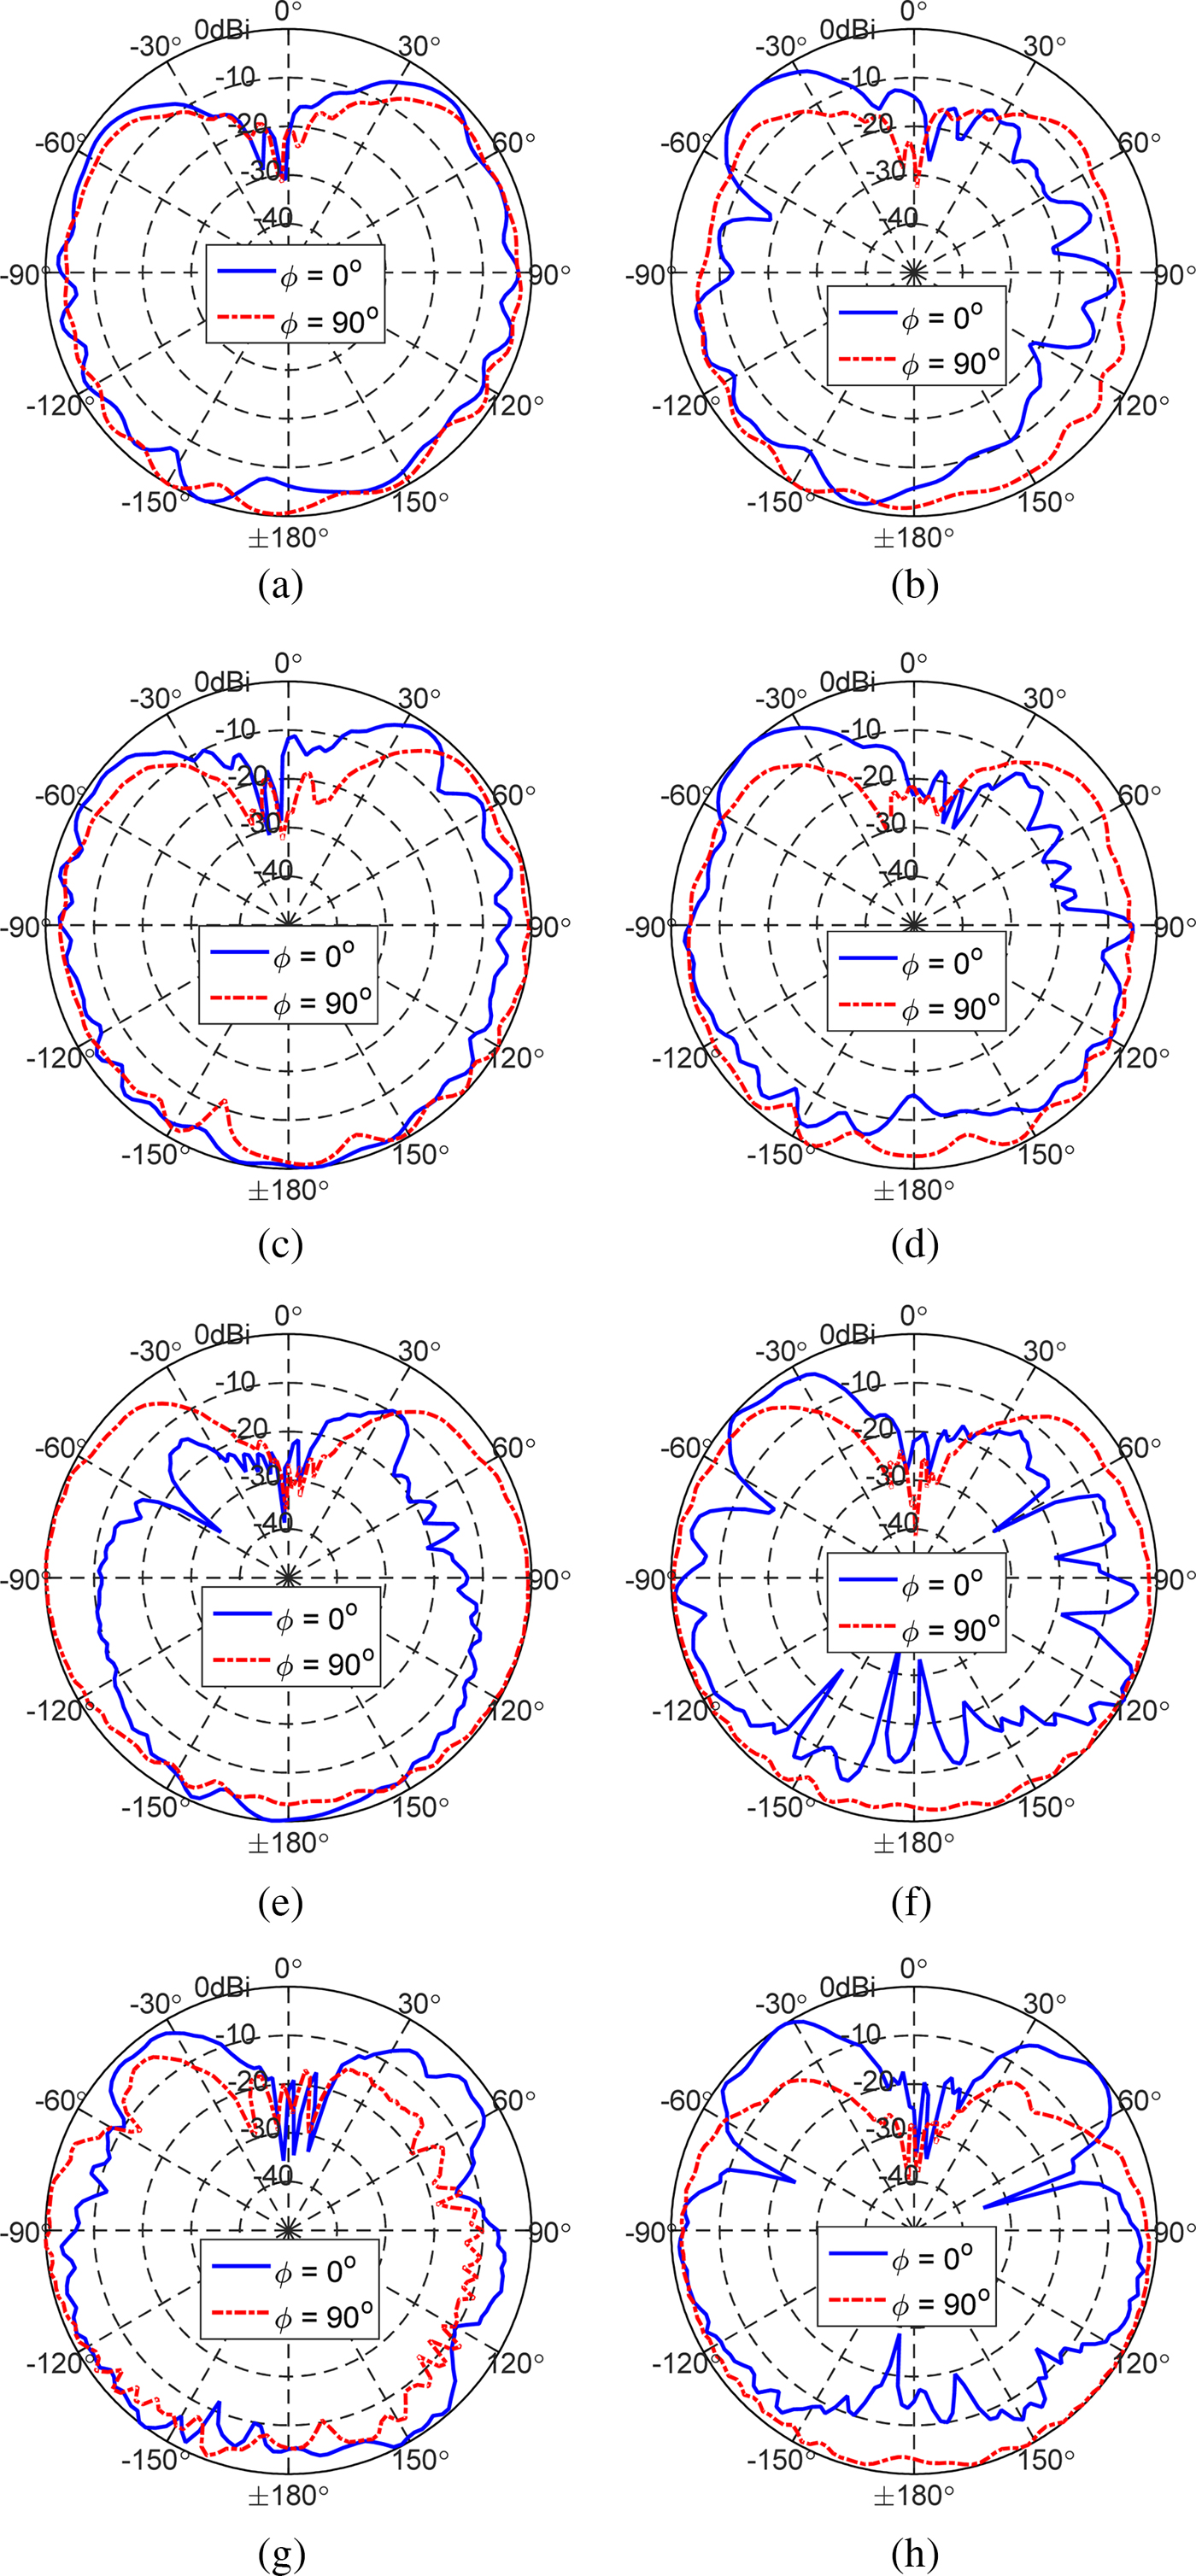
Fig. 11. Measured radiation pattern of the wrapped antenna: (a) WBA at 1.5 GHz, (b) WRLBA at 1.5 GHz, (c) WBA at 2 GHz, (d) WRLBA at 2 GHz, (e) WBA at 3 GHz, (f) WRLBA at 3 GHz, (g) WBA at 4 GHz, and (h) WRLBA at 4 GHz.
Wireless link investigation of wrapped antennas
The communication capacity of the wrapped antenna is explored by configuring the two identical antennas pointed each other as shown in Fig. 12. The two identical antennas are aligned in the boresight direction for a given distance. The transmission coefficient is then measured using the network analyzer (N5227A) and can be modeled as follows [Reference Qing, Chen and Chia38–Reference Nel, Joubert and Odendaal40]:
 $$\eqalign{S_{21}(\omega, \theta, \phi ) = \displaystyle{{Y{\rm (}\omega, \theta, \phi {\rm )}} \over {X{\rm (}\omega, \theta, \phi {\rm )}}} = &\,H_{Ant,Tx}(\omega, \theta, \phi ) \cdot H_{channel}(\omega, \theta, \phi ) \cdot H_{Ant,Rx}(\omega, \theta, \phi ) \cr = &\,\displaystyle{{\,j\omega} \over {2\pi c}}\cdot H_{Ant,Rx}(\omega, \theta, \phi ) \cdot \displaystyle{{e^{-jkR}} \over R}\cdot H_{Ant,Rx}(\omega, \theta, \phi ),} $$
where k is the wave number, R is the distance between antennas, ω is the angular frequency, c is the speed of light, S 21(ω, θ, ϕ) is the measured transmission coefficient, X(ω, θ, ϕ) is the input spectrum, Y(ω, θ, ϕ) is the output spectrum, H channel(ω, θ, ϕ) is the transfer function of the channel, H Ant,Tx(ω, θ, ϕ) and H Ant,Rx(ω, θ, ϕ) are the transmitted and received antenna transfer functions, respectively. Here, if the two antennas are identical, the antenna transfer function can be rewritten as follows [Reference Duroc, Ghiotto, Vuong and Tedjini39, Reference Nel, Joubert and Odendaal40]:
 $$H_{Ant}(\omega, \; \theta, \phi ) = \sqrt {\displaystyle{{2\pi RcS_{21}(\omega, \theta, \phi )\,e^{\,jkR}} \over {\,j\omega}}}. $$
Fig. 12. Wireless communication test-two identical antennas are pointed each other and antenna ports are connected via the PNA Network Analyzer (N5227A).
Figure 13(a) shows the antenna transfer function of the wrapped antenna as a function of frequency. The antennas are pointed away from 600 mm each other. The antennas are oriented in the boresight direction (θ = 180°). The measurement was performed in an environment where the microwave absorbers are enclosed. The characteristic of the antenna transfer function is evaluated within the −10 dB bandwidth of the excited spectrum, which is from 0.5 to 5.5 GHz with 2.5 GHz of peak frequency. The overall magnitude of the wrapped antenna transfer functions is flat and observed to be under −30 dB, which is isolated between them. The magnitude of the WRLBA is also observed to be lower than that of the WBA. This is because of a resistive loading effect on the antenna arm.

Fig. 13. Communication characteristics of the wrapped antenna: (a) antenna transfer function, (b) received waveform in the boresight direction, (c) boresight gain as a function of frequency, and (d) phase response and group delay.
The received waveform is obtained as shown in Fig. 13(b) by performing the inverse Fourier transform of multiplying the antenna transfer function by the excited pulse spectrum which has a peak frequency of 2.5 GHz. It is clearly observed that, the received waveform of the WBA is more distorted by the open-end reflection than that of the WRLBA. In this regard, the corresponding calculated fidelity factor of the WBA and WRLBA is 0.79 and 0.85, respectively.
The boresight gain is investigated as shown in Fig. 13(c). Here, the boresight antenna gain as a function of frequency can be obtained as [Reference Duroc, Ghiotto, Vuong and Tedjini39, Reference Nel, Joubert and Odendaal40]:
 $$G{\rm (}\omega, \theta = {\rm \;} 180^\circ, \phi {\rm )} = \displaystyle{{4\pi f^2} \over {c^2}}\vert {H_{Ant}(\omega, \theta = 180^\circ, \phi )} \vert ^2.$$
It is noted that, the boresight gain of the WRLBA is relatively lower than that of the WBA. This is because of loaded resistors on the antenna arm. As the frequency increases, the corresponding gain is also observed to be increased.
Figure 13(d) shows the group delay and phase response as a function of frequency. The linearity of the phase response is desirable to ensure the pulse is not dispersive over the wide band. The group delay is defined as the negative rate of change of the antenna transfer function's phase with respect to frequency as:
 $${\rm Group}\,{\rm delay} = -\displaystyle{\partial \over {\partial \omega}} \angle H_{Ant}(\omega, \theta = 180^\circ, \phi ).$$
The average group delay of the wrapped antennas is observed to be around 2.5 ns. The variation of the group delay is about less than 1.5 ns except for lower frequencies. The high fluctuation of the group delay over lower frequencies (0.5–1 GHz) results from the discontinuity of the linear phase response of the antenna transfer function. This can be closely related to the fluctuation of the magnitude of the antenna transfer function over lower frequencies.
Conclusion
The wrapped antennas have been proposed, realized, and characterized in this work. To the best of our knowledge, the characteristics of the wrapped antennas, such as the WBA and WRLBA are firstly introduced, explored and analyzed for use in impulse radar applications. The resistive loading has been successfully applied to the wrapped antenna and its prototype is realized on the flexible substrate. The effects on the resistive loading of the wrapped antenna are numerically and experimentally investigated in terms of pulse radiating performances. The resistive loading of the wrapped antenna has demonstrated to enhance the lower frequency matching and pulse radiating performances at the expense of the reduced gain and efficiency. The communication ability of the wrapped antenna is explored and evaluated by group delay and phase response. The overall performances of the WRLBA have been shown to be an excellent candidate for drone arm-combined sensing applications. The modified resistive loading technique based on the curved arm of the WRLBA will be developed for optimizing the pulse radiating performance in the near future.
Acknowledgement
This work is supported by General Dynamics Land Systems Canada (GDLS Canada), and NSERC. All measurements were done at the CIARS and Robohub facilities at UWaterloo.
 Doojin Lee received the Ph.D. degree in biomedical science and engineering from the Gwangju Institute of Science and Technology (GIST), Gwangju, Republic of Korea, in 2017. He is currently a Post-Doctoral Fellow with University of Waterloo (UW), Waterloo, Canada. His research interests include pulsed radar-based sensing and imaging for biomedical and industrial applications.
 George Shaker (BASc, MASc, PhD, SM IEEE) has been an adjunct assistant professor with the department of electrical and computer Engineering at University of Waterloo since 2014. He is also with Spark Tech Labs where he is the Principal Scientist and Head of Electromagnetics R&D since its founding in 2011. From late 2011 to mid-2013, as a member of the senior team and for some time as the Head of Technology of STLs sister company in China, George was heavily involved in designing a line of compact chambers product line of compact chambers for next-generation wireless systems, including MIMO and RFIDs. From 2006 to 2011, George was affiliated with RIM’s (Blackberry’s) RF R&D division, first as an NSERC scholar, then as a senior EM researcher, reporting directly to the RIM’s vice president of RF R&D. From September 2009 to April 2010, he was a visiting NSERC MSFSS scholar at Georgia Institute of Technology. Over the last decade, George has contributed to products available from Hi-Tek International, Panasonic, ActsPower, COM DEV Limited, Research in Motion (BlackBerry), American Microelectronic Semiconductors (ON-Semiconductors), Bionym, Medella Health, Novela, DBJ Tech, Konka, Enice, China Mobile, Tri-L Solutions, Pebble, Thalmic Labs, Lyngsoe Systems, NERv, Ecobee, and Spark Tech Labs. Dr. Shaker has co-authored more than 70 journal publications, conference papers, and technical reports, along with more than 20 patents/patent applications. George has served as session co-chairman and short course/workshop lecturer in several international scientific conferences. He has served as a TPC/TPRC member of the IEEE MTT-IMS, the IEEE iWAT, the IEEE EMC, the IEEE WF-IoT, the IEEE AP-S, the IEEE EuCAP, and the IEEE iThings. He was an invited speaker at several international events, including Keynote talks at the IEEE LAPC, the IEEE iThings, and the Ambient Intelligence. He currently serves as an Associate Editor for the IET Microwaves, Antennas, and Propagation. George was the recipient of multiple awards, including the NSERC Canada Graduate Scholarship (sole winner in the area of Electromagnetics across Canada, 2007), Ontario Graduate Scholarship (twice), European School of Antennas Grant at IMST-GmbH (2007), IEEE AP-S Best Paper Award (2009, top 3), the IEEE AP-S Best Paper Award (HM, 2008, 2011, 2017), the IEEE Antennas and Propagation Graduate Research Award (2008/2009), NSERC CGS-FSS (2009), IEEE MTT-S Graduate Fellowship (2009), the Electronic Components and Technology Best of Session Paper Award (2010), Google Soli Alpha (2015), IEEE AP-S Third best student design award (2016). Two papers he co-authored in IEEE Sensors were among the top 25 downloaded papers on IEEEXplore for several consecutive months (2012 and 2017).
 Dr. William Melek is the Director of Mechatronics Engineering and the RoboHub at the University of Waterloo. He is and an expert on robotics, artificial intelligence, sensing, and state estimation. He earned his doctorate in mechanical engineering from the University of Toronto in 2002, and then led the Artificial Intelligence Division of Alpha Laboratories Inc. He founded University of Waterloo Laboratory of Computational Intelligence and Automation in 2004 and was awarded the Young Engineer Medal of Professional Engineers Ontario in 2006. He is the past President of the North American Fuzzy Information Processing Society (NAFIPS), and a senior member of the Institute for Electrical and Electronics Engineers (IEEE). Dr. Melek developed Canada’s first industry-ready modular reconfigurable robot (MMR); the state-of-the-art open architecture system is now used in the automotive sector. He has also led the way in designing practical, intelligent and adaptive control architectures for MMRs based on neural networks. Conceptual prototypes have been developed for the nuclear industry in the United States. He holds twelve Canadian and U.S. patents, and his contributions to the manufacturing industry have been featured in the National Post, Globe and Mail and CBC television.


