Introduction
Electromagnetic waves at microwave and millimeter-wave frequencies have many interesting properties for non-destructive testing (NDT) of technical structures and components [Reference Kharkovsky and Zoughi1]. They are able to penetrate dielectric materials and provide information about the material's spectral response [Reference Fukasawa2]. A structural defect, such as a delamination, can be measured based on a local change in the electromagnetic properties [Reference Yang, He and Zhang3]. In contrast to related techniques the electromagnetic NDT methods are non-contact, enable a one-sided scanning, are free of couplants and without safety concerns due to the low radiated power [Reference Li, Haigh, Soutis, Gibson and Sloan4]. Furthermore, surface defects in metallic structures can be detected by reflection coefficient-based methods using waveguide probes [Reference Ali, Hu and Ramahi5] and resonance frequency-based methods [Reference Albishi and Ramahi6].
Recently, mm-waves were used in the context of structural health monitoring (SHM) for the detection [Reference Moll, Arnold, Mälzer, Krozer, Pozdniakov, Salman, Rediske, Scholz, Friedmann and Nuber7] and localization [Reference Arnold, Moll, Mälzer, Krozer, Pozdniakov, Salman, Rediske, Scholz, Friedmann and Nuber8] of structural defects in rotor blades of wind turbine structures. The same technology was used in [Reference Moll, Simon, Mälzer, Krozer, Pozdniakov, Salman, Dürr, Feulner, Nuber and Friedmann9] to monitor wind turbine blades in the field. Other examples where mm-waves were used for SHM purposes include mechanical vibration sensing exploiting the Doppler effect [Reference Li, Peng, Huang, Fan, Wang, Horng, Munoz-Ferreras, Gomez-Garcia, Ran and Lin10] or non-contact tip-clearance measurements of gas turbines [Reference Szczepanik, Przysowa, Spychaa, Rokicki, Kazmierczak and Majewski11]. In this work, guided electromagnetic waves (GEW) are considered that have recently been used for surface damage detection in metallic structures [Reference Moll12]. In addition, waveguide patches can be used for local hotspot monitoring [Reference Moll, Nguyen and Krozer13, Reference Moll14].
This paper presents numerical and experimental results for GEW propagation in a straight waveguide focusing on the detection of through holes and cracks with different orientation. For the first time, a numerical study is performed for complex-shaped rectangular waveguides including several waveguide bends. For this case, the damage position is determined and the accuracy of damage localization assessed.
The remainder of the paper is organized in the following way. Section “Methods” reports on the methods used in this work including a description of the simulation model, the measurement setup, and the damage localization approach. Section “Damage detection in straight waveguides” presents the numerical and experimental results for the case of a straight waveguide. After that, section “Detection of through holes in a complex-shaped waveguide” aims at damage analysis of a complex-shaped waveguide. Finally, conclusions are drawn at the end.
Methods
Detection concept
Figure 1 illustrates the underlying concept where the rectangular metallic waveguide forms a permanent union with the metallic host structure. A surface damage can be detected in the area under the waveguide by means of ultra-wideband signals in the frequency range from 20 to 40 GHz. Changes in the waveguide, e.g. due to abnormalities such as surface cracks, are detectable by microwaves–waveguide interactions from a single access point that is relatively far away. The signal processing for waveguides with a length of many tens of meters is straightforward, because only a single reflection and/or transmission measurement must be analyzed which is sufficient for sensitive damage detection and accurate damage localization. The proposed methodology benefits from recent developments in the field of additive manufacturing of passive high-frequency components [Reference Zhang, Chen, Wu, Ding and Li15, Reference Otter and Lucyszyn16].

Fig. 1. Visualization of guided electromagnetic waves in a jointed electromagnetic waveguide. A rectangular waveguide is placed on top of a planar host structure where the inner faces form the wave guiding region. A surface damage can be detected in the area under the waveguide.
Numerical modeling
This paper considers two structures depicted in Fig. 2. The straight geometry is based on a standard rectangular waveguide WR 28 with a length of 400 mm. In this waveguide, the cutoff frequency of the lowest order mode is 21 GHz. The second structure has a complex geometry including several waveguide bends. The waveguide itself as well as the planar host structures are made of aluminum. The waveguide has an inner width of w i = 7.11 mm and an inner height of h i = 3.55 mm (see Fig. 1). In this research two practically relevant defect types are considered, namely through holes and cracks. The parameters of the damage types are also illustrated in Fig. 2. While the hole is characterized by its diameter D, the parameters of the rectangular crack are W C, L C, and θ. The axial position of the EM-wave in the waveguide is described by the x-coordinate. Numerical modeling has been performed in CST Microwave Studio using the time-domain solver.

Fig. 2. (a) Straight waveguide with the geometry of the crack; (b) complex-shaped waveguide with three holes (hole #1, hole #2, hole #3) having a diameter of D = 3 mm.
Experimental measurements
The experimental setup shown in Fig. 3 is used to measure the straight waveguide. A network analyzer HP 8722C records the scattering parameters up to frequencies of 40 GHz in reflection and transmission mode. A flat aluminum sample (400 mm × 100 mm × 1 mm) represents the host structure. Drilling tools with diameters of 1–5 mm were used to create holes in the specimen of different sizes.

Fig. 3. Photo of the experimental setup showing the network analyzer HP 8722C (50 MHz–40 GHz) and the jointed electromagnetic waveguide. A flat aluminum sample (400 mm × 100 mm × 1 mm) represents the host structure in which holes were inserted.
The network analyzer is calibrated prior to the measurements by means of an RF calibration kit. Due to the available calibration kit, the full bandwidth could not be exploited. The stimulus includes a low excitation amplitude of −15 dBm in the frequency range from 20 to 40 GHz. A total number of 201 frequency points were measured. The measurement data was downloaded to the PC for post-processing. More information on the signal-to-noise ratio (SNR) of the proposed setup can be found in [Reference Moll12].
Damage localization methodology
The damage localization approach is based on a differential S 11 signal s d(t) between a baseline measurement from the intact structure s B(t) and the current measurement s(t) that is measured from a structure with damage. The damage position x D along the waveguide can be easily determined using the relationship

In this equation, t 0 represents the time-of-flight of the scattered wave arriving at the input port. It can be determined from the signal s d(t), e.g. using threshold crossing. The frequency-dependent phase velocity is represented by c ph(ωc) where ωc is the central frequency of the excitation pulse. Finally, the factor of 2 comes from the round trip path of the EM-wave from the input port to the damage and back.
Damage detection in straight waveguides
Detection of through holes
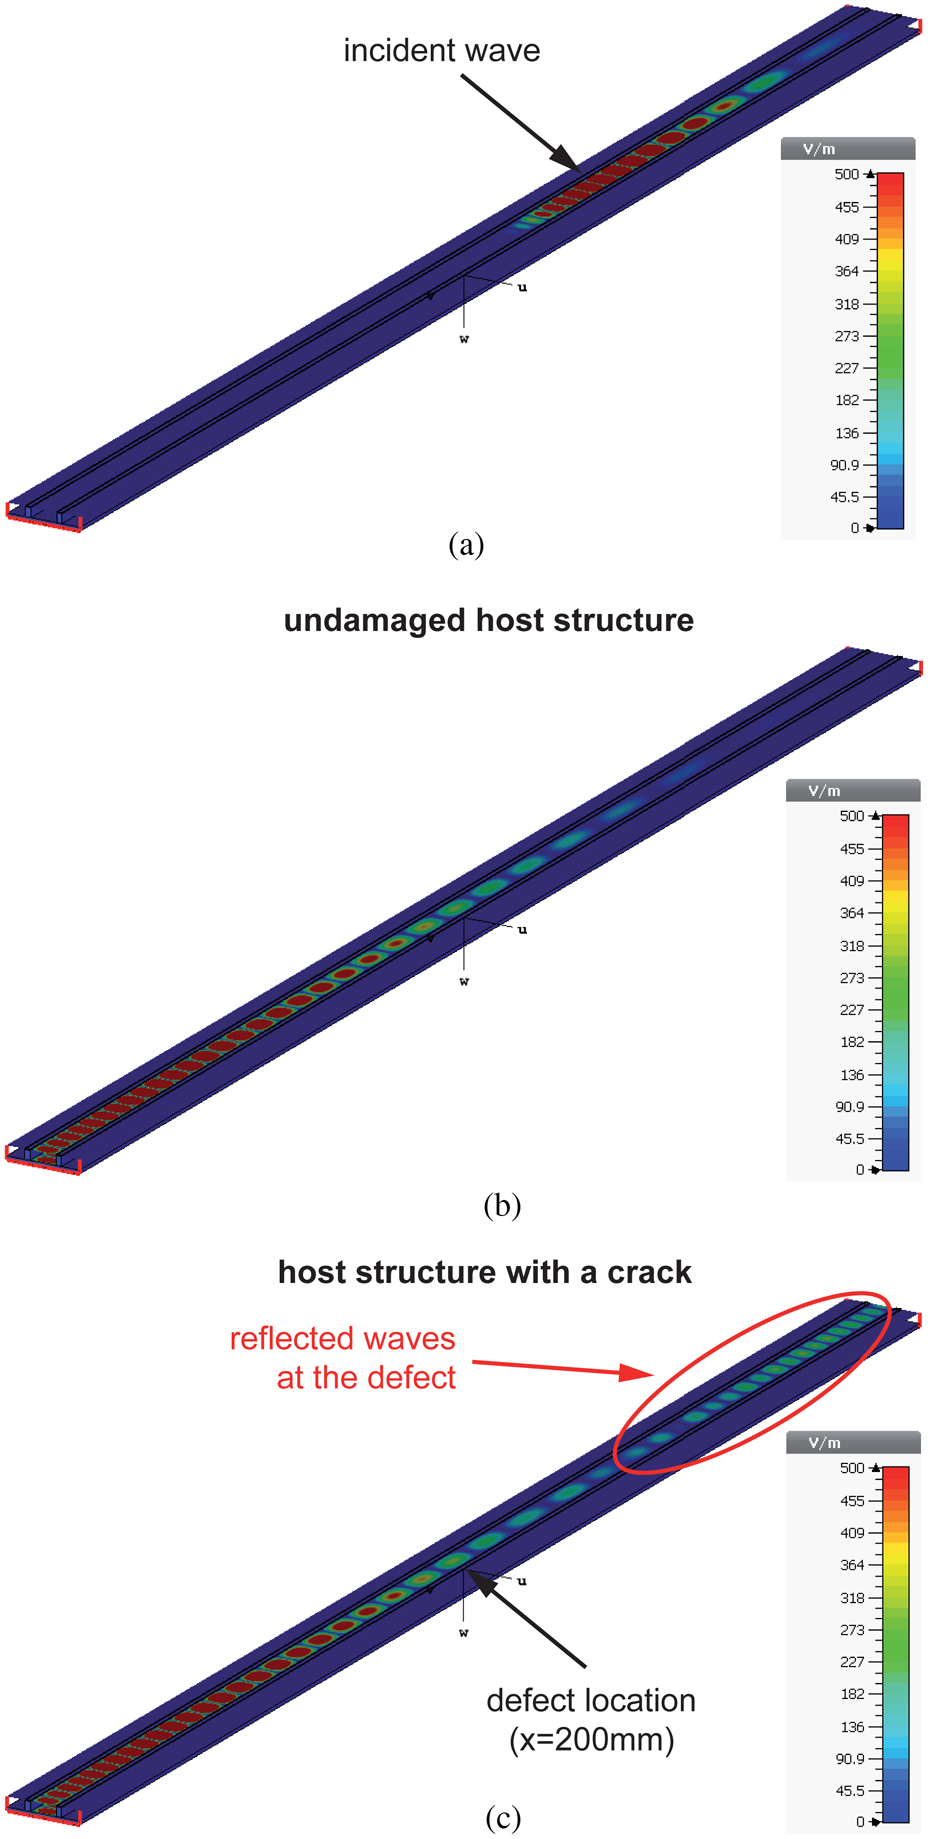
Figure 4 illustrates GEW propagation in a straight jointed rectangular waveguide for the intact and the damaged structure. While the incident wave, shown in Fig. 4(a), is the same in both cases, significant differences can be observed by comparing the wavefield from the undamaged and the damaged structure shown in Fig. 4(b) and 4(c), respectively. The incident wave is reflected at the crack (L C = 5 mm, W C = 1.5 mm, θ = 90°, x = 200 mm) and can be detected at the input port of the waveguide. Those reflections can be processed to assess the structural conditions.

Fig. 4. Screenshots of wave propagation (electric field) in the straight waveguide as cross-sectional representation computed by CST Microwave Studio after (a) 0.8 ns and (b,c) 1.8 ns. In this example, the crack parameters are: L C = 5 mm, W C = 1.5 mm, θ = 90°, x = 200 mm. Reflections at the defect can be observed by comparing the wavefield of the undamaged and the damaged structure.
Figure 5(a) shows the measured scattering parameters S 11 where the undamaged structure is compared with the damaged structure for different hole sizes located at x = 200 mm. It can be observed that the S 11 parameter increases as soon as the hole diameter becomes larger. This overall behavior can be modeled as shown in Fig. 5(b). A continuous increase of S 11 over a wide frequency band can be observed for increasing hole sizes. However, due to the limited SNR in the experimental setup and the imperfections of the fabricated waveguide, the gap in S 11 between the undamaged and the damaged waveguide is smaller in the experimental measurements compared to the numerical model.

Fig. 5. Comparison between the experimental S 11 measurements, after [Reference Moll12], and the numerical S 11 predictions for the case of a through hole at x = 200 mm for various hole diameters. The numerical model is able to describe the experimental observations qualitatively.
Detection of cracks
The following section presents numerical results of a parametric study, where the crack parameters were systematically modified. The first result is depicted in Fig. 6 showing the scattering parameters S 11 for different crack angles ranging from θ = 0° to θ = 90°. In this example, the crack is located at x = 200 mm. First, it can be observed that the crack can be clearly distinguished from the baseline data, i.e. S 11 measurements of the undamaged structure. Second, S 11 increases steadily when the crack angle θ becomes larger. This result means that a crack oriented perpendicular to the direction of wave propagation can be detected easily compared to a coaxially aligned crack.

Fig. 6. Analysis of crack orientation at x = 200 mm (L C = 5 mm and W C = 1.5 mm). The orientation of the crack relative to the direction of wave propagation has a significant effect on the S 11 parameters and hence the detectability of the crack. Coaxial orientation (θ = 0°) leads to smaller S 11 changes compared to an orthogonally aligned crack (θ = 90°).
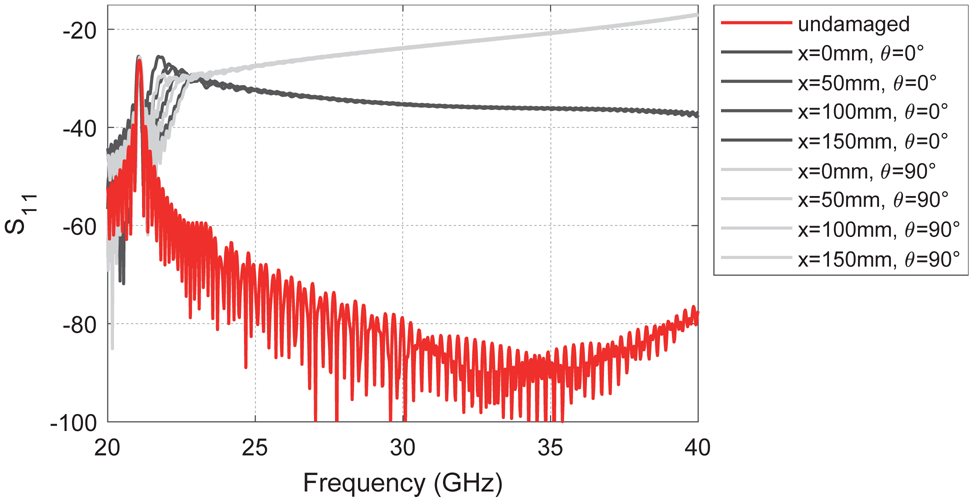
Next, Fig. 7 shows the identical crack parameters at different axial positions in the waveguide ranging from x = 50 mm to x = 200 mm. It can be observed that unique features are preserved in the S 11 parameters independent of the crack location in the waveguide. In any case, the crack can be clearly detected at all damage positions.

Fig. 7. Analysis of crack orientation at different axial positions in the waveguide. The position of the crack in the waveguide does not have a significant influence on the S 11 characteristics, especially at frequencies larger than 23 GHz.
Finally, numerical results are presented in Fig. 8 showing a crack of 5 mm length and different widths positioned at x = 200 mm. From this plot it can be derived that the larger the crack width the easier it is to detect the damage by analyzing the S 11 signals.

Fig. 8. Analysis of the detectability of a 5 mm long crack with different width at x = 200 mm. The larger the crack width the easier it is to detect it by the analysis of S 11 measurements.
Detection of through holes in a complex-shaped waveguide
The complex-shaped waveguide was placed in the numerical model on a 280 mm × 280 mm × 1 mm aluminum plate. Three damage scenarios in the form of through holes with a diameter of 3 mm have been modeled with their coordinates listed in Table 1. The same excitation as before was used covering a frequency range from 20 to 40 GHz.
Table 1. Damage locations in the u–v-coordinate system of Fig. 2(b).

Figure 9 shows the S 11 curves for all three damage cases. While the undamaged structure has a relatively low reflection over the whole frequency band of interest, the S 11 parameters increase for all three holes independent of their respective location in the waveguide. The result confirms that damage can be detected in a complex-shaped waveguide.

Fig. 9. Detection of holes at different locations in the complex-shaped rectangular waveguide. Each hole can be clearly identified based on an increase of S 11.
For practical applications it is of great interest to determine the damage location in order to optimize maintenance activities. Therefore, we have processed the time-domain S 11-signals for the undamaged and the damaged structure. The difference signals for all three cases are depicted with its spectrogram in Fig. 10. It can be observed that the time-of-flight t 0 for the three differential signals vary due to their respective location in the waveguide. Moreover, the wave propagation is dispersive so that the frequency-dependent wave velocity must be taken into account for transforming the time-domain signals into the distance domain. Here, we have used the center frequency of 30 GHz which has a wave velocity of 2.04 · 108 m/s. Based on this value we have determined the axial position of the damage in the rectangular waveguide. The results are summarized in Table 2 showing that the localization error is always below 3%.

Fig. 10. (top) Time-domain analysis of the differential S 11-signal for (a) hole #1, (b) hole #2 and (c) hole #3; (bottom) spectrogram of the differential signals indicating the time delay at the mid frequency of 30 GHz.
Table 2. Accuracy of damage localization in the complex-shaped rectangular waveguides using reflection signals (relative to the total round-trip distance of 2.4884 m).

Conclusions
The research presented in this paper focused on the analysis of GEW propagation in a jointed electromagnetic waveguide. It was found that typical structural defects such as through holes and cracks can be successfully detected. A numerical model implemented in CST Microwave Studio is able to qualitatively describe the experimental S 11 measurements in the frequency band from 20 to 40 GHz for the case of through holes with different diameters. Moreover, the numerical model predicts the scattering response of the incident electromagnetic wave at the crack. The main findings of the numerical study are summarized as follows:
• A crack oriented perpendicular to the direction of wave propagation can be detected easily than a coaxially aligned crack with the same dimensions.
• The S 11 parameter does not change much when the crack is located at different positions in the waveguide.
• The larger the crack width, the easier it is to detect it.
• Damage can also be detected and precisely localized in a complex-shaped rectangular waveguide with multiple waveguide bends.
Acknowledgments
The author gratefully acknowledges the partial financial support of this research by the Federal Ministry for Economic Affairs and Energy (Grant Numbers: 03SX422B, 0324324C, and 20Q1911C). The author thanks Duy Hai Nguyen (Goethe University Frankfurt) for his support during the measurements.
 Jochen Moll received the Dipl.Ing. and Ph.D. degrees in mechanical engineering from the University of Siegen, Germany, in 2007 and 2011, respectively. Presently, he is a Postdoctoral Research Assistant with Goethe University Frankfurt, Germany. His research interests include non-destructive testing, structural health monitoring, and signal processing techniques. His research profile is located in http://www.jochenmoll.de.