Introduction
Space-borne synthetic aperture radars (SAR) can provide earth observation (EO) under almost any weather conditions during night or daytime. SAR systems can improve the resolution beyond the limitation of physical antenna aperture exploiting the antenna movement and using signal processing. The forward motion of the antenna is indeed used to mime the behavior of a very long array. Thanks to this approach, a high resolution which would require an incredibly large antenna aperture can be obtained with SAR antenna structures of the reasonable size which can be installed onboard satellites or airplanes. Next-generation space-borne SAR missions will employ digital beam-forming (DBF) to provide better resolution, wider coverage, and higher flexibility in general [Reference Gebert, Krieger and Moreira1, Reference Malviya, Panigrahi and Kartikeyan2]. Compared to phased arrays using analogue beamforming, DBF is much more powerful as it can form multiple steerable beams towards different targets simultaneously, adaptive beam shaping, and have more flexibility [Reference Martin, Klupar, Kilberg and AFB3–Reference Lee and James5].
The European project DIFFERENT (acronym for “digital beamforming for low-cost multistatic spaceborne SAR”) recently [Reference Arnieri, Boccia, Amendola, Glisic, Mao, Gao, Rommel, Penkala, Krstic, Yodprasity, Schrape and Younis6–Reference Gao, Qin, Mao, Patyuchenko, Younis, Krieger, Glisic, Debski, Boccia, Amendola, Arnieri, Krstic, Koczor, Penkala and Celton8] proposed a mission scenario where a multi-static SAR is implemented using formation flying small satellite constellation. The proposed system is based on a master satellite transmitting a SAR signal which is in turn backscattered and received by a constellation of small satellites using DBF receive-only antenna systems. This approach allows reducing the overall mission costs while enabling lager freedom of operation and increasing the sensitivity due to the reduction of transmitter/receiver switches. Moreover, the proposed system is designed to define the most challenging scenario in terms of integration complexity of the radar sensor while targeting the highest resolution of the final EO system. Therefore, the SAR instrument proposed in DIFFERENT is fully polarimetric and it operates in two bands, namely X (9.6 GHz) [Reference Huber, Younis and Krieger9] and Ka (35.75 GHz) [Reference Rohrdantz, Jaschke, Gellersen, Sieganschin and Jacob10–Reference Luo, Gao, Chaloun, Menzel, Boccia, Arnieri, Amendola and Ziegler12], as shown in [Reference Greco, Boccia, Arnieri and Amendola13]. For the case at hand, the DBF module is used as a feed of an off-set reflector. The DBF array is thus composed of 60 digital channels connected to dual-band dual-polarized radiating elements. It is worth noticing that, to date, there is no available solution for SAR instruments targeting the proposed requirements. The multi-channel configuration allows to overcome the constraint of minimum antenna area, thus enabling the simultaneous acquisition of high-resolution and wide-swath (HRWS) radar images. Spatial sampling obtained with the multi-channel receiving technique provides additional samples between neighboring pulses in the slow-time domain, being this is equivalent to increase the pulse repetition frequency (PRF) of the system.
The single building blocks of the proposed SAR instrument were presented in [Reference Mao, Gao, Tienda, Rommel, Patyuchenko, Younis, Boccia, Arnieri, Glisic, Yodprasit, Penkala, Krstic, Qin, Schrape, Koczor, Amendola and Petrovic14] along with a definition of the intended mission scenario. In more recent work, the experimental validation of the integrated tile was proposed in [Reference Arnieri, Boccia, Amendola, Glisic, Mao, Gao, Rommel, Penkala, Krstic, Yodprasity, Schrape and Younis6, Reference Huber, Younis and Krieger9] reporting a complete characterization of the integrated analogue front-end. This work completes the dissemination of this activity by presenting the experimental results of the entire integrated system, including both analogue and digital blocks. Moreover, it will be shown how DBF processing can be used to perform a calibration [Reference Wu, Zhang, Zhu, Wang and Shen15, Reference Biallawons, Klare and Saalmann16] of the multi-channel DBF SAR instrument compensating the inevitable imbalance present between the different channels which is also referred to as “channel error” or “channel mismatch.”
Radar architecture
A schematic representation of the proposed SAR instrument is reported in Fig. 1. The main building blocks used in the prototype implementation (Fig. 1a) can be divided into three groups, depending on their functionality and frequency domain. For the Ka-band case, the RF signals coming from one polarization of a 2 × 2 subarray is amplified, combined and down-converted on-chip. The intermediate frequency (IF) signal is then filtered and digitalized using an Analog to Digital Converter (ADC). Finally, a DBF technique is used to combine the signals coming from different receiving channels. As shown in Fig. 1, a similar architecture is used for the X-band channels.

Fig. 1. SAR instrument architecture: (a) simplified representation of the building blocks; (b) stacked arrangement of the three boards.
The radiating elements, the down-conversion chips and the filters are integrated into a specific board, namely the “RF-board”. The 60 ADC channels are embedded into a dedicated panel referred to as “ADC-board” while the DGT processing is implemented using dedicated boards (i.e. DGT-boards). The boards are stacked on each other as shown in Fig. 1b.
• The 60 channels are organized in the following way:
• 24 channels for Ka-band horizontally polarized signals;
• 24 channels for Ka-band vertically polarized signals;
• 6 channels for X-band horizontally polarized signals;
• 6 channels for X-band vertically polarized signals
In this paper, the 60 channels of the manufactured SAR will be tested in order to demonstrate the ability of the radar to correctly acquire and elaborate the received data. The channels characterization presented in this paper is functional to the calibration process needed for the performance optimization of the radar. It is indeed well known that one of the key performance limitations for the DBF architecture at hand is related to the inevitable imbalance between the different channels. This imbalance can be caused by several reasons, such as the difference in antenna gains, unsynchronized sampling time between channels, and so on [Reference Gao, Qin, Mao, Patyuchenko, Younis, Krieger, Glisic, Debski, Boccia, Amendola, Arnieri, Krstic, Koczor, Penkala and Celton8]. In this work, it will be shown how this problem can be solved by a proper calibration to be carried out before the DBF processing.
The radar includes 48 Ka-band channels plus 12 X-band channels. Figure 1 shows the architecture for one Ka-band channel and for one X-band channel. The experimental assessment of the analog part at component and sub-system level was already described in our previous papers [Reference Massonnet4, Reference Lee and James5] and will be not repeated here. This paper is indeed focused on the digital and the full channel characterization.
The block diagram shown in Fig. 1a is implemented using one RF-board, one ADC-board and six digital boards as shown in Fig. 2. For test purposes, the boards are housed into a metallic box which embodies also the power supply and all the mechanical interfaces.

Fig. 2. Digital beamforming SAR.
RF board
The RF board integrates into the same PCB the X/Ka-Band antenna array and the down-converting blocks as shown in Fig. 1, providing at the output 60 IF band channels.
The RF board is thus composed by:
• 96 Ka-band (24 in elevation times 4 in azimuth) dual-polarized (horizontal and vertical polarization) antenna elements;
• 6 X-band horizontally polarized antennas;
• 6 X-band vertically polarized antennas;
• 60 RF microwave monolithically integrated circuit (MMIC) units;
• Two local oscillators (LO) distribution networks (at X- and Ka-band).
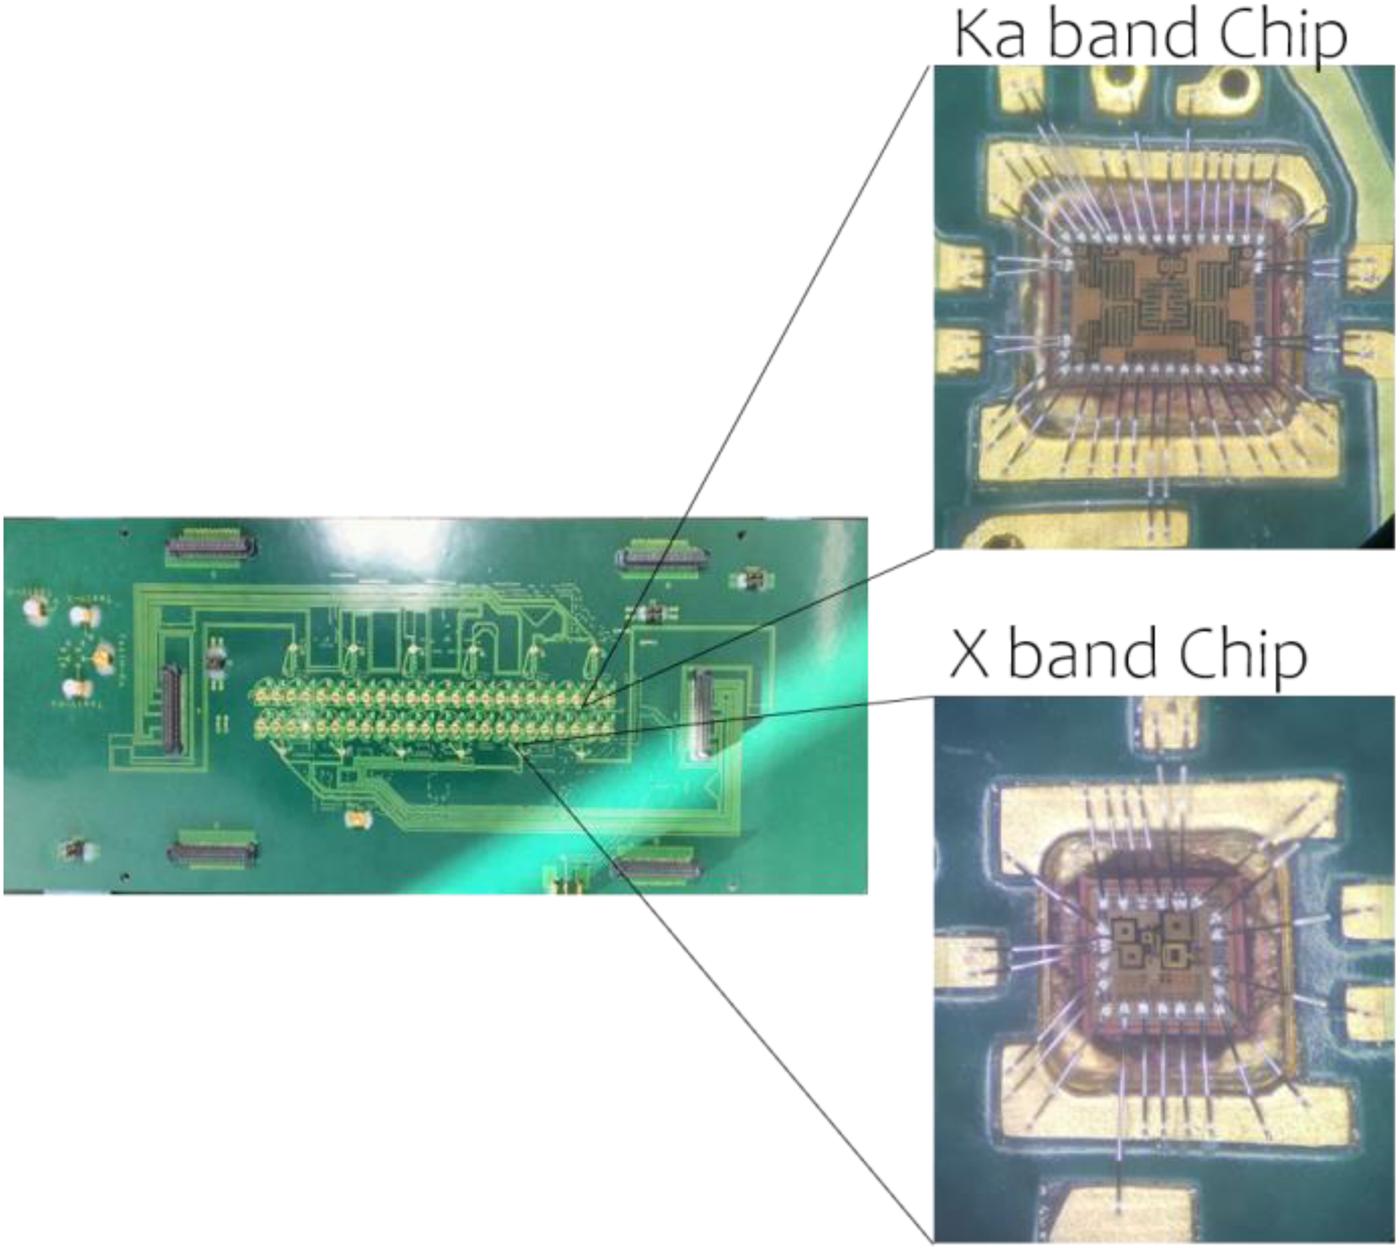
Every 2 × 2 Ka-band subarray is actively combined to form a channel (see Fig. 1a). The function of the RF MMIC units is to down-convert the received V- and H-pol signals to an IF band. At X-band each antenna is connected to a single chip that down-converts the input signal. To reduce the complexity of the system, the X/Ka-band radiation elements, RF circuits and MIMCs are integrated into a single RF board. A detailed description and experimental validation of a single antenna tile of the RF board is provided in [Reference Arnieri, Boccia, Amendola, Glisic, Mao, Gao, Rommel, Penkala, Krstic, Yodprasity, Schrape and Younis6, Reference Arnieri, Boccia, Amendola, Glisic, Mao, Gao, Rommel, Penkala, Krstic, Yodprasit, Ho, Schrape and Younis7] and will be not repeated here. Figure 3 shows the manufacture RF board. X- and Ka-band MMICs are located into cavities and wire bonded to the board.

Fig. 3. Bottom view of the manufactured RF Board integrating 96 Ka-band antennas, 12 X band antennas, 48 Ka-band Chips and 12 X band Chips. The two MMIC providing down-conversion are also shown, including the wire bonding interconnections.
ADC board
The down-converted signals at the output of the RF board are routed to the ADC board (Fig. 1), where 60 ADCs (one for each channel) are used to digitalize the baseband signals [Reference Arnieri, Boccia, Amendola, Mao, Gao, Rommel, Glisic, Penkala, Krstic, Ho, Yodprasit, Schrape and Younis17]. A 10 layers PCB stackup has been used to integrate all necessary components, including band-pass filters and decoupling capacitors, on the same board.
High-speed digital signals are routed separately using the upper layers of the stackup to prevent coupling with the analog RF carriers on the lower part of the stackup. The IF signals are digitalized using the ADC ADS5527 by Texas Instruments which provide high-performance 12-bit, 210-MSPS A/D conversion.
48 ADC is used for the Ka-band channels and 12 for the X-band channels. Figure 4 shows the manufactured ADC board. A multilayer [Reference Boccia, Emanuele, Arnieri, Shamsafar and Amendola18] distribution network of equal length striplines have been used to guarantee signals synchronization.

Fig. 4. ADC board: (a) top side (b) bottom side.
An integrated differential clock distribution network has been realized in microstrip technology on the upper layer of the ADC board. This network was designed to guarantee clock coherence between the 60 ADCs. A clock generator (IDT FXO-LC535-210), placed on the center of the network, has been used to distribute a 210 MHz Low Voltage Differential Signal (LVDS) across the entire board. Low Skew Differential Clock Distribution Chips (IDT 8516) have been used for power division. The clock signal has been delivered to 60 ADCs and to the six digital boards via the ADC/DGT connectors. The final size of the manufactured ADC board is 923 × 425 mm.
Digital boards
In the DBF unit, the digitized data, corresponding to each antenna channel and polarization, are weighted and combined. The DBF is implemented in the six digital boards shown in Fig. 2. Four DGT boards are dedicated to the 48 Ka channels while two DGT boards are dedicated to the remaining 12 X-band channels. A 10-layer FR4 material stackup has been used to realize this board. The digital back-end consists of an ARM-based microprocessor, three ASICs, modules of clock synthesizer, FTDI module (FIFO to USB), SMA and FMC connectors. The DBF chips are manufactured using the low-cost 250-nm BiCMOS technology.
The DBF network is a cluster of individual DBF cores. The 60 channels require in total 16-DBF cores. The core can work in a static or in a dynamic mode. In the first case, the weights are fixed during operation; in the dynamic mode, the weights can be changed. The four different complex coefficients for each elevation beam are stored in a weight buffer. Next, the microprocessor adds up the sub-streams from each polarization (V and H) and band (X and Ka) and forms an output stream for a given azimuth beam. Figure 5 shows a manufactured Ka-band digital board.

Fig. 5. Manufactured Ka-band digital board: (a) top view; (b) bottom view.
Assembled prototype
The whole SAR radar has been assembled within the shelter architecture of Fig. 2. Figure 6a shows the radar instrument with the upper cover removed where the ADC-board with the connected digital boards are visible. The RF board contains the antenna array and, for this reason, it has been placed outside the metallic box as shown in Fig. 6b.

Fig. 6. Assembled radar demonstrator: (a) view with the upper part of the box removed, the ADC board with the connected digital boards are visible; (b) view with the upper part of the mechanical housing closed. The RF board is placed outside the metallic box.
Measurements
The manufactured prototype has been used to test the functionality of the 48 Ka-band channels and of the 12 X-band channels. As shown in Fig. 1, the block chain is composed of an analog part followed by a digital part. Signals traveling in each channel are converted from analog to digital in the ADC-board. Two preliminary tests have been performed to characterize separately the analog and the digital parts of each channel. The analog part has been tested considering a single tile of the RF board, results are described in our previous papers [Reference Arnieri, Boccia, Amendola, Glisic, Mao, Gao, Rommel, Penkala, Krstic, Yodprasity, Schrape and Younis6, Reference Arnieri, Boccia, Amendola, Glisic, Mao, Gao, Rommel, Penkala, Krstic, Yodprasit, Ho, Schrape and Younis7] and will be not repeated here. In this paper, the digital part has been tested removing the RF board and testing the sub-channel composed by the ADC board + digital board. In addition, a test of the full channel has been performed considering the entire chain shown in Fig. 1. Finally, a multi-channel test has been completed to demonstrate the ability of the beamforming network to combine signals coming from different channels in order to generate a single stream.
Digital sub-channel characterization
Characterization of the digital part of a channel has been performed removing the RF board from the radar. A known IF signal has been used to excite directly the ADC board using the semi-circle shaped interface board shown in Fig. 7a.

Fig. 7. Digital sub-channel measurement setup: (a) photo (b) block diagram.
The blocks involved in this test are shown in Fig. 7b. A 7 MHz sinewave has been generated and provided at the input of the ADC-board. A notebook connected to the output of the digital board has been used to elaborate the reconstructed signal. Figure 8 shows the spectrum of the reconstructed 7 MHz sinewave as seen at the output of the digital board. As expected, the reconstructed signal is concentrated around a single spectra element at 7 MHz. The maximum noise level is lower than −30 dB and, for this reason, it can be considered as negligible. The same test has been repeated 60 times to characterize all the channels of the radar.

Fig. 8. Spectrum of the reconstructed 7 MHz sinewave at the output of the digital board.
Third-order nonlinear behaviors have been observed and they are mainly related to the implementation of the Hilbert Transform in the DGT boards. These effects do not have a relevant impact on the final system because they are mainly related to third-order harmonic generation. Nevertheless, several activities are in progress to get rid of them.
Full channel characterization
The purpose of this test is to characterize the full channel considering the whole block chain shown in Fig. 1. Figure 9 shows the measurement setup used for both X-band and Ka-band measurements. LO signals were generated with an external signal generator. Due to the high isolation between all antenna channels, tests could be performed independently for each polarization and for each band. For each polarization, the input signal was generated with a vector network analyzer and radiated with linearly polarized X- or Ka-band horn antennas. Isolation between the two polarizations is higher than 25 and 30 dB at Ka and X-band, respectively [Reference Arnieri, Boccia, Amendola, Glisic, Mao, Gao, Rommel, Penkala, Krstic, Yodprasit, Ho, Schrape and Younis7]. The coupling between the two bands is lower than 35 dB as two different radiator typologies are adopted in the different bands as in [Reference Arnieri, Boccia and Amendola11].

Fig. 9. Measurement setup: (a) block diagram (b) photo of the test environment.
X-band channels characterization
As illustrated in Fig. 9, the characterization of the X-band channel was performed illuminating the radar with a horn antenna having a gain of 22 dBi and placed 1.2 m above the RF board. A 9.6 GHz LO signal was given at the input. Output amplitude of X-band channels was firstly measured varying the power of the LO signal (see Fig. 10). The test shows that LO power providing the maximum output power is equal to 7.5 dBm. The optimum LO power was hence used to evaluate the frequency response reported in Fig. 11 where a maximum amplitude difference of 5 dB has been observed. Figure 12 shows the measured output for the six X-band channels associated with the horizontal polarization. Similar results have been obtained for the other polarization. For the experiment at hand, the maximum output difference between the different channels does not exceed 6 dB. Part of this difference can be ascribed to the chip to chip conversion gain variability and part is because the horn illumination of the receiving surface is not uniform thus not providing the same input signal to all the antennas. Table 1 summarizes the mean and standard deviation of the output amplitude measurement for the X-band channels. It is worth noticing that channel to channel differences in the received and converted signal strength can be compensated during the system calibration, as it will be shown in the last part of this work.

Fig. 10. Output amplitude measurement for one X-band channel versus LO power input.

Fig. 11. Output amplitude measurement for one X-band channel versus frequency with 7.5 dBm LO power.

Fig. 12. Output amplitude measurement for the six X-band channels associated with the horizontal polarization (continuous line) and vertical polarization (dashed line).
Table 1. Mean and standard deviation of the output amplitude measurement for the 12 X-band channels

Ka-band channels characterization
The characterization of the Ka-band channel was performed illuminating the radar with a horn antenna having a gain of 22 dBi placed 0.77 m above the RF board (Fig. 9). A 35.75 GHz LO signal with a power of 18 dBm was used in the input. The LO power providing the optimal conversion gain would be around 4 dB higher but this value could not be generated with the available instrumentation.
Figure 13 shows the output amplitude versus input frequency. As it can be observed, a maximum amplitude difference of 4.5 dBm is observed. As for the X-band assessment, this difference comes mainly from the ADC to board matching and in much smaller part from the antennas and receiver chip variability. Figure 14 shows the measured output of the 12 Ka channels associated with the horizontal polarization. The maximum observed inter-channel difference is of about 3.5 dB and its origin is similar to the X-band case. Mean and standard deviation of the output amplitude measurement for the Ka-band channels are summarized in Table 2.

Fig. 13. Output amplitude measurement for one X-band channel versus frequency with 18 dBm LO power.

Fig. 14. Output amplitude measurement for 12 Ka-band channels associated with the: first horizontal polarization (point line), second horizontal polarization (dash-dot line), first vertical polarization (continuous line), second vertical polarization (dashed line).
Table 2. Mean and standard deviation of the output amplitude measurement for the 48 Ka-band channels

Multi-channel assessment
A multi-channel experimental validation was performed to demonstrate the ability of the beamforming network to combine signals coming from different channels in order to generate a single stream. The test can be performed by arbitrarily choosing two channels and exciting them with a known input signal. For the case at hand, a sine wave has been used to excite the Ka-band array choosing channels 2 and 3 of the Ka-band horizontal polarization to perform the test. Signal coming from the two channels were combined in the BFN using different values of the complex weighting coefficients. Figure 15 shows the measured output amplitude of the sum of the selected channels versus phase shift. Phase shift was implemented using the complex weighting coefficients in the BFN. It can be observed that signals cancel almost each other for −80° (giving minimum sum) and are in phase around +80° (giving maximum sum). A similar result has been obtained if two random channels were chosen for the X band case. An example is shown in Fig. 16 where channels 1 and 5 of the X-polarization chain have been considered. In this case, the maximum sum is observed at about + 35°. This test is functional to a channels calibration process where all channels are considered and calibrated together. Hence, by iteratively performing this procedure between couples of antennas in the prototyped instrument it is possible to fully equalize the different channels.

Fig. 15. Measured output amplitude of the sum of channel #2 and channel #4 of the Ka horizontal polarization versus phase shift.

Fig. 16. Measured output amplitude of the sum of channel #1 and channel #5 of the X horizontal polarization versus phase shift.
Conclusion
This work presents the experimental validation of a highly integrated SAR instrument designed for next-generation EO satellite missions. The proposed configuration, whose design and intermediate validation was previously reported by the authors, is the most advanced SAR architecture proposed to date. It features a fully polarimetric reflector feed system operating in X- and Ka-band integrated into an antenna architecture entirely based on digital beam-forming. For the vertical and horizontal polarization, each antenna channel is down-converted, sampled via ADCs, processed using dedicated ASICs and transmitted via USB to a computer. In this work, the overall integrated prototype of the SAR instrument has been presented including the RF front end, the digital conversion blocks, and the digital processing boards. The validation of the integrated demonstrator has been proved through an extensive experimental assessment which included the X- and Ka-band channel characterization. Moreover, it has been shown how the amplitude differences which are unavoidably present in such type of assembly can be cancelled through a simple multi-channel calibration procedure.
Acknowledgements
This work was supported by the EU under project DIFFERENT, 7th Framework Programme (FP7)-SPACE-2013-1
 Emilio Arnieri received the Degree (Hons.) in information technology engineering from the University of Calabria, Rende, Italy, in 2003, and the Ph.D. degree in electronics engineering from the University Mediterranea of Reggio Calabria, Italy, in 2007. He is currently an Assistant Professor with the Department of Informatics, Modeling, Electronics and System Engineering, University of Calabria, where he has participated in several National, EU, and ESA projects. His current research interests include circular polarizers, the development of dual-band antennas and millimeter-wave components, synthetic aperture radar, beam scanning antennas. He is Co-founder of the academic Spin-off “Antecnica”. Dr. Arnieri was selected as a finalist for the Best paper award in Antenna Design at the 13th European Conference on Antennas and Propagation (EuCap 2019). He has co-authored more than 70 papers published in international journals and proceedings of international conferences. Dr. Arnieri serves as an Associate Editor of the IEEE ANTENNAS AND WIRELESS PROPAGATION LETTERS and as Advisory Editor for WILEY ENGINEERING REPORTS.
 Luigi Boccia was born in Lungro, Italy, in 1975. He received the degree in information technology engineering from the University of Calabria, Rende, Italy, in 2000, and the Ph.D. degree in electronics engineering from the University Mediterranea of Reggio Calabria, Reggio Calabria, Italy, in 2003. He has been an Assistant Professor of electromagnetics with the Faculty of Engineering, University of Calabria, since 2005. He is the Co-Editor of Space Antenna Handbook (Wiley, 2012). His current research interests include low-multipath global navigation satellite system antennas, reflect arrays, beam scanning antennas, and micro- and millimeter-wave IC design. Dr. Boccia is a member of the European Microwave Association and the Società Italiana di Elettromagnetismo. He serves as a Technical Reviewer for many international journals and conferences.
 Giandomenico Amendola holds a degree in Electrical Engineering from the University of Calabria-Italy. After graduation, he was with CERN-Geneva as Research Fellow dealing with bean dynamics of linear accelerators. Since 1994 is with the University of Calabria where he is currently Associate Professor of applied electromagnetic fields. During his activities, he led research groups in several projects funded by the Italian Government and by the European Union. He is author of more than 100 publications in scientific journals and congress proceedings. His research interests focus mainly on antennas, integrated front ends and millimeter waves. Recently, he focused his activities to Satcom terminals and high speed, millimeter waves, terrestrial links.
 Srdjan Glisic received the B.S. degree in electrical engineering from the Faculty of Electronic Engineering, University of Nis, Nis, Serbia, in 2000, and the Ph.D. degree from Brandenburgische Technische Universitt Cottbus, Cottbus, Germany, in 2010. In 2003, he joined the Circuit Design Department as a scientist at IHP Microelectronics, Frankfurt (Oder), Germany and since 2013 he works as an RF Designer at Silicon Radar GmbH, Frankfurt (Oder). He is involved in projects on radar front-end design for the frequency range from 10 to 300 GHz. His work involves radar system specification, complete front-end development and system characterization.
 Chun-Xu Mao was born in Hezhou, Guangxi province, China. He received B.S. degree in communication engineering from the Guilin University of Electronic and Technology, Guilin, China in 2010, the M.E. degree in RF and microwave engineering from South China University of Technology, Guangzhou, Chinain 2013, and the Ph.D. degree in electronic engineering from the University of Kent, Canterbury, UK in 2018. From 2017 to 2018, Dr. Maowas a Research Fellow with the Institute for Communication Systems (ICS), 5 G Innovation Center (5GIC), University of Surrey, UK. In 2018, he joined Computational Electromagnetics and Antennas Research Laboratory (CEARL), Pennsylvania State University, USA, as a Research Fellow. Dr. Mao is now working at the University of Surrey as a Senior Research Fellow. Dr. Mao is the recipient of the Outstanding Master Thesis Award of Guangdong Province, China, in 2014. His research interests include filtering antenna integration, UWB antenna, circularly-polarized antenna, satellite antenna array, synthetic aperture radar (SAR) antenna, millimeter-wave antenna, and wearable antenna.
 Steven (Shichang) Gao received the Ph.D. degree from Shanghai University, China. He is a Professor and Chair of RF and Microwave Engineering, and the Director of Postgraduate Research at School of Engineering and Digital Arts, University of Kent, UK. His research interests include smart antenna, phased array, small antennas, MIMO, broadband and multi-band antennas, RF front ends, FSS, and their applications into 5 G mobile communications, satellite communication, small satellites, and radars. He co-edited/co-authored three books including “Space Antenna Handbook” (Wiley, 2012), “Circularly Polarized Antennas” (Wiley-IEEE, 2014), “Low-Cost Smart Antennas” (Wiley, 2018), over 300 papers and 4 patents. He received the 2017 CST University Publication Award for a paper in IEEE Transactions on Antennas and Propagation, and the 2016 IET Premium Award for the Best Paper in IET Microwave, Antennas and Propagation, etc. He is an Associate Editor of IEEE Transactions on Antennas and Propagation, and Radio Science, and was a Distinguished Lecturer of IEEE Antennas and Propagation Society (2014–2016).
 Tobias Rommel received his diploma degree from the University of Applied Sciences Wuerzburg-Schweinfurt, Germany in 2011. In 2018 he received his Dr.-Ing. degree (Ph.D.) with distinction for his dissertation with a focus on imaging radar with multiple transmit and receive channels (MIMO-SAR). Since 2011, Tobias Rommel is working as a research associate at the Microwaves and Radar Institute of the German Aerospace Center (DLR) in Oberpfaffenhofen. His current research focuses on signal processing, DBF, MIMO-SAR, waveform analysis, development of radar hardware and radar antennas. In 2017, he worked as a guest scientist at NASA's Goddard Space Flight Center. Meanwhile, since 2012 he teaches at the Professorship for Microwave Engineering and Photonics at the Technical University in Chemnitz. Tobias Rommel is an active member of VDE-ITG, IEEE, and U.R.S.I. He authored more than 40 publications in the field of SAR and is the winner of several national and international scientific awards.
 Milos Krstic received the Dr.-Ing. degree in electronics from Brandenburg University of Technology, Cottbus, Germany in 2006. Since 2001 he has been with IHP Microelectronics, Frankfurt (Oder), Germany, where he leads the team in the Wireless Communication Systems Department. From 2016 he is also the professor for “Design and Test Methodology” at the University of Potsdam. For the last few years, his work was mainly focused on design methodologies for digital systems integration. He has published more than 150 journal and conference papers, and has registered eight patents.
 M. Younis, received the Dipl.-Ing. (M.Sc.) and Dr.-Ing. (Ph.D.) degree in electrical engineering from the Universität Karlsruhe (TH), Germany, in 1997 and 2004, respectively. From 1998 to 2004, he was a research scientist with the Institut für Höchstfrequenztechnik und Elektronik, Universität Karlsruhe. Since 2005 he has been with the Microwaves and Radar Institute of the German Aerospace Center (DLR). He is currently Head of the SAR Techniques Group at the DLR and Professor for Spaceborne Radar Systems at the Karlsruhe Institute for Technology (KIT), Karlsruhe, Germany. He is the author and co-author of about 160 conference papers, 35 reviewed publications and holds four patents. Dr. Younis is an active member of the IEEE and currently serving the GRSS AdCom. He co-chairs the Instrumentation and Future Technologies GRSS Technical Committee. He is the associate editor for the IEEE Geoscience and remote sensing letter.