I. INTRODUCTION
This work is a joint study between the Laboratory of Electronics Antennas and Telecommunications (LEAT) and the Electronic Navigation Research Institute ENRI, in the framework of a Sakura project, supported by the JSPS and the French Ministry of Foreign Affairs, in order to design a detection system for debris (or FOD – Foreign Object Debris) on airport runways.
The background of this study is the crash of the Concorde airliner in France in 2000. Since over 5 years, several companies have developed, proposed, and tested automated FOD detection systems. Different approaches were investigated: the Tarsier by QinetiQ [Reference Beasly, Binns, Hodges and Badley1] is based on millimeter (mm)-wave radar modules operating around 94 GHz and has been recently completed by a camera for identification purposes. Two large radar modules are necessary for covering one runway. On the other hand, optical-based systems have also been proposed: they are based on CCD camera, LIDAR, or LADAR equipments [2, 3]. The latter are the most performing regarding identification capabilities but performances are greatly decreased under bad weather conditions. Another approach also uses mm-wave radar but within the 77 GHz band [4, 5]. Although it is less favorable than the 94 GHz one for propagation, it benefits from the low-cost MMICs developed for the automotive cruise control application. In addition to that, the possibility to work with a bandwidth of 5 GHz improves the range resolution [Reference Zeitler, Lanteri, Pichot, Migliaccio, Feil and Menzel6]. The 77 GHz FOD detection system consists of several small low-cost radars placed near the runway, each of them covering a given part of it. This approach was chosen for our study. The mm-wave radar module consists of a 76.25–76.75 GHz integrated front-end ending with a quasi-optical antenna of reflectarray type. Since 2009, an advisory circular has specified the minimum requirements for each system [Reference O'Donnell7]. A stationary radar module operating within the 70–80 GHz bandwidth should detect a 1.0-inch (2.5 cm)-diameter object comparable to the calibration target of any color or reflectivity on the runway surface at a distance up to 150 ft (46 m) from the sensor. For a mobile radar module operating at 77 GHz, the specification is the detection of a −20 dBsm object. In addition, a list of calibration objects has been included in the circular. These objects are real FODs like runway materials, rubber, mechanics tools, distorted metal strip, etc. The present paper investigates the 77 GHz radar performances with respect to the detection capabilities of a −20 dBsm object. In a previous work [Reference Mazouni8], a circularly polarized reflectarray antenna (gain 35 dBi) had been used showing detection capabilities in a controlled environment (i.e. anechoic chamber). These first measurements have shown that it was necessary to increase the antenna gain and at the same time the benefit of using circular over linear polarization has not been clearly demonstrated yet. Therefore, a new antenna, with improved gain and linear polarization for design purpose simplification, has been made. In addition, a measurement campaign has been conducted in December 2010 in Tokyo. It has been carried out with a narrowband configuration (76.25–76.75 GHz). More recently, a wideband radar module has been assembled with a parabolic reflector antenna made of carbon fiber-reinforced plastic (CFRP). Tests have been conducted outside on the roof of the LEAT building (France).
The paper is organized as follows: Section II describes the mm-wave front-end. Section III deals with the antenna solution. System performances are investigated and discussed in Section IV.
II. THE RADAR MODULE
We assembled a radar system for the field test. Figure 1 shows the radar with reflectarray. The radar is developed at the ENRI for FOD purpose only. It includes a small wideband RF module [Reference Kohmura9] and several control circuits. This radar emits an FM signal from 76.25 to 76.75 GHz within Japanese radio frequency allocation for W band radar. The radar is of FM-CW type with triangular FM modulation with a repetition frequency of 360 Hz. The signal is down converted into IF band and loaded via an AD converter with a sampling frequency of 2.5 MHz. The radar is mounted on a mechanical rotator to achieve an azimuth scanning.
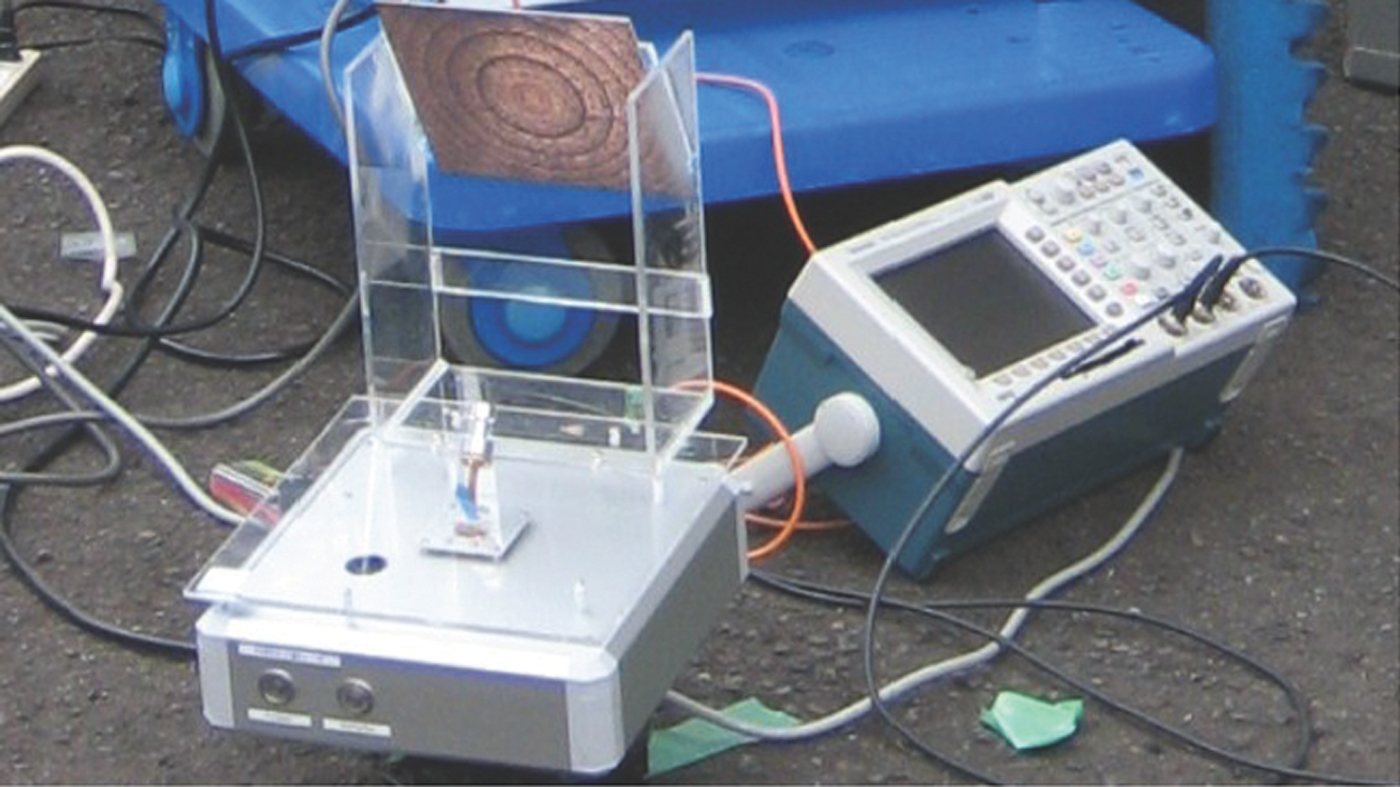
Fig. 1. 76.25–76.75 GHz band front-end with antenna.
Theoretically, the maximum unambiguous range R max and the range resolution ΔR are computed with equations (1) and (2), respectively:
Here, c is the speed of light, T r is the chirp duration time of one cycle, and ΔF is the modulated frequency band.
Moreover, in FM-CW radar the distance to the target is derived from the beat frequency, F beat with
One of the FM-CW limitation that comes from the system point of view is the maximum beat frequency that is given by the sampling rate F sampl of the AD converter:
Note that in practice the radar electronics also limits this value because of the bandwidth of the intermediate frequency filter. Nevertheless, this limit is 1.9 MHz in our case and is always higher than the one derived from the sampling rate.
Therefore, the maximum detection range of this radar is obtained by substituting (4) into (3) as described in
As a consequence, the actual range resolution ΔR FFT is expressed with the sampling number N sampl as
In order to have a better resolution range, a second radar module has been developed based on the direct conversion method [Reference Uebo, Okubo and Iritani10]. The radar scheme is given in Fig. 2 together with a photo of the whole radar. The module is designed for operating between 73 and 80 GHz, the antenna is a parabolic reflector made with CFRP. The azimuth scan is done with a rotator placed in the radar housing below the antenna. It makes the whole system more integrated compared to the first module.

Fig. 2. Wideband radar front-end scheme and photo.
This system also includes an AD converter inside of the chassis and its sampling rate and the sampling points are fixed as 1 MS/s and 1024 points, respectively. This limit decreases the actual maximum range but it is not critical for our application since it requires a range of only a few hundreds of meters.
A new measurement campaign has been conducted in autumn 2011 and is described in Section IV. Figure 2 (left) is a photograph of the assembled radar.
III. ANTENNA SOLUTION
Two antenna solutions were investigated. The first one is the reflectarray antenna described in Section A. It is used with the low band radar module whereas a parabolic CFRP reflector antenna is used with the wideband module. However, due to lack of time, the reflectarray antenna, although being wideband could not be tested with the wideband module.
A) Reflectarray antenna
The chosen antenna is a printed reflectarray. Due to the relatively low level of the power delivered by the front end and the small objects that have to be detected, we have chosen to design a very directive antenna with 40 dBi gain. For this purpose, emphasis was put on the following characteristics:
– new primary feed based on prolate function;
– phase distribution calculated for an offset with a maximum radiation at 27° in elevation.
Printed reflectarrays have demonstrated their capabilities for mm-wave radar since over 15 years [Reference Pozar, Targonski and Syrigos11–Reference Lanteri, Migliaccio, Dauvignac and Pichot13] because they provide high directive antennas within compact platforms. In addition, the prolate horn chosen as the primary feed of our reflectarray is more effective for f/D = 1. The large focal length value is not a problem for the application since the total height of the system can be up to 40 cm according to the airport regulations. The primary feed influence on a reflector antenna can be compared to the effect of a window in signal processing. The prolate window modifies the signal in such a way that 99% of the power is within the main lobe. As a consequence, the secondary lobes are greatly reduced such as the overall noise level. According to these interesting properties a primary feed horn has been designed having a prolate-shape radiation pattern. Simulations have been conducted with an equivalent aperture method to estimate the antenna size with respect to the gain and secondary lobe levels. Due to the simplicity of the model, both of them are over-estimated in simulation as it will be seen in measurement results. The printed reflector is manufactured with classical printed circuit techniques for low-cost purpose on a Duroid 2.2 substrate of 0.254 mm height. Furthermore, the prolate horn diameter is about 2.5 wavelengths and would cause severe aperture blockage in a centered primary feed reflectarray configuration. Therefore, a 27° offset is used (see Fig. 3) and the main beam is shifted accordingly to avoid specular reflection.

Fig. 3. Antenna setup: D = h1 = 160 mm, h2 = 81 mm.
Measurement results in both azimuth and elevation planes are shown in Figs 4(a) and 4(b). For this purpose, a special antenna fixture was made. It is worth mentioning that it is different from the one that can be seen in Fig. 1. The consequences will be discussed in Section IV.

Fig. 4. Radiation patterns measurements at 77 GHz: (a) elevation plane at 77 GHz and (b) azimuth plane at 77 GHz.
Secondary lobes remain below 25 dB for both planes but their level is higher than the simulated one as expected. One can observe perturbations in the elevation plane for scan angles between −30 and −80°. They are due to our measurement system. We are not able to rotate both in azimuth and elevation, as only a rotation in the yOz plane is provided. Therefore, the elevation plane is obtained by turning of 90° the whole antenna and the measurement system itself (mm-wave heads) blocks the reflector surface under negative scan angles. Gain measurements were also conducted. The antenna has been originally designed for 75–81 GHz and reaches its highest gain values (up to 42 dBi) in the upper part of the bandwidth. Between 76.25 and 76.75 GHz, the minimum measured gain value is 39 dBi.
B) CFRP reflector measurements
The CFRP antenna is a classical conformed reflector with a parabolic profile and a standard WR-10 open waveguide as primary feed. Figure 5(a) is the typical radiation pattern measurement in azimuth. The frequency of 76.5 GHz is chosen because it corresponds to the center of the frequency band. Figure 5(b) shows the gain variations between 75 and 81 GHz. The 73–75 frequency band could not be measured because of the cut-off frequency of the mm-wave heads used in the measurement system that is the W-band (75–110 GHz) one.
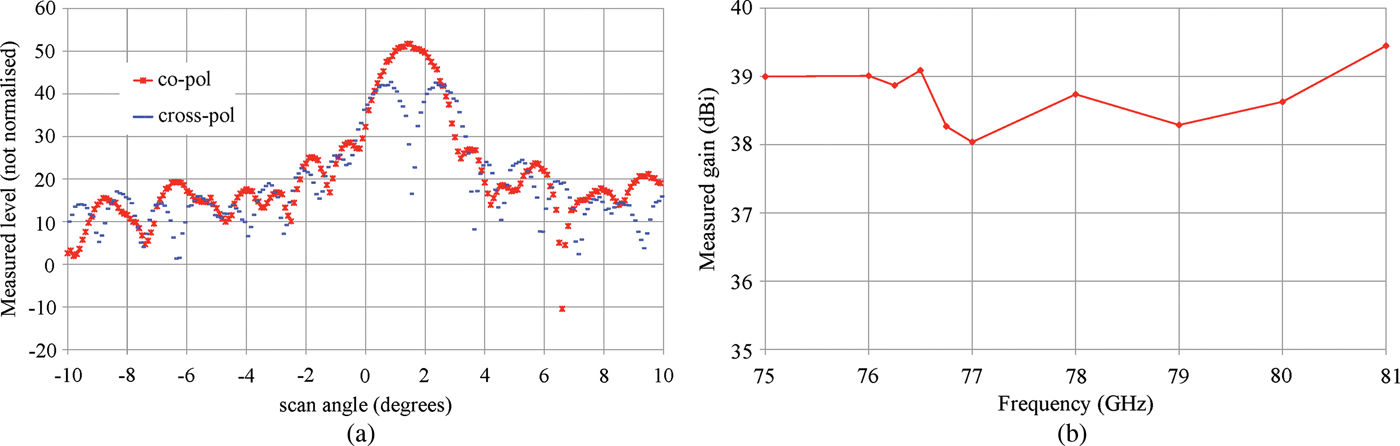
Fig. 5. CFRP reflector antenna measurements: (a) ±10° azimuth plane at 76.5 GHz and (b) measured gain.
Antenna beamwidth is 1.6° and gain variation does not exceed 1.5 dB within the band of interest. The maximum value is 39.5 dBi. The relatively high cross-polarization level in the main lobe is due to the conformal shape of the reflector that twists the horizontal polarization issued from the open-ended waveguide.
IV. RADAR MEASUREMENTS
As discussed in the introduction, measurements are focused on the detection of test objects selected according to the FAA circular [Reference O'Donnell7]. An FOD detection radar must be equipped with the sensitivity to pick up a small target with −20 dBsm of RCS.
Two types of measurements were carried out. They were conducted in December 2010 with the narrowband configuration and in September 2011 with the large band radar, respectively. Table 1 sums up the radar setups used for both measurements.
Table 1. Radar setups for narrow- and wideband measurements.

A) Narrowband measurement setup
For the evaluation of the sensitivity of the radar, three metallic cylinders (0, −10, and −20 dBsm) and a corner reflector (28 dBsm) were used. Each cylinder has the same dimension in diameter and height: cylinder C1 with 134.5 mm, C2 with 62.4 mm, and C3 with 29.0 mm. RCS values were calculated using [Reference Knott, Shaeffer and Tuley14] at 78.5 GHz in the perspective of larger bandwidth measurements. Figure 6 shows the scene scanned by the radar. As we want to have flexible scan angle range, the latter is defined manually but it will be fixed in a final system. Radar parameters are those defined in Table 1. Table 2 shows the associated predicted values for the range resolution and maximum detection range.

Fig. 6. Scene scanned by the radar.
Table 2. Predicted parameters for narrowband measurements.
The distance on each scanning line is estimated from the IF spectrum obtained with the FFT having Hanning window over the average from 16 time domain signals in order to improve the S/N ratio.
B) Narrowband measurements results
Figure 7 shows the measurement result of the 60° scanning image done at the ENRI.

Fig. 7. Measurement data with objects at 20 m: (a) without post-processing and (b) with post-processing.
The four test objects were placed on a 20 m circle from right to left (Fig. 7(a)): the corner reflector, C3, C2, and C1. We can see some remaining noise at 10, 13, and 30 m range but main elements of the scene can be seen through strong reflected signals: the metallic fence and pipe, building, and the bicycle. In addition, the ENRI internal road boarder can be easily recognized due to some periodically placed metal plates used to provide a smooth transition between the sidewalk and the ENRI road. The main road outside of the ENRI can also be seen with strong reflections coming from the cars. We can distinguish the main elements of the scene at 20 m except for the corner reflector because it is mixed with the strong reflection of the metallic fence.
In order to improve the results, a simple post-processing has been added. It consists in both a subtraction of external elements of the scene, like the metallic grid or the bicycle, and the introduction of a threshold. As expected noise at 10, 13, and 30 m are reduced results are shown in Fig. 7(b) and external elements of the scene are removed. It is now possible to distinguish the four objects. Strong reflections from the main road still remain due to the moving cars.
Investigations have been pursued while placing the objects at 35, 40, and 45 m. C3 has been detected until 35 m and possibly until 40 m but the peak–level is too weak to be sure of the detection. First estimations have shown that 3 dB improvement of the EIRP would be sufficient for detecting C3 at 45 m. As the emitted power cannot be changed it is necessary to increase the gain of the antenna.
C) Wideband measurements
Wideband operation has been investigated in order to improve the system resolution. A second measurement campaign has been conducted in autumn 2011 on the roof of the LEAT building (Nice-France) with the radar described in Fig. 2. The FMWC radar parameters are the one given in Table 1. Table 3 shows the associated the predicted values for the range resolution and maximum detection range.
Table 3. Predicted parameters for wideband measurements.
The theoretical range resolution is 2.5 cm but only 3.2 cm in the radar due to the sampling frequency.
In order to be as close as possible to the runway case, we have chosen a place with few external fixed objects. Therefore, we went on the roof of the LEAT building. Figure 8 is a partial view of the scene scanned by the radar. We can distinguish some fixed fences equally spaced of 5 m, a metallic cabinet in the back and the roof border that is approximately 5 cm in height. All measurements were made with the radar rotating of 360° in azimuth. The elevation is fixed at the beginning of the experiment in order to detect as many objects as possible placed on the ground.

Fig. 8. Front view of the scene scanned by the radar.
As in the previous measurement campaign, test objects have been selected with canonical shapes as shown in Fig. 9. Square boxes were added to cylinders because of their RCS sensitivity versus the incidence. A simple threshold is applied as post-processing.

Fig. 9. Test objects and estimated RCS from [14].
First of all, objects are placed on a line (see Fig. 10 on the left) 10 m away from the radar. The first object on the line (O5) remains at its place whereas the other one are progressively moved closer. In Fig. 10 on the right side, the five objects are placed at about 1 m from each other.

Fig. 10. Range resolution with O1 to O5 spaced from 30 cm. Left: objects placement. Right: radar image.
The five objects can be clearly distinguished on the radar image of Fig. 10 (right). In Fig. 11(a) the spacing is reduced to 30 cm and only four objects are separated, the square metallic box O4 is missing. It can be explained by its sensitivity to the incidence. O4 has been moved and the elevation is now different compared to the one of Fig. 10. In Fig. 11(b), only three spots can be distinguished. The largest spot corresponds to the positions of O1 and O2 whose responses are most probably mixed in a single spot. Indeed the space of 10 cm between O1 and O2 is taken from center to center. It means that the distance between their borders is less and is too close to the pixel resolution for enabling a separation. One possible solution to improve this is to use more complex signal processing (here it is limited to an FFT+ window). First of all, the window type has to be considered. The Haning window reduces the secondary lobes but at the same time it broadens the main lobe. This is not optimal in the case of very close targets. In addition, if the target is distributed (i.e several wavelengths as it is the case here) its answer spreads out and mixes up with the nearest target. SAR algorithm might improve the target separation but would also require another measurement system able to provide multi-view.

Fig. 11. Range resolution with O1 to O5 spaced from 10 and 30 cm: (a) 30 cm between objects and (b) 10 cm between objects
Moreover, one has to consider the internal limitations of the radar. First of all, the theoretical resolution is not reached because of the sampling frequency value from the ADC. The range resolution is of 3.2 cm instead of 2.5 cm but this small difference is not critical since the objects are placed 10 cm from each other. Several other factors might affect the radar performances such as the non-linearity or repeatability of the waveform or the overall noise level. The use of the DDS combined with a PLL insures both a good repeatability and linearity of the waveform generation. It was measured that this radar has a fine linearity of the chirp when the chirp duration time is 1.5–6.3 ms. Nevertheless, the overall noise level is critical. It is mainly due to the power supply and is not linear with frequency. This has to be worked out in the perspective of the overall radar improvement.
In addition, tests were conducted in order to check the impact of the bandwidth on the image resolution. Comparative measurements were done with 500 MHz, 3 GHz, and 6 GHz bandwidth on a same radar scene on the roof building of the LEAT. It is clear on the radar images that the largest bandwidth provides the best resolution. Four FOD were placed but the scene also contained other targets like the roof border, metallic blocs, and a metal locker. In practice, all the objects placed in the radar scene could be distinguished with the 6 GHz bandwidth. The two closest FODs mixed up with the 3 GHz bandwidth and the result got worse with the 500 MHz image.
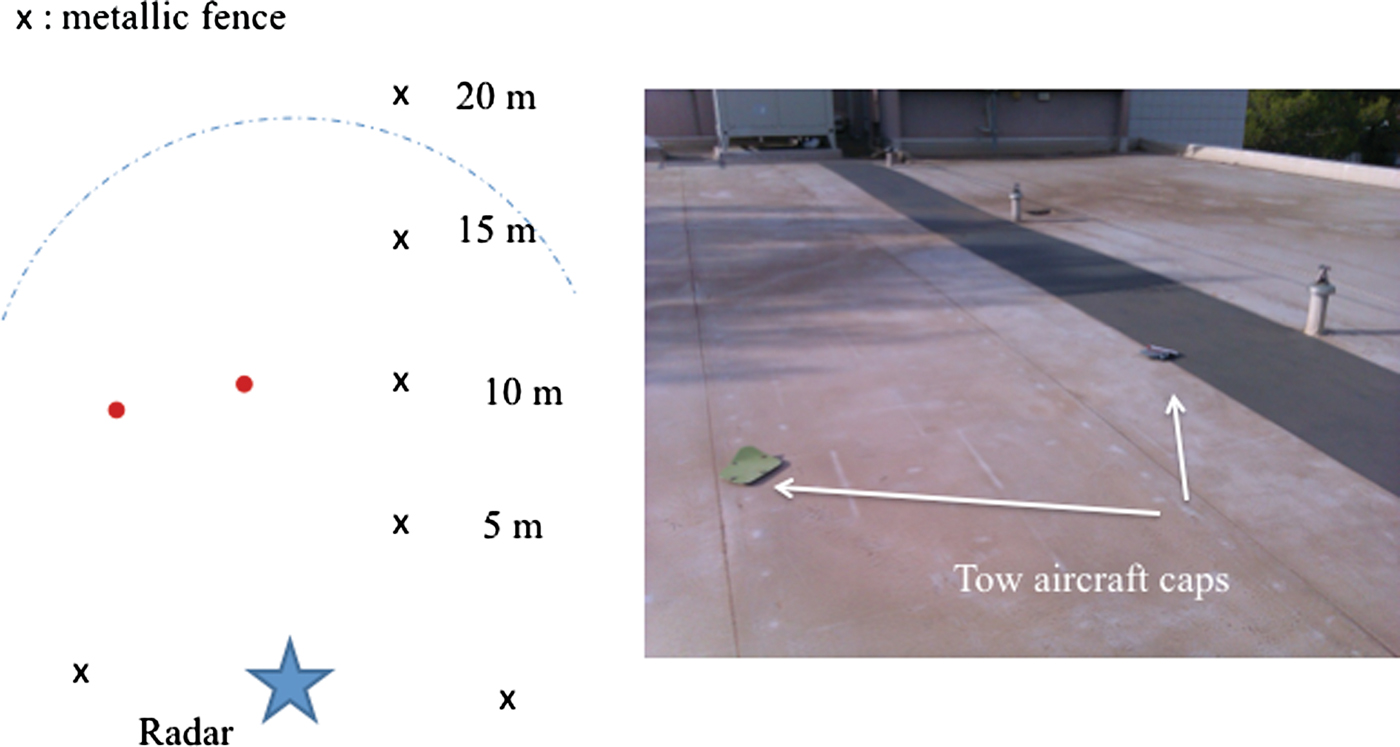
Finally, real FODs from Charles de Gaulle airport are placed on the LEAT's roof as shown in Fig. 12. They are two caps from aircrafts. Figure 13 is the corresponding radar image. As in the former images the borders of roof of the building are clearly seen as well as the fences. The two FODs are detected as well.

Fig. 12. Tests with real FOD.

Fig. 13. Radar image with real FODs.
D) Discussion
The antenna gain has been measured again with the fixture used for the radar and it was found out that its value is comprised between 36 and 36.5 dBi between 76.25 and 76.75 GHz. This 2.5 dB discrepancy is due to a bad alignment between the primary source phase center and the reflectarray surface. A new fixture is under construction and first results have shown that the 39 dBi are retrieved. It might be sufficient for detecting the −20 dBsm objects but the bandwidth extension up to 80 GHz will also improve the detection since the antenna gain is between 40 and 42 dBi in the upper frequency band.
Beyond expected improvements that are brought through the use of 6 GHz for increasing the range resolution, it is worth evaluating the system limitations. For this purpose the RCS of simple objects has been calculated using a 2D-TM approach with a software developed at the LEAT based on the method of moments. The 2D-TM case is a worthwhile approximation considering that the size of many FODs is several wavelengths at 76.5 GHz.
The objects under investigation are thin metallic plates. This scenario is of interest because the Concorde crash was caused by a thin piece of metal. 10 cm long, and, respectively, 2, 5, and 15 mm-high metallic plates were simulated. Results are shown in Fig. 14. In the simulations the external medium is air. As expected, most of the scattered fields are in the direction opposite to the emitting antenna and are difficult to detect with monostatic radars. If the height of the plate increases it might be possible to see it because in our case we have quasi-perpendicular incidence. A multi-static configuration would provide more RCS (about 18 dB for the 2 mm plate). Although it would be possible to test it in the laboratory in a controlled environment using an mm-wave network analyzer for example, it is still challenging to synchronize several W-band radar modules and is therefore part of a middle-term research.

Fig. 14. RCS simulations at 76.5 GHz. Incident wave (blue arrow) corresponding to antenna placed 40 cm above the ground and 30.5 m from the object. Large circle: 0 dBsm step 5 dB.
V. CONCLUSION
The investigated detection FOD system has shown detection capabilities of a −20 dBsm target up to 35 m. Antenna gain improvement will increase the range detection. Furthermore, the first set of experiment conducted with 6 GHz radar bandwidth shows that a separation of 30 cm between objects can be reasonably expected. It might be sufficient for FOD detection and counting objects but it is still critical for accurate identification. An optical system coupled to the radar could perform this task. In addition, more sophisticated signal processing could be included such as a CFAR algorithm and Doppler calculation in order to discriminate the moving targets.
On the other hand, investigations on the RCS of simple objects have shown the limitations of monostatic radar configuration. The model will be further improved while changing the Green function in order to reach the more realistic case where the plate is on the asphalt.
Finally, an interesting issue would be to work in multi-static configuration in order to improve the detection but also to provide some image that can be used for identification. The distributed system is equipped with an individual scanning mechanism for each mm-wave module therefore it should be able to provide a multi-view scene but the main problem remains the synchronization between the mm-wave modules.
ACKNOWLEDGEMENTS
This work was supported by the JSPS (Japan Society for Promotion of Science) and the French Ministry of Foreign Affairs under project number PHC Sakura 21153ZF.
 Karim Mazouni was born in France, in 1980. He received the B.S. degree in electronic and electrical engineering and automatics from the University of Nice-Sophia Antipolis, France, in 2006 and the M.S. and Ph.D. degrees in electronic engineering from the University of Nice-Sophia Antipolis, France in 2008 and 2011, respectively. He is actually a post-doctoral researcher at the Ulm-University (Germany). His major research interests concern millimeter antenna, reflectarray, radar system, FOD and power line detection and actually SAR and motion compensation.
 Armin Zeitler Armin Zeitler received the Dipl.-Ing. degree in electrical engineering from the University of Ulm, Germany, in 2009. Since 2009, he has been as a research assistant with the Electronics, Antennas and Telecommunications Laboratory, University of Nice-Sophia Antipolis, France, where he is engaged in the investigation of mm-wave imaging and radar systems.
 Jérôme Lanteri received the M.S. and Ph.D. degrees in electrical engineering from the University of Nice-Sophia Antipolis, France, in 2004 and 2007, respectively. He was a post-doctoral researcher at the University of Nice-Sophia Antipolis, France, from 2007 to 2008, and at CEA-LETI, Grenoble, France, from 2008 to 2010. Since September 2010, he is Associate Professor at the University of Nice-Sophia Antipolis, France. His research interests include integrated antennas for gigabit wireless communications, reflectarrays and transmitarrays at millimeter-wave frequencies.
 Christian Pichot (M'83) was born in France in 1951. He received the Ph.D. and the Doctorat ès Sciences degrees from the University of Paris-XI (Orsay), France, in 1977 and 1982, respectively. In 1978, he joined the Laboratoire des Signaux et Systèmes, CNRS/Ecole Supérieure d'Electricité, Gif-sur-Yvette, France. During the 1989–1990 academic year, he was a Visiting Researcher at the Lawrence Livermore National Laboratory, Livermore, CA. From 1992–1995, he was with the Laboratoire d'Informatique, Signaux et Systèmes de Sophia Antipolis, University of Nice-Sophia Antipolis/CNRS, Valbonne, France. He is currently a Research Director CNRS and Director of the Electronic, Antennas and Telecommunications Laboratory, joint research unit supported by the University of Nice-Sophia Antipolis and CNRS, France. He was Chairman of the Platform “Design” of the Microelectronics Integrated Center of the Provence-Alps-Riviera Region (CIM PACA), France, from 2005 to 2007. His research activities concern scattering and propagation of electromagnetic waves, radiation of antennas, inverse scattering (microwave imaging and tomography, complex permittivity reconstruction, object detection and recognition), theoretical analysis, numerical and experimental aspects for applications in radar, civil engineering, non-destructive testing, engineering geophysics, security and military applications, antennas, telecommunications, and medical domain, VLF/LF frequencies, microwaves and millimeter waves.
 Jean-Yves Dauvignac is a Professor at the University of Nice-Sophia Antipolis, France. During his Ph.D. thesis (1993), his research activities concerned the modeling of microwave antennas using finite-surface-element method to solve integral equations of the electromagnetic field. Since 1996, he has been involved in microwave imaging for the detection of buried objects and in the study of dielectric resonator antennas. He developed a new class of UWB antennas (ETS Antennas) in planar printed technology for GPR and radar synthetic impulse microwave imaging system (SIMIS) for surface penetrating radar applications. During this period, he has also contributed in several campaigns of measurements road survey, pipes and mines detection in collaboration with LCPC and ONERA. In 2002, he was involved in the design of UWB antennas for telecommunications applications and the measurements of UWB antennas in time domain. More recently, he has worked on the design of high-gain antennas for radar systems in millimeter waves. Actually, he continues his research and high-gain millimeter-wave antenna. Since 2000, he has been the head of the team “High gain antennas and UWB detection and imaging microwave and millimeter-wave systems” of LEAT.
 Claire Migliaccio received the “Diplôme d'Ingénieurs ENSERG” in 1993 and the doctoral degree in 1996 from the “Institut National Polytechnique de Grenoble”, Grenoble, France. From 1996 to 2007, she worked as Associate Professor in the University of Nice-Sophia Antipolis, France, and since October 2007, she is a Professor at the University of Nice-Sophia Antipolis. From 1996 to 2001, her research interest was focused on uniplanar large band antennas. Since 2001, she has moved to mm-wave antennas and systems. It includes the design of large antennas for radar applications, such as related measurements techniques. She has conducted or is involved in several mm-wave projects in collaboration with academic or industrial partners including collision avoidance system for rescue helicopters, large antennas for satellite communications or FOD detection system.
 Naruto Yonemoto received the B.E. and M.E. and Ph.D. degrees in electronic engineering from Saga University, Saga, Japan, in 1995, 1997, and 2000, respectively. He joined the Electronic Navigation Research Institute (ENRI), Japan in 2000. He was a visiting researcher of Laboratory of Electronic, Antennas and Telecommunication in France from 2005 to 2006. He is currently a chief researcher of ENRI. His research interest includes millimeter-wave radar system and electromagnetic compatibility. He is a member of IEEE, IEICE, EuMA.
 Akiko Kohmura joined the Electronic Navigation Research Institute, Japan as a researcher after receiving her Ph.D. degree in 2007. From 2011 to 2012, she has been with the Laboratoire d'Electronique, Antennes et Télécommunications, France as a guest researcher. Her main interests are millimeter-wave radar, antennas for the radar, and electromagnetic compatibility on aircrafts.
 Shunichi Futatsumori received the B.E. and M.E. and Ph.D. degrees in electronics and information engineering from Hokkaido University, Sapporo, Japan, in 2004, 2006, and 2009, respectively. From 2008 to 2009, he was a Research Fellow of the Japan Society for the Promotion of Science. In 2009, he joined the Electronic Navigation Research Institute (ENRI). Japan, where he has been engaged in the research of millimeter radar systems and electromagnetic compatibility issues. Dr. Futatsumori received the Young Researcher (Bs Award of IEICE and APMC prize, both in 2009). Dr Futatsumori is a member of the IEEE and IEICE.