Introduction
Speculations about life on other planets (Levin et al., Reference Levin, Scott, Cooper and West2017), taking their lead from observations of our own planet, almost invariably suppose that extra-terrestrial life will have some degree of complexity (cf. (Ward and Brownlee, Reference Ward and Brownlee2000; Lane and Martin, Reference Lane and Martin2010)). Complexity is ultimately the product of cooperation: two or more ‘units’ coming together because of the benefits derived from their cooperation. Indeed, it is hard to imagine life without the complexity and, while not technically a requirement for ‘life’ under its common definitions, the tight association between complexity and life would suggest that the former is almost an immediate derivative of the latter. At least on our planet, it would seem that cooperative interaction among individual parts or among individuals must have followed soon after the advent of self-replication (Maynard Smith and Szathmáry, Reference Maynard Smith and Szathmáry1995; Queller, Reference Queller1997).
Such interaction, however, often carries energetic costs and there is thus an intrinsic evolutionary advantage associated with not interacting. The astonishing predominance of socially cohesive groups and multicellular organisms on our planet has therefore presented evolutionary biologists with an intriguing theoretical puzzle: to explain the evolutionary emergence of positive social interaction, or cooperation (Nowak, Reference Nowak2012). Evolutionary implications of this puzzle are far from trivial, as it has direct bearing on most of the ‘major transitions’ in evolution (Maynard Smith and Szathmáry, Reference Maynard Smith and Szathmáry1995; Queller, Reference Queller1997; Szathmáry, Reference Szathmáry2015; West et al., Reference West, Fisher, Gardner and Kiers2015; Levin et al., Reference Levin, Scott, Cooper and West2017). Solutions to this puzzle invoke different mechanisms that include group selection (Nowak and Sigmund, Reference Nowak and Sigmund1998), direct (Axelrod and Hamilton, Reference Axelrod and Hamilton1981; Nowak and May, Reference Nowak and May1992) and indirect (Nowak and Sigmund, Reference Nowak and Sigmund1998) reciprocity, tagging (Riolo et al., Reference Riolo, Cohen and Axelrod2001) and kin selection (Hamilton, Reference Hamilton1964). Group selection is likely to be effective only under special circumstances (Price, Reference Price1972). Reciprocity, tagging and sophisticated kin selection require recognition systems that are often complex and are thought to be themselves products of a more primitive form of kin selection (Axelrod and Hamilton, Reference Axelrod and Hamilton1981): individuals simply help their neighbours who, due to the population's spatial structure, are likely to be kin. And by helping kin, they increase the survival probability of their lineage. In this framework, it is easy to see how cooperative traits might be favoured, offering probably the most parsimonious explanation for the primordial origins of social behaviour in its broadest sense and at least partial explanations for the subsequent evolution of more complex innovations such as social groups (Hamilton, Reference Hamilton1964), multicellularity (Michod and Roze, Reference Michod and Roze2001), growth restraint (Merlo et al., Reference Merlo, Pepper, Reid and Maley2006), rudimentary moral systems (Alexander, Reference Alexander1987) and virulence modulation (Frank, Reference Frank1994).
Not only is cooperation ubiquitous on our planet, but the physiological apparatuses associated with cooperation are numerous and can be quite complex. Indeed, a significant fraction of an organism's genome may be devoted to such apparatuses (Santorelli et al., Reference Santorelli, Thompson, Villegas, Svetz, Dinh, Parikh, Sucgang, Kuspa, Strassmann, Queller and Shaulsky2008). Consequently, a significant fraction of all mutations (or transformations) may hinder cooperation – a notion corroborated by experimental data (Velicer et al., Reference Velicer, Kroos and Lenski1998, Reference Velicer, Kroos and Lenski2000; Strassmann et al., Reference Strassmann, Zhu and Queller2000; Santorelli et al., Reference Santorelli, Thompson, Villegas, Svetz, Dinh, Parikh, Sucgang, Kuspa, Strassmann, Queller and Shaulsky2008). Most such cooperative functions carry an energetic cost and mutations that hinder these functions would, therefore, allow more energy to be devoted to individual growth and replication. It seems likely that such mutations, therefore, would often carry an immediate selective advantage at the individual level – another notion corroborated by experimental data (Velicer et al., Reference Velicer, Kroos and Lenski1998, Reference Velicer, Kroos and Lenski2000; Turner and Chao, Reference Turner and Chao1999; Strassmann et al., Reference Strassmann, Zhu and Queller2000). Furthermore, these mutants would continue to enjoy the benefits derived from neighbours whose cooperative functions remain intact. In sum, by neglecting their dues to society, these mutants can further their individual success and are therefore called cheaters (Velicer, Reference Velicer2003; Velicer and Vos, Reference Velicer and Vos2009). The ready availability of cheater mutations and the threat they pose to populations has been demonstrated quite strikingly in laboratory microbial populations (Turner and Chao, Reference Turner and Chao1999; Fiegna and Velicer, Reference Fiegna and Velicer2003; Harrison and Buckling, Reference Harrison and Buckling2005) and by models (Nelson and Perelson, Reference Nelson and Perelson1995; Nowak and Sigmund, Reference Nowak and Sigmund2004) like our mean-field first model (Methods). These observations lead to a new puzzle: given the very reasonable and recently substantiated premises that social cheater mutations are common and carry an immediate selective advantage, how can cooperation persist? We investigate the most rudimentary mechanism to promote the persistence of cooperation, namely population structure (Nowak et al., Reference Nowak, Bonhoeffer and May1994) and we find there exists a critical rate of production of cheater mutants above which this mechanism fails.
The most closely related precedents to our investigation (Ohtsuki et al., Reference Ohtsuki, Hauert, Lieberman and Nowak2006; Taylor et al., Reference Taylor, Day and Wild2007; Ichinose et al., Reference Ichinose, Satotani and Sayama2018) have focused mainly on the evolutionary emergence of cooperation rather than its maintenance, but some maintenance-related results have been obtained there. Within its broader context, this previous work addressed the question of whether an anomalous cheater mutant (or ‘defector’) introduced into a population of cooperators is likely to reach fixation and thus displace the cooperating wildtype. This approach is the standard population genetics approach but, while related, it does not naturally extrapolate to questions of cooperation maintenance. In particular, it does not take into account the synergistic effect of other cheater mutants appearing elsewhere in the population. The biological evidence (Velicer et al., Reference Velicer, Kroos and Lenski1998; Strassmann et al., Reference Strassmann, Zhu and Queller2000, Reference Santorelli, Thompson, Villegas, Svetz, Dinh, Parikh, Sucgang, Kuspa, Strassmann, Queller and Shaulsky2008; Velicer et al., Reference Velicer, Kroos and Lenski2000) would suggest that cheater mutations are not anomalous, isolated events but in fact can be quite common and are thus more accurately modelled as recurring at some rate throughout the population. Other related precedents have looked at how mutation may erode cooperation in iterative games when it is asymmetric (Garcia and Traulsen, Reference Garcia and Traulsen2012) or ‘local’ (of small effect on strategy) versus non-local (Stewart and Plotkin, Reference Stewart and Plotkin2015).
Modeling the evolution of cooperation with mutation
To model the maintenance of cooperation, we start with a population of cooperators and allow cheaters to arise by mutation (Gerrish, Reference Gerrish2010; Allen et al., Reference Allen, Traulsen, Tarnita and Nowak2012). We suppose that the cooperating wildtype helps other individuals in the population by increasing their fitness by an amount ε. If cooperation is altruistic, individuals only help others but do not help themselves; if cooperation is mutualistic, as in the production of a locally-shared public good, individuals help themselves as much as they help others (West et al., Reference West, Griffin, Gardner and Diggle2006). Also, we suppose that cheater mutants may receive help from cooperating wildtype but do not themselves help others; the energy and/or replication time they save by not helping others increases their individual fitness by an amount β. Cooperators become cheaters by mutation at rate μ (forward rate) and cheaters become cooperators at rate μ′ (backward rate). Heritable cooperation is typically the result of genetically programmed cooperative functions, while heritable cheating is typically due to the loss of such functions. For genetic reasons, therefore, it is reasonable to assume that μ > μ′.
In an unstructured population, dynamics are well-approximated by mean-field equations in which an individual may interact with any other individual in the population with equal probability (mass action). Under these well-mixed conditions, any amount of mutation results in the loss of altruistic cooperation for any ε > 0 and β>0 or in the loss of mutualistic cooperation for β > ε.
In a structured population, an individual's interactions are limited to a ‘circle of friends’, which may be modelled as neighbours of that individual on the population's interaction network which we assume to be static (c.f., Pacheco et al., Reference Pacheco, Traulsen and Nowak2006). Such a network is reflective of the kind of population structure, such as surface adhesion, that most likely gave rise to the earliest manifestations of social behaviour. In our model of structured populations, each individual occupies a node on a network and has n immediate neighbours on average. Figure 1 gives a synopsis of our model; details are found in the online supplementary material.
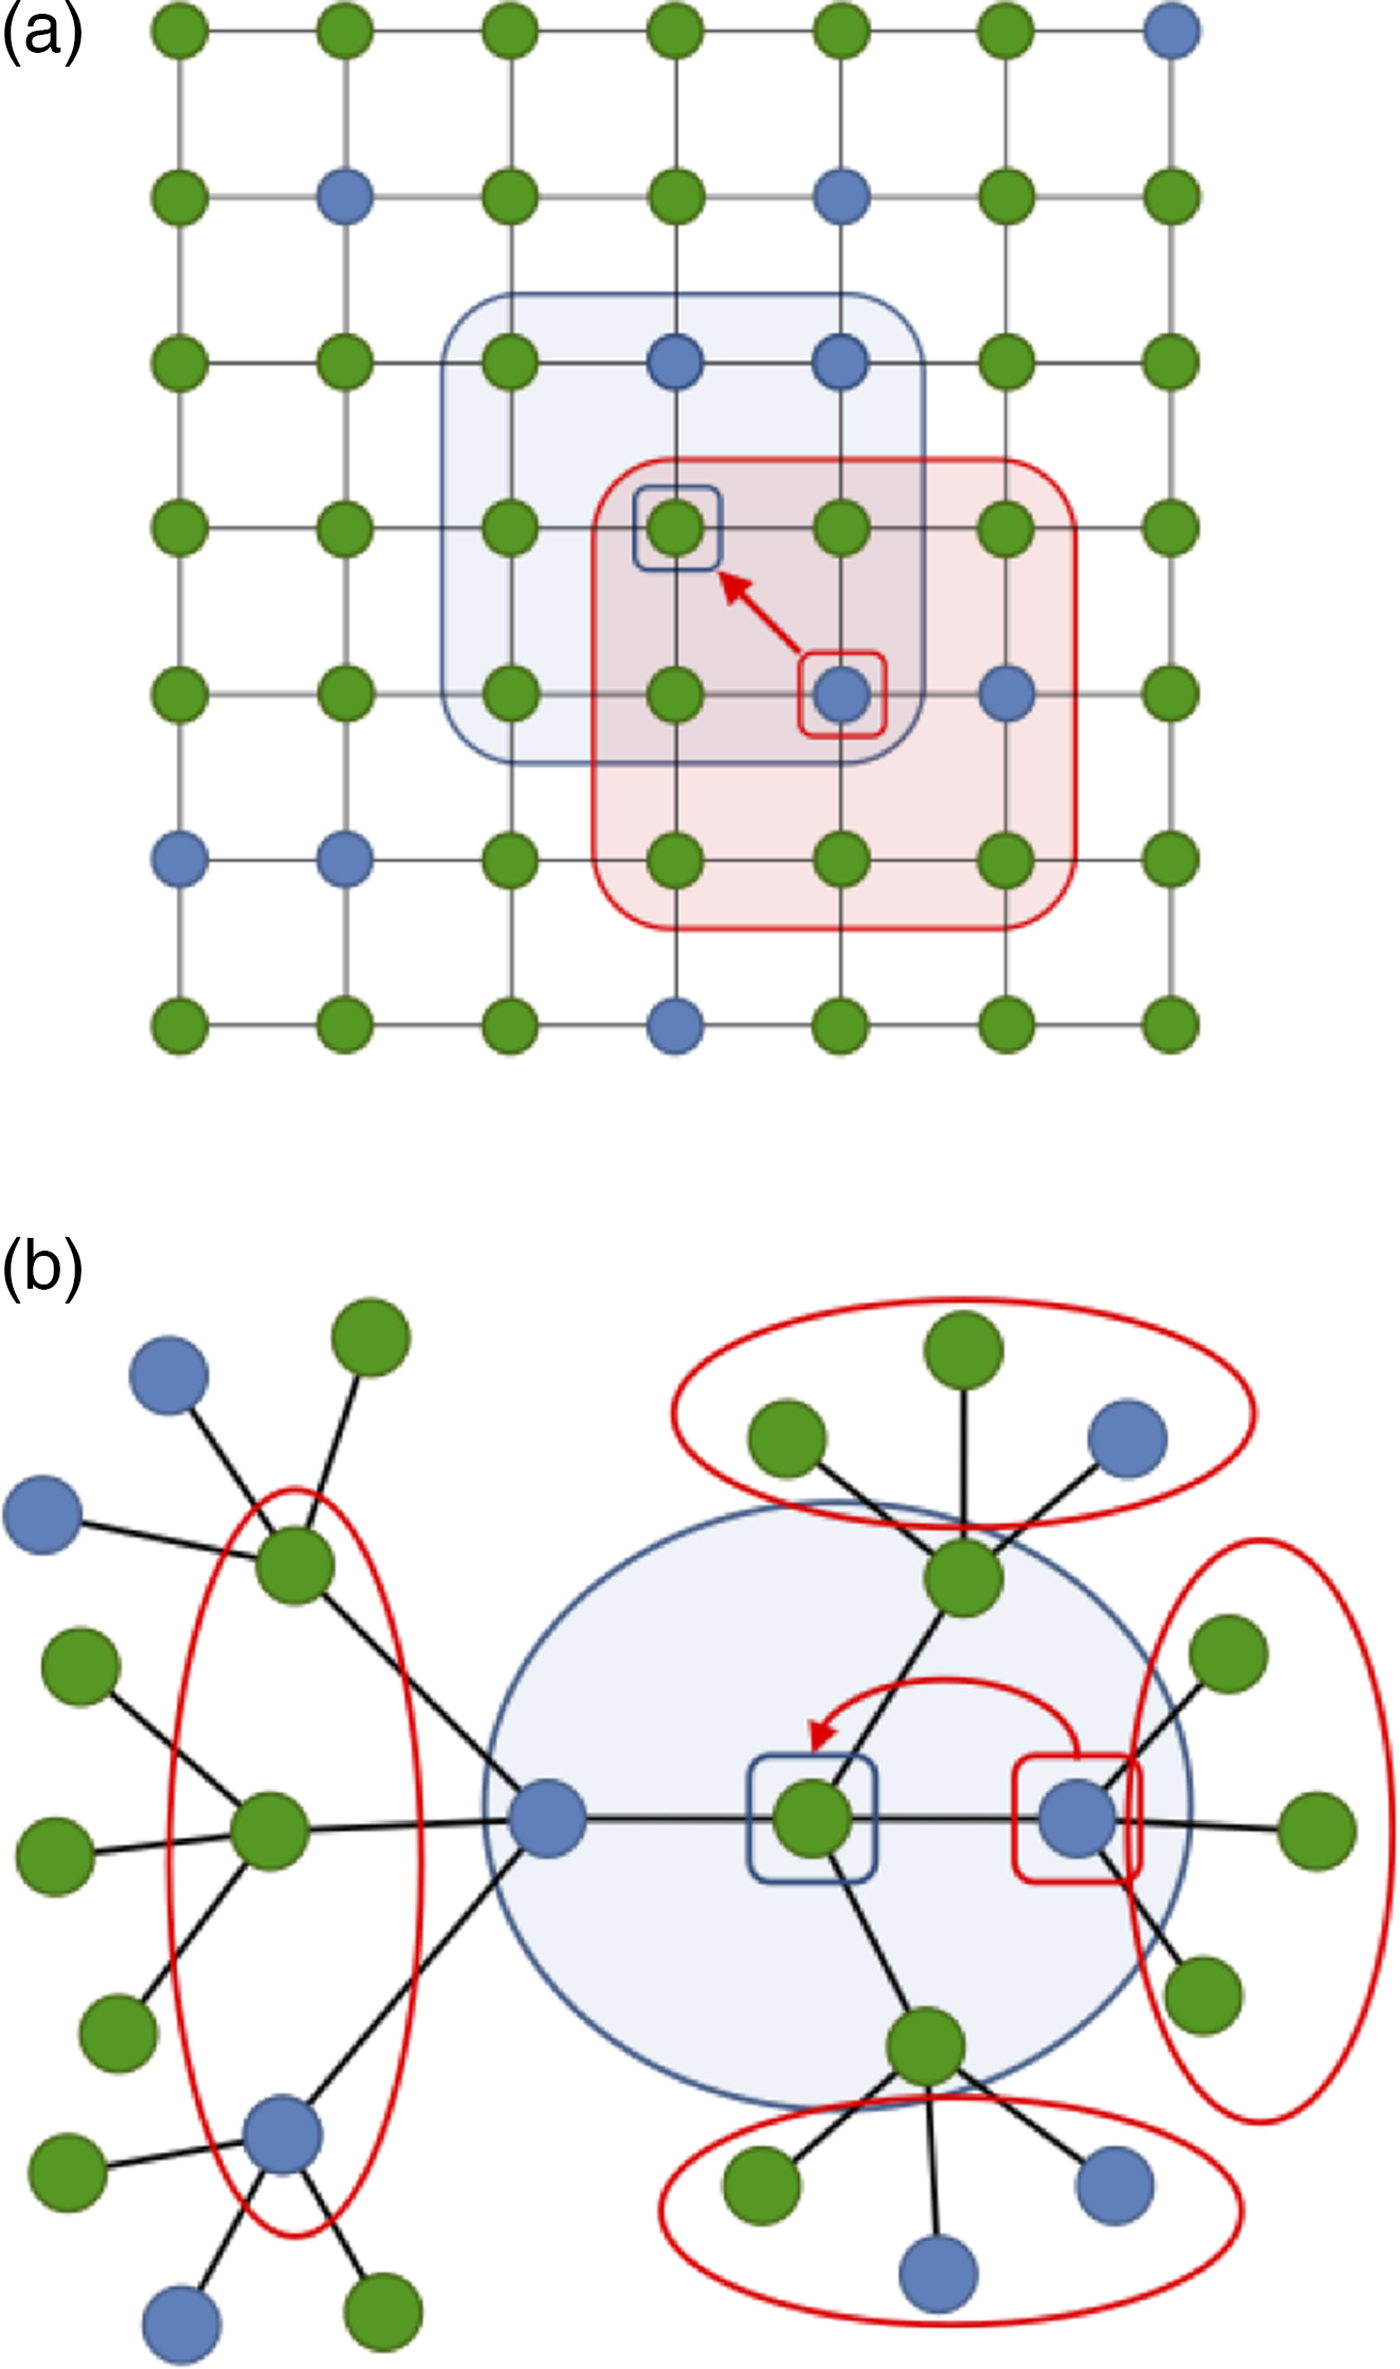
Fig. 1. Two different network configurations. Green nodes represent ‘social’ individuals; blue nodes represent ‘asocial’ individuals. Focal nodes are indicated by a small blue square; a candidate displacement comes from an immediate neighbour indicated by a small red square. Immediate neighbours of the focal individual are surrounded by a blue line; the focal individual's fitness increases as the number of immediate neighbours increase. Immediate neighbours of the candidate displacing neighbour are surrounded by a red line; the candidate displacing neighbour has a fitness that is also an increasing function of the number of its neighbours who are cooperators. To analytically model the evolution of cooperation through local competition on such networks, we employed the pair-approximation technique (Baalen, Reference Baalen, Dieckmann, Law and Metz2000; Ellner, Reference Ellner2001) (see SI). (a) a regular lattice network; (b) a regular tree network.
Results
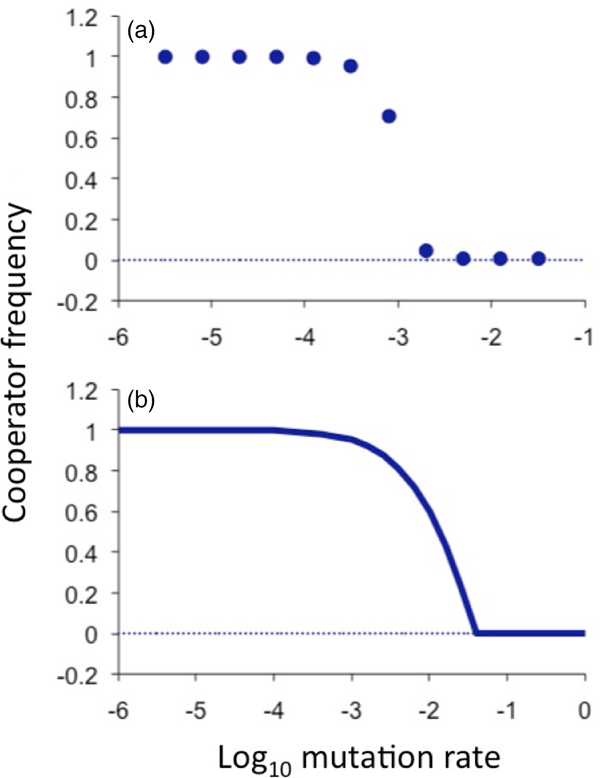
Our simulations show that, when interactions within a population are structured along the links of a network, primitive kin selection can effectively preserve cooperation despite recurrent cheater-mutations. The clustering necessary for kin selection to be effective, however, can be maintained and cooperation thus preserved, only as long as the mutation rate is low enough. There exists a threshold mutation rate (Fig. 2) above which cooperating clusters are disrupted from within by the advantageously scattered (Fig. 3) appearance and expansion of cheater mutants: as neighbourhoods increasingly consist of cheaters, support from neighbours decreases, kin selection erodes and it no longer pays to cooperate. As a result, neighbourhoods increasingly consist of cheaters and the cycle continues. This positive feedback results in a cascading loss of social cohesiveness above the threshold mutation rate – resembling a second-order phase transition – and ultimately in the complete loss of cooperation.

Fig. 2. Equilibrium cooperator frequencies as a function of mutation rate. (a) As determined from simulated populations that were spatially structured on a three-dimensional grid. The population initially consists of all cooperators and cheaters arise by spontaneous mutation. The intrinsic advantage of being a cheater (or cost of being a cooperator) was β = 0.01, the advantage conferred by a cooperating neighbour was ε = 0.05 and total population size was 27 000. (b) As predicted by the analytical equilibrium solution of the ‘pair approximation’ model (solving the equations f p = 0 and f q = 0 for p and q, as defined in the supplementary material and reporting p), using the same parameter values but implicitly assuming an infinite population. The threshold calculated by this model is higher than the threshold observed in simulations because of well-known error in this approximation scheme due to stochastic demographic effects. Nevertheless, the correction factor is constant over a wide range of parameter values and across various network topologies (supplementary material). This analytical curve reveals a sharp transition between the maintenance of cooperation and the complete loss of cooperation; the sharpness of the inflection resembles that of a second-order phase transition (supplementary material).

Fig. 3. Early growth dynamics. (a) Probabilities that cheaters gain a foothold in a structured population as a function of the initial distance between cheaters; ‘foothold probability’ is defined as the probability of a cheater being fixed in a small fraction of the population in the absence of mutation. Here, three cheaters were placed at random on a 10 × 10 grid such that each cheater was initially separated from the other two cheaters by a given distance (horizontal axis). Fixation probabilities (vertical axis) were calculated as the fraction of times cheaters reached fixation in a total of 50 000 simulations. This is not an individual-based fixation probability as typically calculated in population genetics but a collective fixation probability. The dotted line shows the probability of fixation of a neutral mutation; the fact that foothold probabilities are less than this value reflects the fact that in the absence of recurrent mutation, cheaters are not expected to be successful. (b) The average minimum distance between a cheater and its nearest cheating neighbour as a function of mutation rate. These averages were taken over all cheaters during the first 10, 30 and 50 generations of growth. At small mutation rates, rare cheater presence is due mostly to local replication, hence the small distance between cheaters and their nearest neighbours. As mutation rate increases, this distance increases as scattered mutants contribute more and more to the mean; eventually, scattered cheaters permeate the population enough to make this distance begin to decline.
Using analytical methods in the supplementary material, we derive an expression for the threshold cheater mutation rate above which cooperation cannot persist: μc ≈ k(α + 1)(ϕε − β), where ϕ = 1 if cooperation is altruistic and ϕ = 2 if cooperation is mutualistic, α is an index of how deterministic selection is (typically α = 1) and k = 0.030, a constant of proportionality (see supplementary material). From this expression, we derive the condition that μc > 0 only if ε > β when cooperation is altruistic, meaning that some level of cheater mutation can be tolerated only if the benefit conferred by a cooperating neighbour exceeds the benefit of being a cheater; this is a restatement of Hamilton's rule (Hamilton, Reference Hamilton1964) for clonal organisms in which relatedness approaches unity (West et al., Reference West, Griffin, Gardner and Diggle2006).
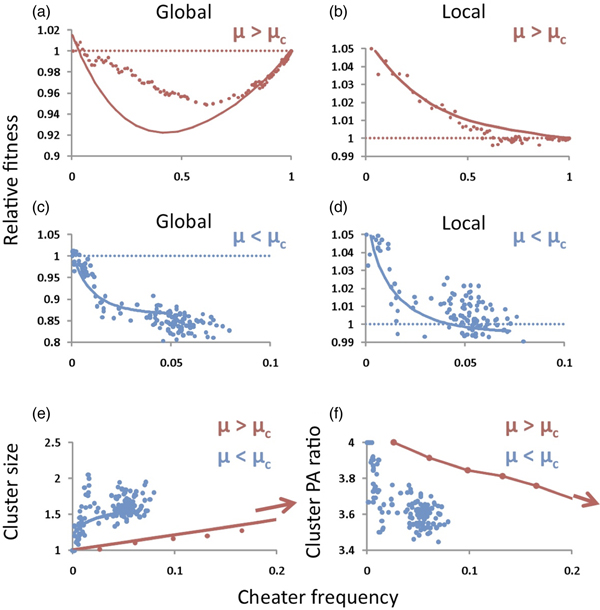
Cheaters have a fitness advantage when they are very rare (Fig. 4(a)) because most of them are isolated and surrounded by cooperators (Fig. 3(a)). As their frequency increases, however, their average fitness declines because as they grow, they leave offspring at neighbouring nodes (i.e., they form cheating clusters); on average, they become surrounded by more fellow cheaters and less cooperators and their average fitness decreases accordingly. On a global scale, therefore, cheaters become less fit than their cooperating counterparts as they grow (Fig. 4(a,c)). This means that if cheaters are to reach fixation – as they do when μ > μc – then they must cross an adaptive valley (Fig. 4(a)) which is problematic because it violates natural selection's tendency to increase fitness. The problem is resolved, however, by looking at the fitness dynamics of individuals relative only to their immediate neighbours (Fig. 4(b)). On this local scale, at high mutation rates (μ > μc), cheaters dominate their immediate surroundings at all frequencies, starting with a significant selective advantage when rare and decreasing in fitness as they grow until reaching a relative fitness of one at fixation. At low mutation rates (μ < μc), cheater relative fitness is lower overall on a global scale (Fig. 4(c)) because their small presence is due less to mutation and more to rare outgrowths (Fig. 3(b)), resulting in fewer clusters of larger average size (Fig. 4(e)); on average, cheaters are surrounded by more cheaters – a fact that is also reflected by the lower perimeter-to-area ratio of cheating clusters when mutation rates are low (μ < μc) (Fig. 4(f)). Figure 4(d) reveals the decisive consequence of this qualitative difference in cluster morphology: when μ < μc, local relative fitness of cheaters dips below one as cheater frequency increases – a hallmark of the game of Chicken (Velicer, Reference Velicer2003), which is known to maintain cooperation in a population because of the devastating costs of mutual (or collective) defection, as happens within the larger cheater clusters. The foregoing observations shed light on spontaneous growth patterns in structured populations, how these patterns selectively thwart cheater outgrowths when μ < μc and how these patterns change qualitatively as mutation rate exceeds μc, abruptly removing the selective repression of cheater growth.

Fig. 4. Understanding the threshold. Solid lines plot the ‘pair approximation’ analytical predictions and dots plot simulation results. Parameters were: ε = 0.1, β = 0.01, α = 2, n = 8 and μ = 0.001 for the low mutation rate (μ <μc, blue lines) and μ = 0.01 for the high mutation rate (μ >μc, red lines). For these parameter values, our theory predicts μc ≈0.008. (a,b) Global (a) and local (b) relative fitnesses for a mutation rate exceeding the critical value. (c,d) Global (c) and local (d) relative fitnesses for a mutation rate below the critical value. (e,f) Cluster size as cheater frequency increases (e). When mutation rate is low (blue line), cheaters exist in larger clusters, on average, with smoother peripheries evidenced by lower perimeter-to-area (PA) ratio (f). Within these clusters, fitness is low because of lack of mutual support; this situation mimics the over-consumption of a common resource and the ‘tragedy of the commons’ that results (West et al., Reference West, Griffin, Gardner and Diggle2006), apparent in panel (d) where local relative fitness dips below one.
The observed interplay between mutation rate and cooperation leads one naturally to question what happens when both are evolving, as is surely the case in real populations. When we allow both to evolve in our simulations, we find that there is a long period of apparent stasis followed by a relatively sudden rise of cheaters to fixation (Fig. 5(a)). This intriguing dynamic appears to be the inevitable result of genetic linkage. Mutators (individuals with elevated mutation rates) are more likely to produce cheater mutants than non-mutators and there is thus an intuitive association between cheaters and mutators. If mutators remain linked to the cheaters they produce then, initially, there is indirect selection for mutators because the cheaters they produce have an advantage when rare. Mutators increasingly permeate the population and cheater presence thus becomes more scattered, as evidenced by the increasing number of clusters and decreasing cluster size (Fig. 5(b)). Eventually, cheaters reach a critical rate of production throughout the population (through increased mutator presence) and cooperating clusters suddenly become ineffective against the spread of cheaters. At this point, cheaters invade (Fig. 5(a,b)) and concurrently: (1) average mutation rate increases (Fig. 5(c)), reflecting the fact that mutators ‘hitchhike’ with cheaters to high frequency (Sniegowski et al., Reference Sniegowski, Gerrish and Lenski1997) and (2) fitness decreases (Fig. 5(d)), reflecting the triumph of defectors in the game of Prisoner's Dilemma (Nowak and Sigmund, Reference Nowak and Sigmund2004) and the related Tragedy of the Commons (Hardin, Reference Hardin1968).
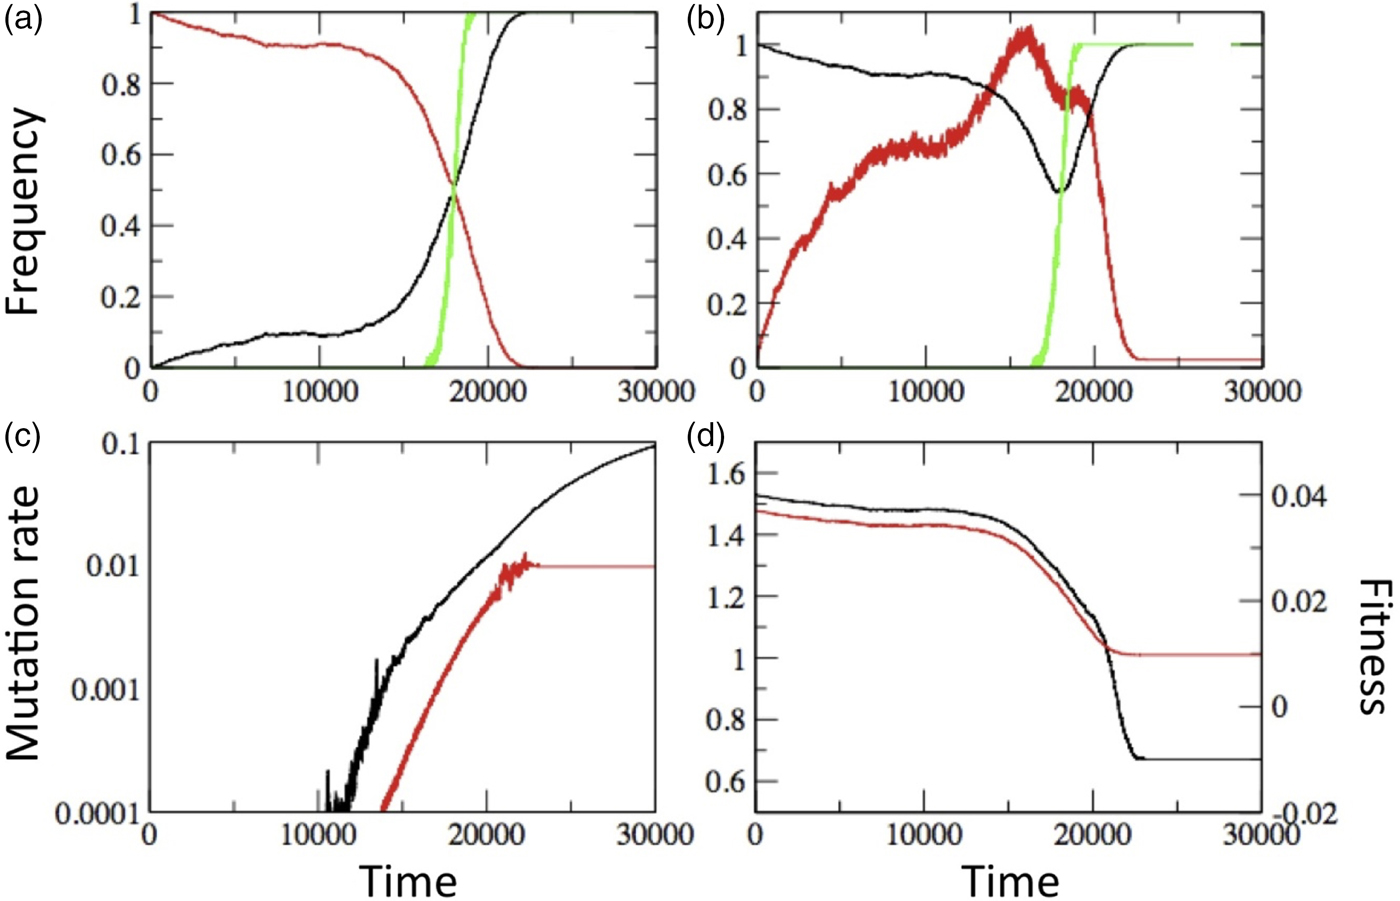
Fig. 5. Results of simulations in which both cheaters and mutation rate were allowed to evolve. The initial mutation rate was 10−5 cheater mutations per replication. Parameters values were: ε = 0.05, β = 0.01, α = 2, n = 8. (a) Frequency of cooperators (red) and cheaters (black) as a function of time. The green curve shows the probability that the major cluster is formed by cheaters, alluding to the related concepts of a percolation threshold and phase transition phenomena. (b) Number of clusters (red) and major cluster size (black); the two measures are normalized, respectively, by 40 (maximum) and 2500 (lattice size). Again, the green curve shows the probability that the major cluster is formed by cheaters. (c) Cooperator (red) and cheater (black) average mutation rate. (D) Mean fitness of cooperators and cheaters (red and black). All curves show the means of 100 simulations and lattice size of 50 × 50.
Discussion
The ubiquity of cooperation in nature and the cohesive complexity it produces indicates cooperation's robustness as an evolutionary strategy. The collapse of cooperation can be costly to a population in both relative and absolute senses: it can put a population at a disadvantage relative to other populations in which cooperation remains intact and it can impose an absolute cost by decreasing the intrinsic viability of a population even to the point of extinction. Identifying mechanisms that can lead to the collapse of cooperation, therefore, is of interest to both basic and applied science. Here, we have identified one such mechanism, namely, mutation rate and its evolution. Others have explored how asymmetry in mutation rates can erode cooperation in iterative games (Garcia and Traulsen, Reference Garcia and Traulsen2012) and have found that unconstrained evolution of the magnitudes of costs and benefits of cooperation in addition to strategies can lead to the collapse of cooperation (Stewart and Plotkin, Reference Stewart and Plotkin2014, Reference Stewart and Plotkin2015).
Our threshold result raises the intriguing hypothesis that primitive life forms, that likely resided on surfaces giving them a population structure ideal for the emergence of cooperation, nevertheless had to achieve critical replication fidelity before social behaviour and multicellularity, as evolutionary innovations, could have appeared. A simple organism with a high mutation rate could not have maintained social functions, despite any population structure it may have, whereas a more complex organism with a lower genomic mutation rate, on the other hand, would have been capable of acquiring new social genes. In related simulations, we have found that newly acquired social functions cannot invade a structured population when the mutation rate is high, but do eventually invade when mutation rate is low. These findings would further suggest that, were extraterrestrial life to be found, the likelihood it would be multicellular and social should be affected by the replication fidelity it was able to achieve. High replication fidelity could be difficult to achieve in severe environments, such as might be found on other planets where radiation and other mutagenic factors might abound, and our findings would thus predict limited complexity and social evolution of life forms that might exist there.
Our findings might, in a very parsimonious way, shed some light on early evolutionary processes leading up to the transition from normal to cancerous tissue. Normal somatic cells are genetically programmed to make enormous evolutionary sacrifices at the level of the individual cell, for the common good of the somatic population (Merlo et al., Reference Merlo, Pepper, Reid and Maley2006); knockouts of any aspect of this programming can result in one or more of the six hallmarks of cancer cells (Hanahan and Weinberg, Reference Hanahan and Weinberg2000), most of which are characteristic of cheaters. Other evidence shows a relation between some cancers and elevated somatic mutation rates (Modrich, Reference Modrich1994). Our results would suggest: (1) that somatic tissue with simple population structure can tolerate a surprisingly high rate of appearance of potentially cancerous cheater mutants thereby providing the first line of defense prior to effective immune surveillance and (2) that it may be the interplay between somatic cheating and mutation rate evolution that eventually leads to the transition from normal somatic tissue to cancerous tissue.
Methods
Mean field model
Mean-field dynamics of cooperating wildtype and cheater frequencies are given by the replicator equations dx/dt = x(r x – rxX – ryY) + μ′y – μx and dy/dt = y(r y – rxX – ryY) + μx – μ′y, respectively, where r x = εx and r y = β + εx for altruistic cooperation and r x = ε + εx and r y = β + εx for mutualistic cooperation. In this analysis, we consider both the limit μ′ → 0 as well as the case μ = μ′. When cooperation is altruistic under these unstructured conditions, cheaters always displace the wildtype for all ε > 0 and β > 0 x̂ = 0 and ŷ = 1 for the case μ′ → 0;  $\hat x \approx ({\rm \mu} /\rm \beta )$ and
  $\hat y \approx 1-({\rm \mu} /\rm \varepsilon )$ for the case μ = μ′. When cooperation is mutualistic, cheaters displace the wildtype if β > ε: x̂ = 0 and ŷ = 1 for μ′ → ;
  $\hat x \approx ({\rm \mu} /(\rm \beta - \rm \varepsilon ))$ and
  $\hat y \approx 1-({\rm \mu} /(\rm \beta - \rm \varepsilon ))$ for μ = μ′. The wildtype displaces cheaters if ε>β: x̂ = 1 and ŷ = 0 for μ′ → 0 and
  $\hat x \approx 1 - ( {\rm \mu} /(\varepsilon - \beta ))$,
  $\hat y \approx ({\rm \mu} /(\rm \varepsilon - \beta ))$ for μ = μ′.
Structured-population model
Simulations proceed in discrete time with synchronous updating. The fitness of an individual is increased by the presence of each cooperating neighbour on the network by a factor of 1 + ε. If the individual in question is a cheater, its fitness is further increased by a factor of 1 + β. An individual's fitness is therefore calculated as (1 + β)a (1 + ε)s, where a = 1 if the individual is a cheater (‘asocial’) and a = 0 if the individual is a cooperator and s denotes the number of cooperating (‘social’) immediate neighbours it has. The highest possible fitness is thus awarded to a cheater whose immediate neighbours are all cooperators. Let w f denote the fitness of a ‘focal’ individual and let w i denote the fitness of one of the immediate neighbours of the focal individual. The probability that this neighbour's offspring will displace the focal individual is defined as: (1) the probability that the focal individual will leave no offspring thus leaving its node vacant, e−wf, times (2) the probability that the neighbour in question will outcompete the other neighbours for that vacancy,  $w_i^\alpha /\!\!\! \sum\limits_{j \in \Omega f} {w_j^\alpha } $, where Ωf denotes the neighbourhood of the focal individual and α denotes the sampling exponent: we use α = 2 in figures which is appropriate for bacterial or somatic populations – it reflects the probability that both daughter cells survive sampling; sampling becomes more deterministic as α increases. The analytical theory (supplementary material) mimics the simulations and employs the ‘pair-approximation’ technique. The analytical theory is applicable to a wide range of networks and random, scale-free and regular networks were all implemented in simulations.
Supplementary material
The supplementary material for this article can be found at https://doi.org/10.1017/S1473550418000149
Acknowledgements
We especially thank G. Velicer for guidance and careful reading. We thank C. Maley, A. Colato, P. Sniegowski, G. Fernandez, R. Lenski, I. Gordo, L. Perfeito, M. VanBaalen, V. Souza and L. Eguiarte for discussions and helpful comments. This work was mainly supported by grants from NIH (R01 GM079483 and ARRA Supplement to P.J.G) and National Aeronautics and Space Administration (NNA15BB04A to P.J.G.); support was also received from the European Commission (FP7 231807 to P.J.G.) and Fundação de Amparo à Pesquisa do Estado de São Paulo (FAPESP 16/23738-3 to C.P.F.). Part of this work was done during a CNRS-funded visit (P.J.G.) to the Laboratoire Jean Kuntzmann, University of Grenoble Alpes, France.
Author contributions
PG conceived and directed this study, performed mathematical analyses and wrote the paper; CF and PG designed and ran simulation studies; CF aided in the writing/editing of the paper and SI. Both authors gave final approval for publication.
We have no competing interests.