


Introduction
In less than a decade, our understanding of exoplanets has improved dramatically thanks to the Kepler mission, which was launched in 2009 (Borucki et al. Reference Borucki, Koch, Basri, Batalha, Brown, Caldwell, Caldwell, Christensen-Dalsgaard, Cochran, DeVore, Dunham, Dupree, Gautier, Geary, Gilliland, Gould, Howell, Jenkins, Kondo, Latham, Marcy, Meibom, Kjeldsen, Lissauer, Monet, Morrison, Sasselov, Tarter, Boss, Brownlee, Owen, Buzasi, Charbonneau, Doyle, Fortney, Ford, Holman, Seager, Steffen, Welsh, Rowe, Anderson, Buchhave, Ciardi, Walkowicz, Sherry, Horch, Isaacson, Everett, Fischer, Torres, Johnson, Endl, MacQueen, Bryson, Dotson, Haas, Kolodziejczak, Van Cleve, Chandrasekaran, Twicken, Quintana, Clarke, Allen, Li, Wu, Tenenbaum, Verner, Bruhweiler, Barnes and Prsa2010; Batalha Reference Batalha2014; Borucki Reference Borucki2016). The fields of exoplanetary science and astrobiology also received major boosts over the last couple of years as a result of two remarkable discoveries. The first was the discovery of the potentially habitable planet Proxima b around Proxima Centauri, the star nearest to our Solar system (Anglada-Escudé et al. Reference Anglada-Escudé, Amado, Barnes, Berdiñas, Butler, Coleman, de La Cueva, Dreizler, Endl, Giesers, Jeffers, Jenkins, Jones, Kiraga, Kürster, López-González, Marvin, Morales, Morin, Nelson, Ortiz, Ofir, Paardekooper, Reiners, Rodríguez, Rodríguez-López, Sarmiento, Strachan, Tsapras, Tuomi and Zechmeister2016). The second was the discovery of at least seven Earth-sized planets orbiting the star TRAPPIST-1 at a distance of about 12 pc (Gillon et al. Reference Gillon, Jehin, Lederer, Delrez, de Wit, Burdanov, Van Grootel, Burgasser, Triaud, Opitom, Demory, Sahu, Bardalez Gagliuffi, Magain and Queloz2016, Reference Gillon, Triaud, Demory, Jehin, Agol, Deck, Lederer, de Wit, Burdanov, Ingalls, Bolmont, Leconte, Raymond, Selsis, Turbet, Barkaoui, Burgasser, Burleigh, Carey, Chaushev, Copperwheat, Delrez, Fernandes, Holdsworth, Kotze, Van Grootel, Almleaky, Benkhaldoun, Magain and Queloz2017), some of which may be capable of hosting liquid water on their surfaces. Looking ahead, there are a wide range of space- and ground-based telescopes that will become operational within the next 10–15 years with the express purpose of hunting for myriad exoplanetary biosignatures (Fujii et al. Reference Fujii, Angerhausen, Deitrick, Domagal-Goldman, Grenfell, Hori, Kane, Pallé, Rauer, Siegler, Stapelfeldt and Stevenson2018; Schwieterman et al. Reference Schwieterman, Kiang, Parenteau, Harman, DasSarma, Fisher, Arney, Hartnett, Reinhard, Olson, Meadows, Cockell, Walker, Grenfell, Hegde, Rugheimer, Hu and Lyons2018).
The Search for Extraterrestrial Intelligence (SETI) has also received an impetus in this period on both the theoretical and observational fronts (Cabrol Reference Cabrol2016). Theoretically, many innovative technosignatures have been proposed for identifying artefacts of extraterrestrial species, both extant and extinct (Bradbury et al. Reference Bradbury, Cirkovic and Dvorsky2011; Wright et al. Reference Wright, Mullan, Sigurdsson and Povich2014, Reference Wright, Cartier, Zhao, Jontof-Hutter and Ford2016). From the observational standpoint, the recently established Breakthrough Listen project (Isaacson et al. Reference Isaacson, Siemion, Marcy, Lebofsky, Price, MacMahon, Croft, DeBoer, Hickish, Werthimer, Sheikh, Hellbourg and Enriquez2017; Worden et al. Reference Worden, Drew, Siemion, Werthimer, DeBoer, Croft, MacMahon, Lebofsky, Isaacson, Hickish, Price, Gajjar and Wright2017) has injected new funding and rejuvenated SETI,Footnote 1 after the unfortunate demise of federal funding in 1993.
Thus, from the perspective of searching for biosignatures and technosignatures, it is therefore necessary to understand what are the constraints imposed on planetary habitability by the host star. This will help in facilitating the optimal selection of suitable target stars and planets, where the prospects for life may be maximized (Horner and Jones Reference Horner and Jones2010; Kite et al. Reference Kite, Gaidos and Onstott2018; Lingam and Loeb Reference Lingam and Loeb2018d, Reference Lingam and Loeb2019c). In this paper, we will therefore use a model originally developed by Carter (Reference Carter1983), where evolution is treated as a succession of critical steps, to assess the likelihood of primitive (microbial) and intelligent (technological) life, and the implications for detecting biosignatures and technosignatures. A brief description of the methodology is provided in the section ‘Methodology’, followed by an extended discussion of the critical step model in the context of Earth's evolutionary history in the section ‘Critical Steps and Major Transitions on Earth’. Next, we assess the likelihood of these critical steps being successfully attained on other exoplanets in the section ‘Critical steps on exoplanets’. We conclude with a summary of our major points in the section ‘Conclusion’.
Methodology
We begin with a brief summary of the mathematical preliminaries. A detailed derivation of these results can be found in Barrow and Tipler (Reference Barrow and Tipler1986); Carter (Reference Carter2008); Watson (Reference Watson2008). In the critical-step model, the basic assumption is that there are n critical (i.e. ‘hard’) steps in all. Each step is stochastic in nature, and has an associated probability of occurrence (denoted by λi with i = 1, …, n), and the condition λi t H ≪ 1 must be satisfied  $\forall \, i$. Here, t H denotes the total period of habitability, and its value for the Earth and other exoplanets will be addressed later.
The central quantity of interest is the probability density function (PDF) for the case where the r-th step takes place at time t, and the remaining n − r steps take place after t. Denoting this quantity by P r,n(t), the PDF can be expressed as
 $$ P_{r,n}(t) = {{\displaystyle{n !} \over {(n-r)! (r-1)!}} {\displaystyle{t^{r-1} (t_H - t)^{n-r}} \over {t_H^n}}}. $$
Hence, the mean time taken for the r-th step, represented by  $\bar {t}_{r,n}$, is
 $$ \bar{t}_{r,n} = \int\nolimits_0^{t_H} t P_{r,n}(t)\,{\rm d}t = \left(\displaystyle{r} \over {n+1}\right)t_H, $$
and hence it follows that the average spacing (Δt n) between two consecutive steps is approximately equal,Footnote 2 with
 $$ \Delta t_n = {\displaystyle{t_H} \over {n+1}}. $$
The cumulative probability  ${\cal P}_{r,n}(t)$ that the r-th step occurs at a time ≤ t is given by
 $$ {\cal P}_{r,n}(t) = \displaystyle{{n !} \over {(n-r)! (r-1)!}} B (t/t_H\,;\,r\,,\,n-r+1), $$
where B is the incomplete beta function. For the limiting case r = n, (4) reduces to  ${\cal P}_{n,n}(t) = (t / t_H)^n$.
Critical steps and major transitions on Earth
We briefly discuss the use of critical steps model as a heuristic for understanding the major breakthroughs in the evolutionary history of the Earth (Lunine Reference Lunine2013; Knoll Reference Knoll2015a).
Before proceeding further, we wish to emphasize that sequences of evolutionary transitions encountered henceforth that are not in strong agreement with the theoretical model presented in the section ‘Methodology’ may nevertheless be ‘correct’, since the real issue could stem from the mathematical framework employed herein (based on critical steps). In other words, the existence of alternative paradigms that do not envision evolution as a series of random critical steps remains a distinct possibility. Furthermore, it should be recognized that the classification of evolutionary steps into ‘easy’ or ‘hard’ (i.e. critical) categories is both abstract and binary in nature.
For example, in the ‘long fuse’ model (Bogonovich Reference Bogonovich2011), a series of likely steps (each with a non-negligible timescale) unfold, culminating in slow, but near-inevitable, evolution – as per this framework, the emergence of any particular evolutionary innovation essentially becomes a matter of time. Hence, in this particular scenario, low-mass stars would be ideally suited for the evolution of intelligent life because of their longer main-sequence lifetimes. A second scenario is the ‘many paths’ model in which the probability of a given major evolutionary transition is enhanced due to the fact that there may exist a large number of trajectories that can culminate in the desired final outcome (Bains and Schulze-Makuch Reference Bains and Schulze-Makuch2016).
How many critical steps were present?
Although this question has been explored recently by means of the critical steps approach (Carter Reference Carter2008; Watson Reference Watson2008; McCabe and Lucas Reference McCabe and Lucas2010), there are some major points of divergence in our analysis, as discussed below.
One notable difference is that we assume the Earth was habitable approximately 4.5 Ga (Gyr ago), as opposed to previous treatments which specified the earliest point of habitability as 4 Ga. The primary reason for the choice of 4 Ga was motivated by the fact that the Late Heavy Bombardment (LHB) – a phase during which the Earth was subjected to cataclysmic bombardment by a high number of impactors (Gomes et al. Reference Gomes, Levison, Tsiganis and Morbidelli2005) – was detrimental to habitability. However, there are several lines of evidence that now suggest that the LHB may not have been a significant impediment to habitability:
• There is some evidence indicating that the cratering record may also be explained via a sustained declining bombardment, instead of the intense LHB (Bottke and Norman Reference Bottke and Norman2017). If this hypothesis is correct, the prospects for habitability are improved, and the Earth may have been geologically habitable as early as ≈4.5 Ga (Valley et al. Reference Valley, Peck, King and Wilde2002; Zahnle et al. Reference Zahnle, Arndt, Cockell, Halliday, Nisbet, Selsis and Sleep2007; Harrison Reference Harrison2009; Arndt and Nisbet Reference Arndt and Nisbet2012). For instance, if the bombardment was relatively moderate, it could even have served as a valuable energy source for prebiotic chemistry (Chyba and Sagan Reference Chyba and Sagan1992; Ruiz-Mirazo et al. Reference Ruiz-Mirazo, Briones and de la Escosura2014), leading to the synthesis of biomolecules such as amino acids, peptides and nucleobases (Martins et al. Reference Martins, Price, Goldman, Sephton and Burchell2013; Furukawa et al. Reference Furukawa, Nakazawa, Sekine, Kobayashi and Kakegawa2015).
• Even if the LHB were present, numerical models which computed the extent of crustal melting indicate that hyperthermophiles may have survived in near-surface and subsurface environments (Abramov and Mojzsis Reference Abramov and Mojzsis2009; Grimm and Marchi Reference Grimm and Marchi2018); see also Sloan et al. (Reference Sloan, Alves Batista and Loeb2017).
• Yet another possibility is that life-bearing ejecta spawned during the LHB can return to the Earth, and thereby reseed it over short (~103 yr) timescales (Wells et al. Reference Wells, Armstrong and Gonzalez2003; Gladman et al. Reference Gladman, Dones, Levison and Burns2005), effectively ensuring that habitability was almost continuously prevalent during the Hadean-Archean eons.
Thus, we start our habitability ‘clock’ at 4.5 Ga. Several studies have attempted to assess the end of Earth's habitability in the future due to the increasing solar luminosity and the onset of the greenhouse effect. While early models yielded a value of 0.5 Gyr in the future (Lovelock and Whitfield Reference Lovelock and Whitfield1982), more recent analyses have pushed forward this boundary to ≈ 1–2 Gyr in the future (Caldeira and Kasting Reference Caldeira and Kasting1992; Franck et al. Reference Franck, Block, von Bloh, Bounama, Schellnhuber and Svirezhev2000; Lenton and von Bloh Reference Lenton and von Bloh2001; Goldblatt and Watson Reference Goldblatt and Watson2012). While the 2 Gyr limit is conceivably valid for extremophiles, the limits for more complex organisms (including humans) could be closer to 1 Gyr (Franck et al. Reference Franck, Bounama and von Bloh2006; Wolf and Toon Reference Wolf and Toon2015). In addition, there may be other astrophysical risks posed to habitability over multi-Gyr timescales (Bailer-Jones Reference Bailer-Jones2009; Melott and Thomas Reference Melott and Thomas2011; Sloan et al. Reference Sloan, Alves Batista and Loeb2017). Hence, we will assume that the Earth becomes uninhabitable ≈ 1 Gyr in the future, but we will address the 2 Gyr case later in the section ‘The ramifications of an extended habitability interval’.
As per the preceding discussion, t H ≈ 4.5 + 1 ≈ 5.5 Gyr. Let us suppose that the evolution of technological intelligence (i.e. Homo sapiens) represents the n-th step, and use the fact that the mean timescale for our emergence was  $\bar {t}_{n,n} \approx 4.5\,{\rm Gyr}$. From (2) and the above values, it follows that n ≈ 4.5. Thus, it seems plausible that a 4- or 5-step model may represent the best fit. This result is in good agreement with earlier studies that arrived at the conclusion n = 5 (Carter Reference Carter2008; Watson Reference Watson2008; McCabe and Lucas Reference McCabe and Lucas2010), and we will adopt this value henceforth. Classical frameworks for understanding the course of evolution on Earth also seemingly indicate that the total number of critical steps was quite small (Schopf Reference Schopf1994; Szathmáry and Smith Reference Szathmáry and Smith1995; de Duve Reference de Duve2005; Lane Reference Lane2009), namely
  $n \lesssim 10$, and could have been 5 to 6 in number (Knoll and Bambach Reference Knoll and Bambach2000; Judson Reference Judson2017).
What were the five critical steps?
In order to determine the five critical steps, there are two routes that are open to us. The first approach assumes that these steps correspond to the major evolutionary transitions identified in the seminal work of Smith and Szathmáry (Reference Smith and Szathmáry1995, Reference Smith and Szathmáry1999), wherein each step involves noteworthy changes in the storage and transmission of information. Such paradigms have been extensively invoked and utilized by several authors (Jablonka and Lamb Reference Jablonka and Lamb2006; Koonin Reference Koonin2007; Calcott and Sterelny Reference Calcott and Sterelny2011; West et al. Reference West, Fisher, Gardner and Toby Kiers2015; Bains and Schulze-Makuch Reference Bains and Schulze-Makuch2016; O'Malley and Powell Reference O'Malley and Powell2016). This strategy for identifying the critical steps was employed by Watson (Reference Watson2008), who observed that the temporal constraints on the first three transitions (origin of replicating molecules, chromosomes and the genetic code) indicate that not all of them are likely to be critical steps; instead, if the origin of prokaryotic cells is considered as a single critical step, the n = 5 model can be formulated accordingly.
(1A) Origin of (Prokaryotic) Life: Of all the potential critical steps, dating the origin of life (abiogenesis) is the most difficult owing to the near-absence of sedimentary rocks and the action of processes like diagenesis and metamorphism (Knoll et al. Reference Knoll, Bergmann and Strauss2016). We will adopt a conservative approach, and adopt the value of 3.7 Ga for the earliest robust evidence of life. There are two independent lines of evidence that support this date. The first is the recent discovery of stromatolite-like structures in the Isua Supracrustal Belt (ISB) by Nutman et al. (Reference Nutman, Bennett, Friend, van Kranendonk and Chivas2016). The second stems from the low δ13C values in graphite globules from the ISB (Rosing Reference Rosing1999; Ohtomo et al. Reference Ohtomo, Kakegawa, Ishida, Nagase and Rosing2014), which is conventionally indicative of biological activity. The oldest microfossils, which arguably display evidence of cell structure (e.g. lumen and walls), were discovered in the Pilbara Craton and date from 3.4 to 3.5 Ga (Wacey et al. Reference Wacey, Kilburn, Saunders, Cliff and Brasier2011a; Brasier et al. Reference Brasier, Antcliffe, Saunders and Wacey2015). Here, it should be noted that even older claims for life do exist – the potentially biogenic carbon in a 4.1 Ga Jack Hills zircon (Bell et al. Reference Bell, Boehnke, Harrison and Mao2015) and putative microfossils >3.8 Ga in the Nuvvuagittuq belt (Dodd et al. Reference Dodd, Papineau, Grenne, Slack, Rittner, Pirajno, O'Neil and Little2017) are two such examples – but they are not unambiguous. As per our discussion, the timescale for abiogenesis on Earth (t 0) after the onset of habitability is t 0 ≈ 0.8 Gyr. From (4), the cumulative probability is found to be  ${\cal P}_{1A} = 0.54$.
(2A) Origin of Eukaryotes: The origin of the crown eukaryotes is believed to have occurred through endosymbiosis (Sagan Reference Sagan1967; Embley and Martin Reference Embley and Martin2006; Archibald Reference Archibald2015; López-García et al. Reference López-García, Eme and Moreira2017) between an archaeon (Eme et al. Reference Eme, Spang, Lombard, Stairs and Ettema2017) – probably a member of the Lokiarchaeota (Spang et al. Reference Spang, Saw, Jørgensen, Zaremba-Niedzwiedzka, Martijn, Lind, van Eijk, Schleper, Guy and Ettema2015), recently classified as belonging to the Asgard superphylum (Zaremba-Niedzwiedzka et al. Reference Zaremba-Niedzwiedzka, Caceres, Saw, Bäckström, Juzokaite, Vancaester, Seitz, Anantharaman, Starnawski, Kjeldsen, Stott, Nunoura, Banfield, Schramm, Baker, Spang and Ettema2017) – and a proto-mitochondrion (Gray et al. Reference Gray, Burger and Lang1999) that was closely related to α-Proteobacteria (Poole and Gribaldo Reference Poole and Gribaldo2014; Pittis and Gabaldón Reference Pittis and Gabaldón2016). This event was apparently a very important one from the standpoint of bioenergetics and the eventual increase in biological complexity (Lane and Martin Reference Lane and Martin2010; Martin et al. Reference Martin, Garg and Zimorski2015); see, however, Booth and Doolittle (Reference Booth and Doolittle2015); Lynch and Marinov (Reference Lynch and Marinov2015) for dissenting viewpoints. The oldest fossils that appear to be unambiguously eukaryotic in origin are the vesicles from the Changzhougou Formation and date from approximately 1.65 Ga (Lamb et al. Reference Lamb, Awramik, Chapman and Zhu2009; Li et al. Reference Li, Lu, Su, Xiang, Zhou and Zhang2013). There are several other ostensibly eukaryotic microfossils that have been dated to 1.4–1.6 Ga, and possibly as old as 1.8 Ga (Han and Runnegar Reference Han and Runnegar1992; Knoll Reference Knoll2014; Dacks et al. Reference Dacks, Field, Buick, Eme, Gribaldo, Roger, Brochier-Armanet and Devos2016; Bengtson et al. Reference Bengtson, Sallstedt, Belivanova and Whitehouse2017; Javaux and Knoll Reference Javaux and Knoll2017). Phylogenetic molecular clock models have yielded ages for the Last Eukaryotic Common Ancestor (LECA) ranging between 1 and 2 Ga, although recent studies are closer to the latter value (Eme et al. Reference Eme, Sharpe, Brown and Roger2014; McInerney et al. Reference McInerney, O'Connell and Pisani2014; López-García and Moreira Reference López-García and Moreira2015; Sánchez-Baracaldo et al. Reference Sánchez-Baracaldo, Raven, Pisani and Knoll2017). Although earlier claims for eukaryotic microfossils exist, for e.g. in the 2.1 Ga Francevillian B Formation (Albani et al. Reference Albani, Bengtson, Canfield, Bekker, Macchiarelli, Mazurier, Hammarlund, Boulvais, Dupuy, Fontaine, Fürsich, Gauthier-Lafaye, Janvier, Javaux, Ossa, Pierson-Wickmann, Riboulleau, Sardini, Vachard, Whitehouse and Meunier2010), the 2.7 Ga shales from the Pilbara Craton (Brocks et al. Reference Brocks, Logan, Buick and Summons1999), the Transvaal Supergroup sediments from 2.5–2.7 Ga (Waldbauer et al. Reference Waldbauer, Sherman, Sumner and Summons2009), and the 2.7–2.8 Ga lacustrine deposits of South Africa (Kaźmierczak et al. Reference Kaźmierczak, Kremer, Altermann and Franchi2016),Footnote 3 we shall adopt the circumspect timing of 1.8 Ga for the origin of eukaryotes. The corresponding timescale of 2.7 Gyr leads us to the cumulative probability  ${\cal P}_{2A} = 0.80$.
(3A) Origin of Plastids: In the original list of major evolutionary transitions (Smith and Szathmáry Reference Smith and Szathmáry1995), sexual reproduction was present in place of plastids. An important reason for this alteration was because there exists sufficiently compelling evidence that LECA was a complex organism that was capable of sexual reproduction (Koonin Reference Koonin2010; Butterfield Reference Butterfield2015); in other words, the origin of sexual reproduction was possibly coincident with eukaryogenesis (Speijer et al. Reference Speijer, Lukeš and Eliáš2015; Szathmáry Reference Szathmáry2015), although there is no a priori reason to believe that this apparent coincidence will always be valid on other inhabited exoplanets.
The importance of plastids stems from the fact that they enable eukaryotic photosynthesis. Eukaryotes acquired this ability by means of endosymbiosis with a cyanobacterium (Rodríguez-Ezpeleta et al. Reference Rodríguez-Ezpeleta, Brinkmann, Burey, Roure, Burger, Löffelhardt, Bohnert, Philippe and Lang2005; Archibald Reference Archibald2009; Keeling Reference Keeling2010), thereby giving rise to the ‘primary’ plastids in algae and plants (Gould et al. Reference Gould, Waller and McFadden2008; Price et al. Reference Price, Chan, Yoon, Yang, Qiu, Weber, Schwacke, Gross, Blouin, Lane, Reyes-Prieto, Durnford, Neilson, Lang, Burger, Steiner, Löffelhardt, Meuser, Posewitz, Ball, Arias, Henrissat, Coutinho, Rensing, Symeonidi, Doddapaneni, Green, Rajah, Boore and Bhattacharya2012). This endosymbiosis is believed to have occurred around 1.5–1.75 Ga (Falkowski et al. Reference Falkowski, Katz, Knoll, Quigg, Raven, Schofield and Taylor2004; Yoon et al. Reference Yoon, Hackett, Ciniglia, Pinto and Bhattacharya2004; Reyes-Prieto et al. Reference Reyes-Prieto, Weber and Bhattacharya2007; Parfrey et al. Reference Parfrey, Lahr, Knoll and Katz2011; Ochoa de Alda et al. Reference Ochoa de Alda, Esteban, Diago and Houmard2014), and these estimates appear to be consistent with the recent discovery of multicellular rhodophytes from 1.6 Ga (Bengtson et al. Reference Bengtson, Sallstedt, Belivanova and Whitehouse2017). However, recent evidence based on molecular clock analyses favours the origin of the Archaeplastida (that possess plastids) by 1.9 Ga (Sánchez-Baracaldo et al. Reference Sánchez-Baracaldo, Raven, Pisani and Knoll2017). We choose to err on the side of caution and use 1.5 Ga as the origin of the primary plastids. Upon calculating the cumulative probability using (4), we find  ${\cal P}_{3A} = 0.58$.
(4A) Origin of Complex Multicellularity: In this context, the rise of ‘complex multicellularity’ refers to the emergence of plants, fungi and animals (Szathmáry and Smith Reference Szathmáry and Smith1995). An important point worth noting here is that each of these clades could have originated at a different time. The earliest evidence for metazoan fossils has been argued to be at least 0.64 Ga (Love et al. Reference Love, Grosjean, Stalvies, Fike, Grotzinger, Bradley, Kelly, Bhatia, Meredith, Snape, Bowring, Condon and Summons2009; Maloof et al. Reference Maloof, Rose, Beach, Samuels, Calmet, Erwin, Poirier, Yao and Simons2010), but it cannot be regarded as wholly conclusive. Molecular clocks indicate that the last common ancestor of animals lived around 0.8 Ga or earlier (Wray et al. Reference Wray, Levinton and Shapiro1996; Douzery et al. Reference Douzery, Snell, Bapteste, Delsuc and Philippe2004; Erwin et al. Reference Erwin, Laflamme, Tweedt, Sperling, Pisani and Peterson2011; Richter and King Reference Richter and King2013; Cunningham et al. Reference Cunningham, Liu, Bengtson and Donoghue2017). The molecular clock evidence for plants suggests that their origins may extend as far back as ≈ 0.7–0.9 Ga (Heckman et al. Reference Heckman, Geiser, Eidell, Stauffer, Kardos and Hedges2001; Lewis and McCourt Reference Lewis and McCourt2004; Clarke et al. Reference Clarke, Warnock and Donoghue2011; Magallón et al. Reference Magallón, Hilu and Quandt2013), although these methods are subject to much variability; the direct fossil evidence for plants is much more recent (Knoll and Nowak Reference Knoll and Nowak2017). Lastly, the use of molecular clocks to determine the origin of fungi has led to the estimate of ≈ 0.76–1.06 Ga (Lücking et al. Reference Lücking, Huhndorf, Pfister, Plata and Lumbsch2009). Thus, taken collectively, it seems plausible that the origin of complex multicellularity was about 0.8 Ga (Rokas Reference Rokas2008), although the discovery of Bangiomorpha pubescens, whose age has been estimated to be  $\lesssim 1.2\,{\rm Ga}$ (Butterfield Reference Butterfield2000), could be construed as evidence for an earlier divergence time. This hypothesis gains further credibility in light of the distinctive increase in eukaryotic diversity documented in the fossil record at 0.8 Ga (Knoll et al. Reference Knoll, Javaux, Hewitt and Cohen2006; Knoll Reference Knoll2011). The cumulative probability for this step is
  ${\cal P}_{4A} = 0.47$.
(5A) Origin of Humans: More accurately, in the revised version, Szathmáry (Reference Szathmáry2015) refers to the origin of ‘Societies with natural language’, thus emphasizing the role of language. Since anatomically and behaviourally modern humans evolved only ~ 105 yr ago (Klein Reference Klein1995; Tattersall Reference Tattersall2009; Sterelny Reference Sterelny2011), the timescale for the evolution of H. sapiens (or even genus Homo) since the onset of habitability is 4.5 Gyr. Hence, the cumulative probability is estimated to be  ${\cal P}_{5A} = 0.37$ by making use of (4).
Next, we shall outline the second strategy for deducing the five critical transitions. In order to do so, let us recall that the spacing between each critical step is roughly equal. From (3), we find that Δt n ≈ 0.9 Ga. Thus, if we can identify five ‘important’ transitions, i.e. the breakthroughs that occurred only once or a handful of times, during Earth's geobiological and evolutionary history that have a spacing of ≈ 0.9 Ga, they might potentially constitute the critical steps leading to technological intelligence. We will present our five transitions below, and offer reasons as to why they may happen to be the critical steps.
(1B) Origin of Prokaryotic Life: Our choice of (1B) is the same as (1A). The issue of whether abiogenesis is an ‘easy’ or a ‘hard’ phenomenon remains currently unresolved (Walker Reference Walker2017), but resolving this question will have important implications for gauging the likelihood of extraterrestrial life (Lineweaver and Davis Reference Lineweaver and Davis2002; Davies Reference Davies2003; Spiegel and Turner Reference Spiegel and Turner2012; Chen and Kipping Reference Chen and Kipping2018). However, in the spirit of most conventional analyses, we will suppose that abiogenesis does constitute one of the critical steps. In this case, the cumulative probability turns out to be  ${\cal P}_{1B} = {\cal P}_{1A} = 0.54$.
(2B) Origin of Oxygenic Photosynthesis: The evolution of oxygenic photosynthesis, due to the origin of prokaryotes akin to modern cyanobacteria (Mulkidjanian et al. Reference Mulkidjanian, Koonin, Makarova, Mekhedov, Sorokin, Wolf, Dufresne, Partensky, Burd, Kaznadzey, Haselkorn and Galperin2006), had a profound impact on the Earth's biosphere (Hohmann-Marriott and Blankenship Reference Hohmann-Marriott and Blankenship2011; Fischer et al. Reference Fischer, Hemp and Valentine2016b). On metabolic grounds, there are strong reasons to posit the emergence of oxygenic photosynthesis as a major transition in its own right (Lenton and Watson Reference Lenton and Watson2011; O'Malley and Powell Reference O'Malley and Powell2016). The many advantages due to oxygenic photosynthesis have been succinctly summarized by Judson (Reference Judson2017). The addition of oxygen to the atmosphere led to the formation of the ozone layer, caused an increase in the diversity of minerals, enabled the creation of new ecological niches, and, above all, aerobic metabolism releases about an order of magnitude more energy compared to anaerobic metabolism (McCollom Reference McCollom2007; Koch and Britton Reference Koch and Britton2008). The origin of oxygenic photoautotrophs remains very poorly constrained (Allen and Martin Reference Allen and Martin2007) with chronologies ranging between 3.8 and 1.9 Ga, with the former estimate arising from indirect evidence of environmental oxidation based on U-Th-Pb isotopic ratios (Rosing and Frei Reference Rosing and Frei2004; Buick Reference Buick2008; Frei et al. Reference Frei, Crowe, Bau, Polat, Fowle and Døssing2016) and the latter representing the oldest direct evidence from microfossils (Fischer et al. Reference Fischer, Hemp and Johnson2016a). If we naively take the mean of these two values, we obtain ≈ 2.7 Ga. There are several lines of evidence, although not all of them constitute robust biomarkers (Rasmussen et al. Reference Rasmussen, Fletcher, Brocks and Kilburn2008; French et al. Reference French, Hallmann, Hope, Schoon, Zumberge, Hoshino, Peters, George, Love, Brocks, Buick and Summons2015; Newman et al. Reference Newman, Neubauer, Ricci, Wu and Pearson2016), which appear to indicate that oxygenic photosynthesis evolved approximately 2.7 Ga or later (Eigenbrode and Freeman Reference Eigenbrode and Freeman2006; Falcón et al. Reference Falcón, Magallón and Castillo2010; Farquhar et al. Reference Farquhar, Zerkle and Bekker2011; Stüeken et al. Reference Stüeken, Catling and Buick2012; Planavsky et al. Reference Planavsky, Asael, Hofmann, Reinhard, Lalonde, Knudsen, Wang, Ossa Ossa, Pecoits, Smith, Beukes, Bekker, Johnson, Konhauser, Lyons and Rouxel2014; Schirrmeister et al. Reference Schirrmeister, Gugger and Donoghue2015, Reference Schirrmeister, Sanchez-Baracaldo and Wacey2016; Shih et al. Reference Shih, Hemp, Ward, Matzke and Fischer2017), i.e. a few 100 Myr prior to the onset of the Great Oxygenation Event (GOE). With the choice of t = 1.8 Gyr (which corresponds to 2.7 Ga) for oxygenic photosynthesis, we obtain a cumulative probability of  ${\cal P}_{2B} = 0.53$ after using (4).
As noted earlier, the origin of oxygenic photosynthesis has been subject to much controversy and uncertainty. Hence, it is quite conceivable that the GOE served as a critical step in the origin of complex (eukaryotic) life, and the attainment of sufficient oxygen levels could serve as an evolutionary bottleneck on exoplanets (Knoll Reference Knoll1985; Catling et al. Reference Catling, Glein, Zahnle and McKay2005; Lingam and Loeb Reference Lingam and Loeb2019b). The GOE was a highly significant event that led to a considerable enhancement of Earth's atmospheric oxygen levels to ~ 1% of the present-day value around 2.4 to 2.1 Ga (Luo et al. Reference Luo, Ono, Beukes, Wang, Xie and Summons2016; Gumsley et al. Reference Gumsley, Chamberlain, Bleeker, Söderlund, de Kock, Larsson and Bekker2017) and potentially even higher afterwards (Blättler et al. Reference Blättler, Claire, Prave, Kirsimäe, Higgins, Medvedev, Romashkin, Rychanchik, Zerkle, Paiste, Kreitsmann, Millar, Hayles, Bao, Turchyn, Warke and Lepland2018) – see, however, Crowe et al. (Reference Crowe, Døssing, Beukes, Bau, Kruger, Frei and Canfield2013); Satkoski et al. (Reference Satkoski, Beukes, Li, Beard and Johnson2015) – thereby shaping Earth's subsequent evolutionary history (Holland Reference Holland, HD2006; Lyons et al. Reference Lyons, Reinhard and Planavsky2014; Knoll Reference Knoll2015a). If we choose the onset of the GOE as our critical step, we find that  ${\cal P}_{2B} = 0.63$.
(3B) Origin of Eukaryotes: We have already remarked previously as to why eukaryogenesis represented such an important step. The origin of eukaryotes, entailing the putative endosymbiosis of mitochondria (followed by the acquisition of plastids and other organelles), has gained near-universal acceptance as a seminal innovation from the standpoints of phagocytosis, gene expression, bioenergetics, organismal complexity and cellular evolution (Margulis Reference Margulis1981; Payne et al. Reference Payne, Boyer, Brown, Finnegan, Kowalewski, Krause, Lyons, McClain, McShea, Novack-Gottshall, Smith, Stempien and Wang2009; Yutin et al. Reference Yutin, Wolf, Wolf and Koonin2009; Wagner Reference Wagner2011; Bains and Schulze-Makuch Reference Bains and Schulze-Makuch2015; Martin et al. Reference Martin, Tielens, Mentel, Garg and Gould2017; Roger et al. Reference Roger, Muñoz-Gómez and Kamikawa2017), and is conventionally classified as a major evolutionary transition (Calcott and Sterelny Reference Calcott and Sterelny2011). The difference is that it constitutes the third step in our hypothesis, whereas it served as the second step in the original 5-step model. The cumulative probability in this case is  ${\cal P}_{3B} = 0.48$ since we have used the fact that eukaryogenesis occurred 1.8 Ga based on our preceding discussion in step (2A).
(4B) Origin of Complex Multicellularity: Our choice of (4B) is the same as (4A). This is primarily motivated by the fact that the origin of these organisms (especially plants and animals) have led to a radical transformation of Earth's biosphere. More specifically, Earth's energy balance, biomass productivity, biogeochemical cycles, ecological niches and macroevolutionary processes have been shaped by the emergence of complex multicellular organisms (Lewontin Reference Lewontin2000; Odling-Smee et al. Reference Odling-Smee, Laland and Feldman2003; Butterfield Reference Butterfield2007; Post and Palkovacs Reference Post and Palkovacs2009; Butterfield Reference Butterfield2011; Laland et al. Reference Laland, Uller, Feldman, Sterelny, Müller, Moczek, Jablonka and Odling-Smee2015; Knoll Reference Knoll2015b). Hence, in this case, we obtain the same cumulative probability, i.e.  ${\cal P}_{4B} = {\cal P}_{4A} = 0.47$.
An alternative possibility is to consider the Neoproterozoic Oxygenation Event (NOE) as the critical step. The NOE is akin to the GOE since it also entailed a rise in the atmospheric oxygen (to near-modern levels), but its exact timing and causes are unclear. In particular, it remains ambiguous as to whether the NOE served as a cause or a consequence of the origin of animals (Och and Shields-Zhou Reference Och and Shields-Zhou2012; Lyons et al. Reference Lyons, Reinhard and Planavsky2014). The timing is also very variable, with evidence from selenium isotopes apparently not ruling out the onset of the NOE as early as 0.75 Ga (Pogge von Strandmann et al. Reference Pogge von Strandmann, Stüeken, Elliott, Poulton, Dehler, Canfield and Catling2015) while iron- and iodine-based proxies seem to demonstrate significant oxygenation only as recently as ~ 0.4 Ga (Sperling et al. Reference Sperling, Wolock, Morgan, Gill, Kunzmann, Halverson, MacDonald, Knoll and Johnston2015; Lu et al. Reference Lu, Ridgwell, Thomas, Hardisty, Luo, Algeo, Saltzman, Gill, Shen, Ling, Edwards, Whalen, Zhou, Gutchess, Jin, Rickaby, Jenkyns, Lyons, Lenton, Kump and Lu2018). If we take the mean of these two quantities, the NOE would have taken place 0.55 Ga and this estimate is roughly consistent with recent analyses that have yielded values of ~ 0.5–0.6 Ga (Chen et al. Reference Chen, Ling, Vance, Shields-Zhou, Zhu, Poulton, Och, Jiang, Li, Cremonese and Archer2015; Knoll and Nowak Reference Knoll and Nowak2017). If we assume the NOE to be a critical step instead, and use the value of t = 3.95 Gyr (i.e. 0.55 Ga), we obtain  ${\cal P}_{4B} = 0.57$.
At this stage, the following issue merits a clarification. We have argued earlier that the diversification of metazoans commenced at 0.8 Ga (Cunningham et al. Reference Cunningham, Liu, Bengtson and Donoghue2017), while the NOE has been assigned a timing of 0.55 Ga. Hence, this raises the question as to how animal evolution took place in the presence of low oxygen levels. This discrepancy can be explained if the oxygen requirements for early animals (akin to modern demosponges) were sufficiently low (Sperling et al. Reference Sperling, Halverson, Knoll, Macdonald and Johnston2013; Knoll and Sperling Reference Knoll and Sperling2014; Mills and Canfield Reference Mills and Canfield2014; Mills et al. Reference Mills, Ward, Jones, Sweeten, Forth, Treusch and Canfield2014), or if the earliest metazoans were anaerobic altogether such as some species belonging to the phylum Loricifera (Danovaro et al. Reference Danovaro, Dell'Anno, Pusceddu, Gambi, Heiner and Kristensen2010, Reference Danovaro, Gambi, Dell'Anno, Corinaldesi, Pusceddu, Neves and Kristensen2016). Alternatively, factors other than oxygen – the most notable among them being, arguably, the availability of bioessential nutrients such as phosphorus (Knoll Reference Knoll2017; Reinhard et al. Reference Reinhard, Planavsky, Gill, Ozaki, Robbins, Lyons, Fischer, Wang, Cole and Konhauser2017b; Laakso and Schrag Reference Laakso and Schrag2018; Lingam and Loeb Reference Lingam and Loeb2018a) – may have been responsible for regulating the advent of animals.
(5B) Origin of Humans (Technological Intelligence): Our fifth step is essentially the same as that of the previous model (5A) on account of the following reasons. In addition to the distinctive ability to construct and utilize sophisticated tools (giving rise to complex information- and technology-driven networks), other attributes such as cumulative cultural transmission, social learning, mental time travel, large-scale social cooperation, mind reading, recursion and syntactical-grammatical language are also often cited as being unique to humans (Stewart and Cohen Reference Stewart and Cohen1997; Deacon Reference Deacon1998; Penn et al. Reference Penn, Holyoak and Povinelli2008; Richerson and Boyd Reference Richerson and Boyd2008; Tomasello Reference Tomasello2008; Boyd et al. Reference Boyd, Richerson and Henrich2011; Corballis Reference Corballis2011; Whiten and Erdal Reference Whiten and Erdal2012; Suddendorf Reference Suddendorf2013; Hauser et al. Reference Hauser, Yang, Berwick, Tattersall, Ryan, Watumull, Chomsky and Lewontin2014; Heyes and Frith Reference Heyes and Frith2014; Tomasello Reference Tomasello2014; Berwick and Chomsky Reference Berwick and Chomsky2016; Henrich Reference Henrich2016; Tomasello Reference Tomasello2016; Laland Reference Laland2017).Footnote 4 Lastly, humans have also caused major (perhaps irrevocable) large-scale shifts in the functioning of Earth's biosphere (Barnosky et al. Reference Barnosky, Matzke, Tomiya, Wogan, Swartz, Quental, Marshall, McGuire, Lindsey, Maguire, Mersey and Ferrer2011, Reference Barnosky, Hadly, Bascompte, Berlow, Brown, Fortelius, Getz, Harte, Hastings, Marquet, Martinez, Mooers, Roopnarine, Vermeij, Williams, Gillespie, Kitzes, Marshall, Matzke, Mindell, Revilla and Smith2012; Ellis et al. Reference Ellis, Kaplan, Fuller, Vavrus, Klein Goldewijk and Verburg2013) to the extent that the Earth's current geological epoch, the Anthropocene, has been primarily shaped by us (Steffen et al. Reference Steffen, Grinevald, Crutzen and McNeill2011; Frank and Sullivan Reference Frank and Sullivan2014; Lewis and Maslin Reference Lewis and Maslin2015; Steffen et al. Reference Steffen, Broadgate, Deutsch, Gaffney and Ludwig2015; Waters et al. Reference Waters, Zalasiewicz, Summerhayes, Barnosky, Poirier, Gałuszka, Cearreta, Edgeworth, Ellis, Ellis, Jeandel, Leinfelder, McNeill, Richter, Steffen, Syvitski, Vidas, Wagreich, Williams, Zhisheng, Grinevald, Odada, Oreskes and Wolfe2016).Footnote 5 The cumulative probability for this step is given by  ${\cal P}_{5B} = {\cal P}_{5A} = 0.37$.
McCabe and Lucas (Reference McCabe and Lucas2010) introduced a parameter to estimate the goodness of fit:
 $$ {\delta = \displaystyle{{1} \over {n}}} \left[\sum_{r=1}^n \left({\cal P}_{r,n} - 0.5\right)^2\right]^{1/2}, $$
and a lower value of δ corresponds to a better fit. If each of the cumulative probabilities  $({\cal P}_{r,n})$ were close to either 0 or 1, it would mean that the events are clustered towards the beginning or the end, thereby constituting a poor fit. For the 5-step model (1A-5A), we find δA = 0.068. In contrast, if we use the 5-step model (1B-5B), we find δB = 0.029; even if use the GOE and the NOE in place of the steps (2B) and (4B) respectively, we find δB = 0.04. Thus, we find that the second 5-step model (1B-5B) is approximately twice more accurate than the first model (1A-5A).
A six-step model
Carter (Reference Carter2008) concluded that a 5- or 6-step model represented the best fit for the total number of critical steps on our planet. Apart from the two 5-step models delineated earlier, we note that another candidate is the ‘energy expansions’ paradigm proposed by Judson (Reference Judson2017) that also involves 5 steps in total. Here, we will outline a 6-step model based on the ‘megatrajectories’ paradigm introduced by Knoll and Bambach (Reference Knoll and Bambach2000) and assess whether it constitutes a good fit for the critical step framework.
• From the Origin of Life to the Last Common Ancestor (LCA) of Extant Life: As with the steps (1A) and (1B), we note that there is insufficient evidence to properly date the age when abiogenesis occurred and when the LCA lived. However, as we have argued in the section ‘What were the five critical steps?’, the earliest definitive evidence for life appears to be around 3.7 Ga. In this scenario, with t 0 = 0.8 Gyr and t H = 5.5 Gyr, we use (4) to obtain
 ${\cal P}_{1,6} = 0.61$.
• The Metabolic Diversification of Bacteria and Archaea: The first evidence for methanogens is arguably from hydrothermal precipitates dated 3.5 Ga (Ueno et al. Reference Ueno, Yamada, Yoshida, Maruyama and Isozaki2006), although molecular clock analyses lead to the even earlier date of at least 3.8 Ga (Battistuzzi et al. Reference Battistuzzi, Feijao and Hedges2004). The earliest iron- and sulfate-reducing microbes also potentially appear in the fossil record at approximately the same time (Shen et al. Reference Shen, Buick and Canfield2001; Ueno et al. Reference Ueno, Ono, Rumble and Maruyama2008; Wacey et al. Reference Wacey, Saunders, Brasier and Kilburn2011b; Bontognali et al. Reference Bontognali, Sessions, Allwood, Fischer, Grotzinger, Summons and Eiler2012). There is also some evidence suggesting that methanotrophy or the Wood-Ljungdahl pathway was operational at 3.4 Ga (Flannery et al. Reference Flannery, Allwood, Summons, Williford, Abbey, Matys and Ferralis2018; Schopf et al. Reference Schopf, Kitajima, Spicuzza, Kudryavtsev and Valley2018). The record for nitrogen fixation implies that it was present by 3.2 Ga (Stüeken et al. Reference Stüeken, Buick, Guy and Koehler2015), or perhaps even earlier (Stüeken Reference Stüeken2016). Thus, taken collectively there is considerable evidence indicating that metabolic diversification had occurred by 3.4–3.5 Ga (Noffke et al. Reference Noffke, Christian, Wacey and Hazen2013; Knoll Reference Knoll2015b; Moore et al. Reference Moore, Jelen, Giovannelli, Raanan and Falkowski2017). We will therefore adopt t = 1.1 Gyr (i.e. 3.4 Ga), which results in
${\cal P}_{2,6} = 0.34$.• Evolution of the Eukaryotic Cell: This megatrajectory is essentially the same as steps (2A) and (3B). Using the timing identified therein, we find
${\cal P}_{3,6} = 0.64$.• Multicellularity: It is well-known that multicellularity has evolved repeatedly over Earth's history, and has been therefore characterized as a ‘minor’ major transition (Grosberg and Strathmann Reference Grosberg and Strathmann2007). On the other hand, organisms that fall under the bracket of ‘complex multicellularity’ belong to only six clades (Knoll Reference Knoll2011). If the latter serves as the actual critical step, we have already discussed its timing in steps (4A) and (4B) and we end up with
${\cal P}_{4,6} = 0.23$.• Invasion of the Land: Although the first land-dwelling organisms appeared in the Precambrian (Wellman and Strother Reference Wellman and Strother2015; Djokic et al. Reference Djokic, van Kranendonk, Campbell, Walter and Ward2017), the Paleozoic radiation of the land plants (embryophytes) facilitated a major ecological expansion. The earliest fossil evidence dates from the mid Ordovician (Gensel Reference Gensel2008), although it is conceivable that land plants may have originated in the Cambrian (Knoll and Nowak Reference Knoll and Nowak2017). Consequently, the fossil record is in good agreement with molecular clock evidence that dates land plants to 0.45–0.55 Ga (Sanderson et al. Reference Sanderson, Thorne, Wikström and Bremer2004; Smith et al. Reference Smith, Beaulieu and Donoghue2010; Morris et al. Reference Morris, Puttick, Clark, Edwards, Kenrick, Pressel, Wellman, Yang, Schneider and Donoghue2018).Footnote 6 Thus, by choosing t ≈ 4 Gyr, we find
${\cal P}_{5,6} = 0.48$.• Intelligence and Technology: This megatrajectory is essentially the same as steps (5A) and (5B). The corresponding cumulative probability is
${\cal P}_{6,6} = 0.30$.


By using (5), we compute the goodness of fit for this 6-step model. We find that δ = 0.069, which is virtually identical to δA (although lower than δB by a factor of about 2). Hence, this demonstrates that the megatrajectories considered here are a fairly good fit insofar our model is concerned; the resultant value of δ is lower than the 5- or 6-step model analysed in McCabe and Lucas (Reference McCabe and Lucas2010).
The ramifications of an extended habitability interval
As noted in the section ‘How many critical steps were present?’, recent theoretical studies indicate that the Earth may remain habitable (modulo anthropogenic change) to 2 Gyr in the future. With this revised estimate, the value of t H now becomes 6.5 Gyr. As before, let us assume that humans represent the n-th step. By calculating the value of n using (2), we find n ≈ 2.25. Hence, this estimate suggests that a 2-step model (or possibly a 3-step one) has the greatest likelihood of being valid; Carter (Reference Carter2008) also reached a similar conclusion.
We are confronted with the question as to what was the first critical step. The spacing between the critical steps must be approximately 2.2 Gyr as seen from (3). Since the advent of humans at 4.5 Gyr (i.e. 0 Ga) constitutes the second step, the timing of the first critical step must have been approximately 2.2 Ga. As noted in the section ‘What were the five critical steps?’, the timing of the GOE (between 2.1 and 2.4 Ga) falls within this range. The GOE had profound consequences for Earth's subsequent evolutionary history, and therefore represents a strong contender for the first critical step. Other notable candidates that lie approximately within the same time frame include the evolution of (i) oxygenic photosynthesis and (ii) eukaryotes. In the 2-step model, the origin of life (abiogenesis) is not likely to have been a critical step; in this regard, the 2-step model is akin to the original 1-step model proposed by Carter (Reference Carter1983).
However, we can ask ourselves the following question: if the origin of life was a critical step, how many steps were there in total? If we assume that abiogenesis was the first step and that the mean time for this step was equal to the abiogenesis timescale of 0.8 Gyr, from (2) we find n ≈ 7.1. In contrast, if we had assumed that t H = 5.5 Gyr and repeat the calculation, we arrive at n ≈ 5.9. This leads us to the following conclusions:
• For the case where habitability ends 1 Gyr in the future, a 6-step model would be favoured, although the 5-step model may also be plausible (Carter Reference Carter2008). The choice of n = 5 is consistent with previous analyses and the discussion in the section ‘How many critical steps were present?’.
• When the habitability boundary extends to 2 Gyr in the future, a 7-step model would represent a good fit. Let us assume that
$\bar {t}_{r,7} \approx 4.5\,{\rm Gyr}$, i.e. that humans are the r-th critical step. From (2), we obtain r ≈ 5.5, implying that the evolution of humans could have been either the fifth or sixth critical step. In other words, there are still 1 or 2 critical steps ahead in the future, which we will discuss shortly hereafter.

As noted above, there is a possibility that humans are not the n-th critical step, but merely the r-th one (with r ≤ n). In the sections ‘How many critical steps were present?’ and ‘What were the five critical steps?’, we have seen that there are compelling reasons to believe that humanity was the fifth critical step. Therefore, with r = 5 and assuming  $\bar {t}_{5,n} \approx 4.5\,{\rm Gyr}$, we can estimate the value of n using (2).
• If t H = 5.5 Gyr, and using the above values, we find n = 5.1. In other words, when Earth's habitability ends about 1 Gyr in the future, the 5-step model is relatively favoured and the evolution of humans is the last critical step.
• Using the above parameters in conjunction with t H = 6.5 Gyr leads us to n ≈ 6.2. Hence, if the Earth becomes uninhabitable 2 Gyr in the future, the 6-step model seems the most likely. In this case, since humans are the fifth critical step, there is one critical step that is yet to occur.
Based on our discussion thus far, two broad inferences can be drawn. First, assuming that the habitability window ends 1 Gyr in the future, the critical step model with n = 5 is likely to be valid and humans represent the final critical step. In contrast, if the habitability window is extended to 2 Gyr in the future, we suggest that the 6-step model could be the best fit and that the rise of humans represents the fifth critical step. In other words, there is still one step in the future which is unaccounted for. Naturally, it is not possible to identify this critical step prior to its occurrence.
One possibility is the emergence of superintelligence (Bostrom Reference Bostrom2014), especially in light of recent advancements (and concerns) in Artificial Intelligence (AI) – the paradigm shifts presumably necessary for the genesis of ‘human-like’ AI have been discussed in detail by Lake et al. (Reference Lake, Ullman, Tenenbaum and Gershman2017). However, the major issue from the standpoint of the critical step model is that the timescale between the first appearance of H. sapiens and the dawn of AI superintelligence is currently predicted to be very low, i.e. of the order of 105 to 106 yrs, compared to the characteristic separation between successive critical steps (~ 109 yrs); consequently, it remains unclear as to whether superintelligence can be regarded as a genuine critical step. This discrepancy might be resolved if the origin of superintelligence entails a much longer time than currently anticipated.
An underlying assumption pertaining to the above discussion is that we have automatically presupposed that the biological ‘complexity’ (Carroll Reference Carroll2001; McShea and Brandon Reference McShea and Brandon2010) increases monotonically with time. The pitfalls of subscribing to implicit teleological arguments, certain theories of orthogenesis, and the ‘March of Progress’ are many and varied (Simpson Reference Simpson1967; Gould Reference Gould1996; Ruse Reference Ruse1996; Gould Reference Gould2002),Footnote 7 and therefore it does not automatically follow that the sixth step alluded to earlier will lead to species of greater complexity. Hence, it does not seem implausible that the contrary could occur, especially if the environmental conditions ~ 1 Gyr in the future are less clement than today.
Critical steps on exoplanets
We will now study some of the salient features of multi-step models on exoplanets, and discuss the resulting implications. A similar topic was studied recently (using the Bayesian framework) by Waltham (Reference Waltham2017) recently, but we incorporate additional constraints on habitability imposed by stellar physics in our treatment.
The habitable zone of Earth-analogs
The habitable zone (HZ) is defined as the region around the host star where liquid water can exist on the planet's surface. The HZ is dependent on both planetary and stellar parameters, and evolves dynamically over time (Kasting et al. Reference Kasting, Whitmire and Reynolds1993; Kasting and Catling Reference Kasting and Catling2003; Kopparapu et al. Reference Kopparapu, Ramirez, Kasting, Eymet, Robinson, Mahadevan, Terrien, Domagal-Goldman, Meadows and Deshpande2013, Reference Kopparapu, Ramirez, SchottelKotte, Kasting, Domagal-Goldman and Eymet2014). The HZ is typically computed for ‘Earth-analogs’, i.e. planets whose basic physical, chemical and geological parameters are similar to that of Earth. In our subsequent discussion, we will implicitly deal with Earth-analogs in the HZ of their host stars.Footnote 8
Clearly, the upper bound on the habitability of a planet is the stellar lifetime. However, the maximum duration that the planet remains habitable is less than the stellar lifetime for a simple reason: the stellar luminosity increases over time, and the planet will eventually enter a runaway greenhouse phase and become uninhabitable (like Venus). Thus, the duration of habitability is essentially specified by the temporal extent of the continuously HZ (denoted here by CHZ). By using the knowledge about the inner and outer boundaries of the HZ in conjunction with stellar evolution models, it is feasible to estimate the total duration of time (t HZ) that an Earth-analog will remain inside the HZ as a function of the stellar mass  $M_\star $. This effort was undertaken by Rushby et al. (Reference Rushby, Claire, Osborn and Watson2013), and by making use of Fig. 11 and Table 5 in that paper, we introduce the scaling:
 $$\eqalign{t_{{\rm HZ}} & \sim 0.55\; t_\odot \; \left( {\displaystyle{{M_{\rm \star }} \over {M_\odot }}} \right)^{-2}\quad M_{\rm \star } \gt M_\odot , \cr t_{{\rm HZ}} & \sim 0.55\; t_\odot \; \left( {\displaystyle{{M_{\rm \star }} \over {M_\odot }}} \right)^{-1}\quad \; 0.5M_\odot \lt M_{\rm \star } \lt M_\odot , \cr t_{{\rm HZ}} & \sim 0.46\; t_\odot \; \left( {\displaystyle{{M_{\rm \star }} \over {M_\odot }}} \right)^{-1.25}\quad M_{\rm \star } \lt 0.5M_\odot ,} $$
where  $t_\odot \sim 10\,{\rm Gyr}$ and
  $M_\odot $ is the solar mass. Our choice of normalization constant differs from Rushby et al. (Reference Rushby, Claire, Osborn and Watson2013) since we have adopted the more conservative habitability duration of 5.5 Gyr for the Earth-Sun system. By inspecting (6), it is apparent that low-mass stars are characterized by CHZs that last for a longer duration of time, which is along expected lines since they have longer main-sequence lifetimes (Adams and Laughlin Reference Adams and Laughlin1997; Loeb et al. Reference Loeb, Batista and Sloan2016).
Now, let us consider the highly simplified model wherein we suppose that the timescale for abiogenesis is the same on all exoplanets, and that the duration of habitability is given by t HZ. Since abiogenesis is taken to be the first critical step, from (2) with r = 1 we find
 $$ n_{\star} = {\displaystyle{{t_{\rm HZ}} \over {t_\oplus}}(n_\oplus + 1)} - 1, $$
where  $t_\oplus = 5.5\,{\rm Gyr}$ is the habitability duration of the Earth and
  $n_\oplus $ is the number of critical steps on Earth, while
  $n_\star $ represents the corresponding number of steps for Earth-analog orbiting a star of mass
  $M_\star $. We will henceforth use
  $n_\oplus = 5$ as this value has been advocated by several authors. Moreover, as we have seen from the section ‘Critical Steps and Major Transitions on Earth’, there are reasons to believe that
  $n_\oplus = 5$ constitutes a fairly good fit. Thus, from (6),
  $n_\star $ can be estimated as a function of
  $M_\star $, and this plot is shown in Fig. 1. The value of
  $n_\star $ decreases when
  $M_\star $ is increased, and shortly after
  $1.7\,M_\odot $ the value of
  $n_\star $ drops below unity.
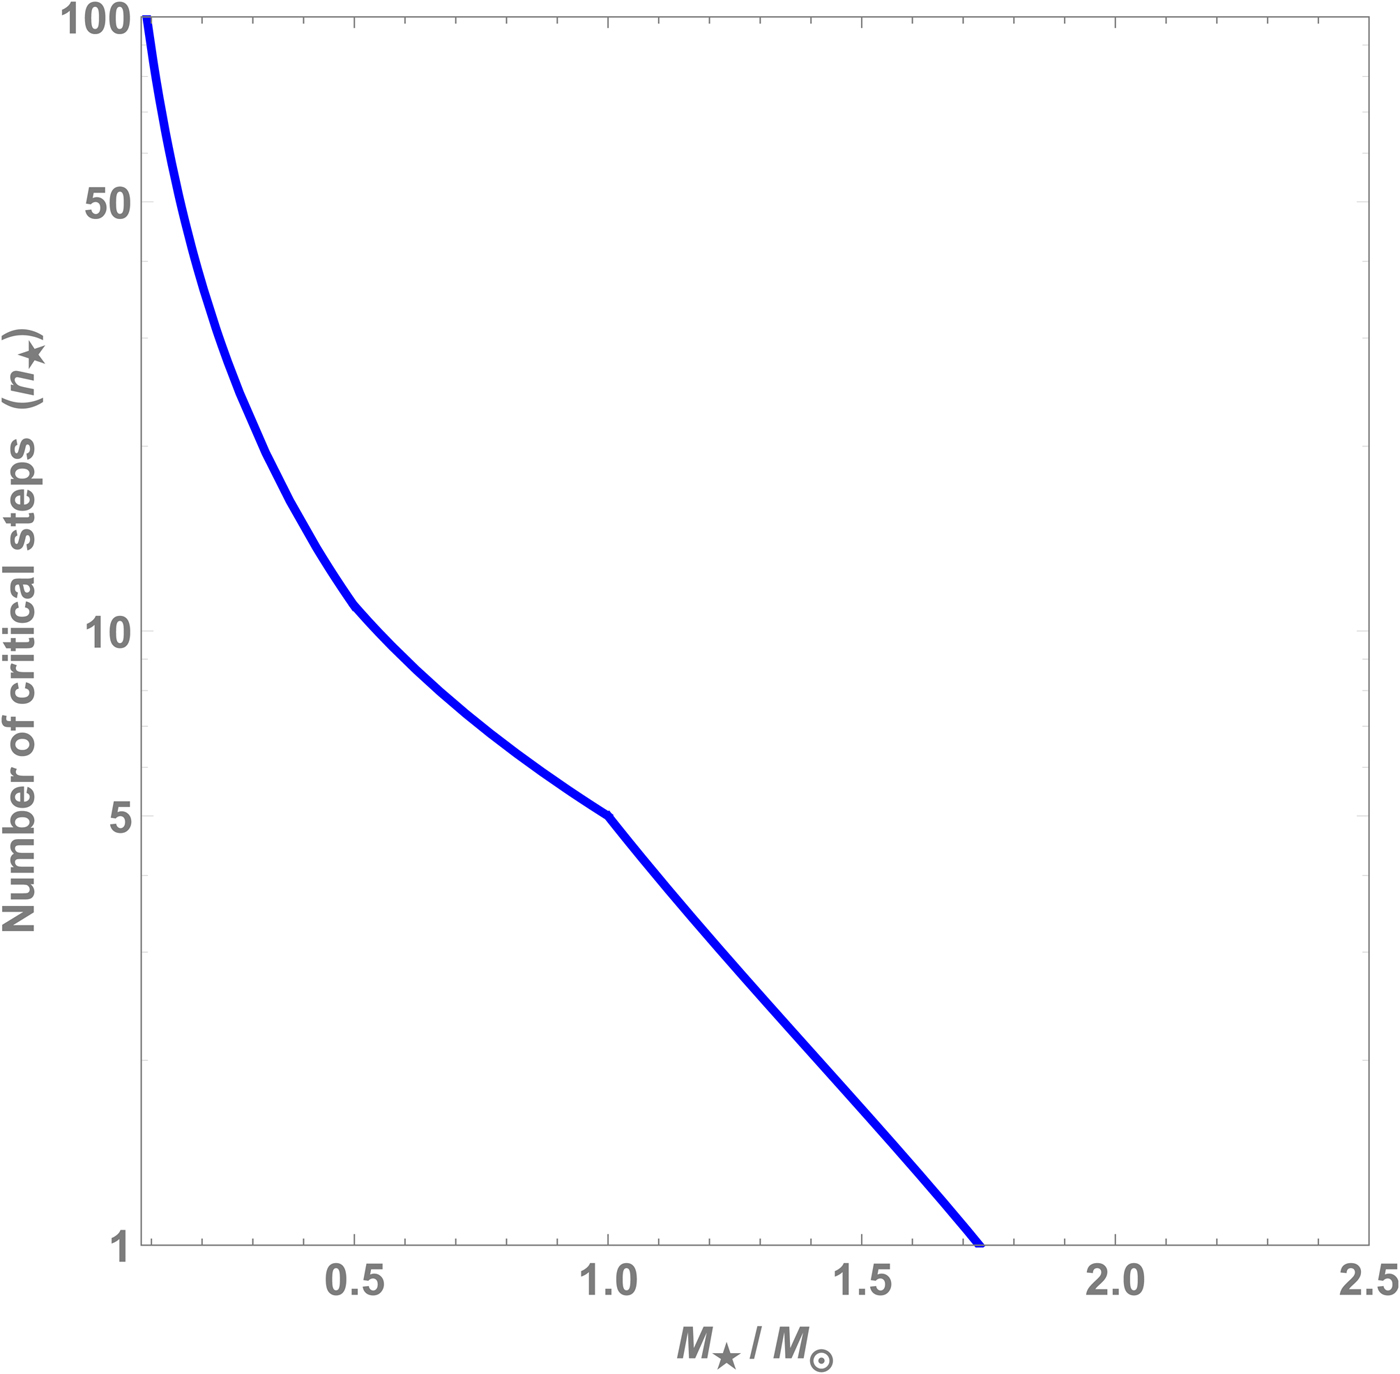
Fig. 1. Number of critical steps  $n_\star $ as a function of the stellar mass
  $M_\star $ based on (7).
Constraints on habitability imposed by stellar physics
The preceding analysis implicitly assumed that the only timescale for habitability was t HZ. In reality, there are a number of factors governed by stellar physics that influence habitability (Lingam and Loeb Reference Lingam and Loeb2018e). In particular, there has been a growing appreciation of the role of space weather in governing habitability, for e.g. the role of stellar flares (O'Malley-James and Kaltenegger Reference O'Malley-James and Kaltenegger2017; Vida et al. Reference Vida, Kővári, Pál, Oláh and Kriskovics2017; MacGregor et al. Reference MacGregor, Weinberger, Wilner, Kowalski and Cranmer2018), coronal mass ejections (Khodachenko et al. Reference Khodachenko, Ribas, Lammer, Grießmeier, Leitner, Selsis, Eiroa, Hanslmeier, Biernat, Farrugia and Rucker2007; Kay et al. Reference Kay, Opher and Kornbleuth2016; Dong et al. Reference Dong, Huang, Lingam, Tóth, Gombosi and Bhattacharjee2017a), stellar energetic particles (Segura et al. Reference Segura, Walkowicz, Meadows, Kasting and Hawley2010; Lingam and Loeb Reference Lingam and Loeb2017c; Howard et al. Reference Howard, Tilley, Corbett, Youngblood, Loyd, Ratzloff, Law, Fors, del Ser, Shkolnik, Ziegler, Goeke, Pietraallo and Haislip2018; Lingam et al. Reference Lingam, Dong, Fang, Jakosky and Loeb2018h) and stellar winds (Vidotto et al. Reference Vidotto, Jardine, Morin, Donati, Lang and Russell2013; Garraffo et al. Reference Garraffo, Drake and Cohen2016, Reference Garraffo, Drake, Cohen, Alvarado-Gómez and Moschou2017; Airapetian et al. Reference Airapetian, Glocer, Khazanov, Loyd, France, Sojka, Danchi and Liemohn2017; Dong et al. Reference Dong, Lingam, Ma and Cohen2017b, Reference Dong, Jin, Lingam, Airapetian, Ma and van der Holst2018a; Lingam and Loeb Reference Lingam and Loeb2018f) to name a few.
Since the presence of an atmosphere is necessary for maintaining liquid water on the surface of a planet, its complete depletion would lead to the termination of habitability insofar surficial life is concerned. For Earth-analogs that are closer to their low-mass host stars, they are subjected to intense stellar winds that can deplete their atmospheres over short timescales. The significance and magnitude of stellar wind erosion have been thoroughly documented in our Solar system (Brain et al. Reference Brain, Bagenal, Ma, Nilsson and Stenberg Wieser2016; Jakosky et al. Reference Jakosky, Slipski, Benna, Mahaffy, Elrod, Yelle, Stone and Alsaeed2017). The approximate timescale t SW associated with total atmospheric escape due to stellar wind erosion (Lingam and Loeb Reference Lingam and Loeb2017b) is
 $$ t_{\rm SW} \sim 100 t_\odot\, \left(\displaystyle{M_\star} \over {M_\odot}\right)^{4.76}, $$
for an Earth-analog assuming that the star's rotation rate is similar to the sun. The analytic model displays consistency with the trends and values discerned from numerical simulations (Dong et al. Reference Dong, Jin, Lingam, Airapetian, Ma and van der Holst2018a,Reference Dong, Lee, Ma, Lingam, Bougher, Luhmann, Curry, Toth, Nagy, Tenishev, Fang, Mitchell, Brain and Jakoskyb). A few points should be noted regarding the above formula. First, incorporating the effects of stellar flares and coronal mass ejections (Drake et al. Reference Drake, Cohen, Yashiro and Gopalswamy2013; Cranmer Reference Cranmer2017; Odert et al. Reference Odert, Leitzinger, Hanslmeier and Lammer2017; Patsourakos and Georgoulis Reference Patsourakos and Georgoulis2017; Lee et al. Reference Lee, Dong, Pawlowski, Thiemann, Tenishev, Mahaffy, Benna, Combi, Bougher and Eparvier2018) is expected to decrease this timescale, perhaps by more than one order of magnitude. Second, this formula was derived under the assumption of a constant atmospheric escape rate. In reality, the escape rate may decrease by two orders of magnitude as the age of the star increases (Dong et al. Reference Dong, Lee, Ma, Lingam, Bougher, Luhmann, Curry, Toth, Nagy, Tenishev, Fang, Mitchell, Brain and Jakosky2018b). As a result, the higher escape rates in the past would further decrease the value of t SW. Lastly, we observe that (8) is applicable to unmagnetized planets. In contrast, if one considers strongly magnetized planets, the atmospheric escape rate could decrease by a factor of  $\lesssim 10$ (Dong et al. Reference Dong, Lingam, Ma and Cohen2017b), but the converse is also possible (Blackman and Tarduno Reference Blackman and Tarduno2018; Sakai et al. Reference Sakai, Seki, Terada, Shinagawa, Tanaka and Ebihara2018). In general, the escape rate is anticipated to be a non-monotonic function of the magnetic field (Gunell et al. Reference Gunell, Maggiolo, Nilsson, Stenberg Wieser, Slapak, Lindkvist, Hamrin and De Keyser2018; Lingam and Loeb Reference Lingam and Loeb2018e).
Thus, as per the preceding discussion, the actual duration of habitability should be defined as t H = min{t HZ, t SW}. In other words, if t SW < t HZ, the planet loses its atmosphere before it exits the CHZ and vice-versa. From (6) and (8), we find
 $$\eqalign{t_H & \sim 0.55\; t_\odot \left( {\displaystyle{{M_{\rm \star }} \over {M_\odot }}} \right)^{-2}\quad \quad M_{\rm \star } \gt M_\odot , \cr t_H & \sim 0.55\; t_\odot \; \left( {\displaystyle{{M_{\rm \star }} \over {M_\odot }}} \right)^{-1}\quad \quad \; 0.5M_\odot \lt M_{\rm \star } \lt M_\odot , \cr t_H & \sim 0.46\; t_\odot \; \left( {\displaystyle{{M_{\rm \star }} \over {M_\odot }}} \right)^{-1.25}\quad 0.41M_\odot \lt M_{\rm \star } \lt 0.5M_\odot , \cr t_H & \sim 100t_\odot \; \left( {\displaystyle{{M_{\rm \star }} \over {M_\odot }}} \right)^{4.76}\quad \quad M_{\rm \star } \lt 0.41M_\odot .} $$
Our next stellar constraint stems from the availability of biologically active ultraviolet (UV) radiation. The importance of UV radiation partly stems from the fact that it constitutes the most dominant energy source for prebiotic synthesis on Earth (Chyba and Sagan Reference Chyba and Sagan1992; Deamer and Weber Reference Deamer and Weber2010). Although theories of abiogenesis are many and varied (Ruiz-Mirazo et al. Reference Ruiz-Mirazo, Briones and de la Escosura2014), there is a strong case that can be made for UV radiation as the driver of prebiotic chemistry (Sagan and Khare Reference Sagan and Khare1971; Oró et al. Reference Oró, Miller and Lazcano1990; Pascal Reference Pascal2012; McCollom Reference McCollom2013; Rapf and Vaida Reference Rapf and Vaida2016; Sutherland Reference Sutherland2017), especially with regard to the RNA world (Gilbert Reference Gilbert1986; Joyce Reference Joyce2002; Orgel Reference Orgel2004; Neveu et al. Reference Neveu, Kim and Benner2013; Higgs and Lehman Reference Higgs and Lehman2015; Wachowius et al. Reference Wachowius, Attwater and Holliger2017), on account of the following reasons:
• Laboratory experiments have shown that UV light provides a selective advantage to RNA-like molecules due to the presence of nitrogenous bases (Crespo-Hernández et al. Reference Crespo-Hernández, Cohen, Hare and Kohler2004; Gustavsson et al. Reference Gustavsson, Improta and Markovitsi2010; Šponer et al. Reference Šponer, Szabla, Góra, Saitta, Pietrucci, Saija, Di Mauro, Saladino, Ferus, Civiš and Šponer2016), and may therefore play an important role in facilitating their oligomerization (Mulkidjanian et al. Reference Mulkidjanian, Cherepanov and Galperin2003; Dibrova et al. Reference Dibrova, Chudetsky, Galperin, Koonin and Mulkidjanian2012).
• The observed tendency in myriad origin-of-life experiments to form complex organic mixtures incapable of Darwinian evolution is referred to as the ‘asphalt problem’. Recent experiments have shown that this issue might be bypassed in suitable geological environments (e.g. intermountain valleys), and that UV radiation can potentially facilitate the synthesis of nucleosides, nucleotides, and perhaps RNA (Benner et al. Reference Benner, Kim and Carrigan2012).
• The synthesis of important biomolecules without excessive human intervention and under conditions that are presumed to resemble Hadean-Archean environments has proven to be challenging. However, there have been several breakthroughs in recent times that are reliant on UV light (Sutherland Reference Sutherland2016; Islam and Powner Reference Islam and Powner2017). More specifically, the biologically relevant compounds produced include: (i) pyrimidine ribonucleotides and β-ribonucleosides (Powner et al. Reference Powner, Gerland and Sutherland2009; Xu et al. Reference Xu, Tsanakopoulou, Magnani, Szabla, Šponer, Šponer, Góra and Sutherland2017), (ii) building blocks of sugars, such as glycolaldehyde and glyceraldehyde (Ritson and Sutherland Reference Ritson and Sutherland2012, Reference Ritson and Sutherland2013; Todd et al. Reference Todd, Fahrenbach, Magnani, Ranjan, Björkbom, Szostak and Sasselov2018; Xu et al. Reference Xu, Ritson, Ranjan, Todd, Sasselov and Sutherland2018), (iii) precursors of nucleic acids, amino acids, lipids and carbohydrates (Barks et al. Reference Barks, Buckley, Grieves, Di Mauro, Hud and Orlando2010; Patel et al. Reference Patel, Percivalle, Ritson, Duffy and Sutherland2015; Ritson et al. Reference Ritson, Battilocchio, Ley and Sutherland2018), and (iv) iron-sulfur clusters (Bonfio et al. Reference Bonfio, Valer, Scintilla, Shah, Evans, Jin, Szostak, Sasselov, Sutherland and Mansy2017).
• RNA nucleotides have been shown to be stable when radiated by UV photons, and this has been argued to be evidence that they could have originated in the high-UV environments of Hadean-Archean Earth (Serrano-Andres and Merchan Reference Serrano-Andres and Merchan2009; Gustavsson et al. Reference Gustavsson, Improta and Markovitsi2010; Rios and Tor Reference Rios and Tor2013; Beckstead et al. Reference Beckstead, Zhang, de Vries and Kohler2016; Ranjan and Sasselov Reference Ranjan and Sasselov2016).
Another major theory for the origin of life posits that it occurred in submarine hydrothermal vents (Baross and Hoffman Reference Baross and Hoffman1985; Martin et al. Reference Martin, Baross, Kelley and Russell2008). This theory does have many advantages of its own (McCollom and Seewald Reference McCollom and Seewald2007; Russell et al. Reference Russell, Barge, Bhartia, Bocanegra, Bracher, Branscomb, Kidd, McGlynn, Meier, Nitschke, Shibuya, Vance, White and Kanik2014; Sojo et al. Reference Sojo, Herschy, Whicher, Camprubí and Lane2016), and recent evidence suggesting that the LCA was thermophilic in nature is consistent with hydrothermal vents being the sites of abiogenesis (Akanuma et al. Reference Akanuma, Nakajima, Yokobori, Kimura, Nemoto, Mase, Miyazono, Tanokura and Yamagishi2013; Weiss et al. Reference Weiss, Sousa, Mrnjavac, Neukirchen, Roettger, Nelson-Sathi and Martin2016). However, it cannot be said at this stage that the LCA was definitively a thermophile, since other studies point to a mesophilic origin (Miller and Lazcano Reference Miller and Lazcano1995; Bada and Lazcano Reference Bada and Lazcano2002; Cantine and Fournier Reference Cantine and Fournier2018). A recent study by Deamer and Damer (Reference Deamer and Damer2017) assessed seven factors ostensibly necessary for life's origination, and concluded that submarine hydrothermal vents may potentially face difficulties in fulfilling all of these criteria.
It should be noted that UV radiation is expected to have other biological ramifications as well, both positive and negative. One of the downsides associated with high doses of UV radiation is that it can inhibit photosynthesis and cause damage to vital biomolecules (e.g. DNA) on Earth (Teramura and Sullivan Reference Teramura and Sullivan1994; Cadet et al. Reference Cadet, Sage and Douki2005). Yet, there are potential benefits stemming from UV radiation due to its proficiency in stimulating mutagenesis and thereby serving as a selection agent (Sagan Reference Sagan1973). In particular, it is conceivable that UV radiation could have facilitated the emergence of evolutionary innovations such as sexual reproduction (Rothschild Reference Rothschild1999) and enhanced the rates of molecular evolution and speciation (Evans and Gaston Reference Evans and Gaston2005). It is therefore important to appreciate the possibility that there may be a number of advantages arising from UV radiation.
Hence, in our subsequent discussion, we will posit that the origin of life on Earth-analogs was driven by UV radiation. In this scenario, the rate of prebiotic chemical reactions is assumed to be constrained by the available bioactive UV flux at the surface (Buccino et al. Reference Buccino, Lemarchand and Mauas2007; Ranjan et al. Reference Ranjan, Wordsworth and Sasselov2017). The latter can be estimated solely as a function of  $M_\star $, thereby leading us to the abiogenesis timescale
  $t_\star $ (Lingam and Loeb Reference Lingam and Loeb2018b):
 $$\eqalign{t_{\rm \star } & \sim t_0\left( {\displaystyle{{M_{\rm \star }} \over {M_\odot }}} \right)^{-3}\quad \quad M_{\rm \star }{\rm \lesssim }M_\odot , \cr t_{\rm \star} & \sim t_0\; \left( {\displaystyle{{M_{\rm \star }} \over {M_\odot }}} \right)^{-1}\quad \quad M_{\rm \star }{\rm \mathbin{\lower.3ex\hbox{$\buildrel \gt \over {\vskip1.2pt\smash{\scriptstyle\sim}\vphantom{_x}}$}} }M_\odot ,} $$
where  $t_0 = 0.08 t_\odot = 0.8\,{\rm Gyr}$. Next, we consider the ratio
  $\mu \equiv t_H/t_\star $ because of its significance. If μ < 1, then the duration of habitability is lower than the timescale for abiogenesis, thus implying that such Earth-analogs are not likely to host life. We have plotted μ as a function of
  $M_\star $ in Fig. 2. A couple of conclusions can be drawn from this figure. For
  $M_\star \lesssim 0.4 M_\odot $, we find that μ < 1 indicating that planets in the HZ of these stars have a lower chance of hosting life. Second, we find that the curve flattens out when
  $M_\star \gtrsim M_\odot $ but it does attain a slight peak at
  $M_\star = M_\odot $. Although this maximum is attained exactly at
  $M_\odot $ due to the ansatzen used in this paper, the peak of the curve has a high likelihood of being in the vicinity of
  $M_\star $, thereby suggesting that sun-like stars may represent the most appropriate targets in the search for life (Lingam and Loeb Reference Lingam and Loeb2018d).
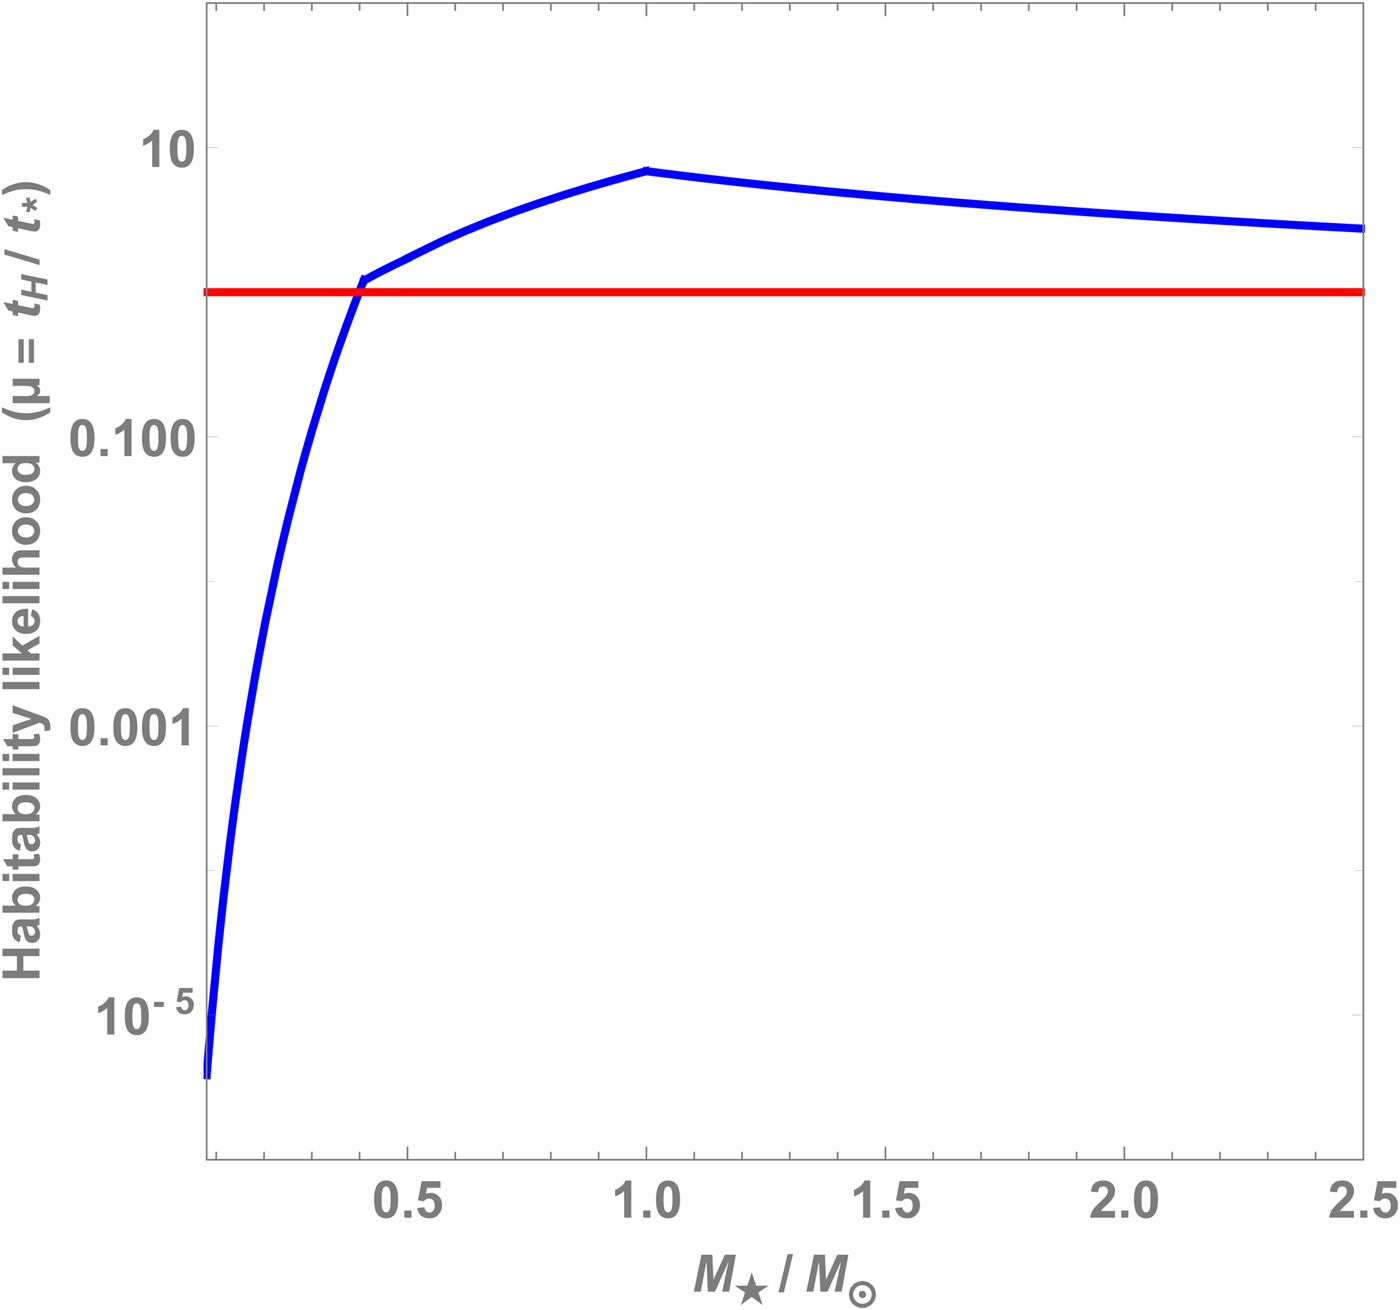
Fig. 2. The likelihood of a planet to host life μ (i.e. the ratio of its habitability duration to the abiogenesis timescale) as a function of the stellar mass  $M_\star $.
In making use of (10), we have operated under the implicit assumption that stellar flares do not alter our results significantly. In actuality, stellar flares can deliver transient and elevated doses of UV radiation that are anticipated to have both positive and negative outcomes (Dartnell Reference Dartnell2011; Lingam and Loeb Reference Lingam and Loeb2017c; O'Malley-James and Kaltenegger Reference O'Malley-James and Kaltenegger2017; Lingam and Loeb Reference Lingam and Loeb2018e). In particular, a recent analysis by Rimmer et al. (Reference Rimmer, Xu, Thompson, Gillen, Sutherland and Queloz2018) concluded that the background UV fluxes of stars with  $T_\star \lt 4400$ K, with
  $T_\star $ denoting the effective stellar temperature, may not suffice for enabling UV-mediated prebiotic pathways to function efficiently. In some instances, however, stellar flares deliver sufficient UV photons to permit these reactions to occur. When the occurrence rate of flares (
 $\dot {N}_f$) exceeds the following threshold, UV-mediated prebiotic pathways could become functional.
 $$\dot{N}_f\,{\rm \mathbin{\lower.3ex\hbox{$\buildrel \gt \over {\vskip1pt\smash{\scriptstyle\sim}\vphantom{_x}}$}} }3.36 \times 10^2{\mkern 1mu} {\rm da}{\rm y}^{-1}{\mkern 1mu} {\rm }\left( {\displaystyle{{E_f} \over {{10}^{34}{\mkern 1mu} {\rm erg}}}} \right)^{-1}\,\,\left( {\displaystyle{{R_{\rm \star }} \over {R_\odot }}} \right)^2\,\,\left( {{\displaystyle{{T_{\rm \star }} \over T_\odot}} } \right)^4, $$
where E f is the flare energy and  $R_\star $ is the stellar radius (Günther et al. Reference Günther, Zhan, Seager, Rimmer, Ranjan, Stassun, Oelkers, Daylan, Newton, Gillen, Rappaport, Ricker, Latham, Winn, Jenkins, Glidden, Fausnaugh, Levine, Dittmann, Quinn, Krishnamurthy and Ting2019). Based on the data from the TESS mission, it has been estimated that 62 stars out of a sample of 632 flaring M-dwarfs fulfil the above criterion (Günther et al. Reference Günther, Zhan, Seager, Rimmer, Ranjan, Stassun, Oelkers, Daylan, Newton, Gillen, Rappaport, Ricker, Latham, Winn, Jenkins, Glidden, Fausnaugh, Levine, Dittmann, Quinn, Krishnamurthy and Ting2019). Thus, it might be reasonable to assume that the majority of low-mass stars do not flare frequently enough to compensate for the paucity of UV photons.
We turn our attention now to the 5-step model introduced in the section ‘Critical Steps and Major Transitions on Earth’. Since we have argued that abiogenesis was the first critical step, using (2) along with t H = 5.5 Gyr for the Earth leads us to  $\bar {t}_{1,5} \approx 0.92\,{\rm Gyr}$. Thus, we see that the timescale specified for the origin of life on Earth (t 0 = 0.8 Gyr) obeys
  $t_0 \approx \bar {t}_{1,5}$. As noted earlier, this is not surprising since the mean time taken for the r-th critical step in a viable model is typically comparable to its actual timescale (Carter Reference Carter1983). If we assume that this condition is also valid on other potentially habitable planets, we have
  $\bar {t}_{1,n_\star } \approx t_\star $. Using this relation in conjunction with (2), (9) and (10), the value of
  $n_\star $ is found to be
 $$ n_\star = \left(\displaystyle{t_H} \over {t_\oplus}\right)\left(\displaystyle{t_\star} \over {t_0}\right)^{-1}\left(n_\oplus + 1\right) - 1. $$
Fig. 3 depicts the dependence of  $n_\star $ on the stellar mass. From this plot, we see that n > 0 occurs only for
  $M \gtrsim 0.4 M_\odot $ and this result is in agreement with Fig. 2, since planets orbiting such stars have a habitability duration that is shorter than the abiogenesis timescale. Second, we observe a clear peak at
  $M_\star = M_\odot $, and this behaviour is also observed in some of the subsequent figures. This result is consistent with our earlier discussion: although the peak arises due to the scaling relations employed herein, there is still a strong possibility that the maximum number of critical steps occur when
  $M_\star \approx M_\odot $. It lends further credibility to the notion that G-type stars are the optimal targets in the search for life-bearing planets. Our results are qualitatively consistent with the Bayesian analysis by Waltham (Reference Waltham2017), who concluded that: (i) the likelihood of life around M-dwarfs must be selectively suppressed, (ii) G-type stars are the most suitable targets for SETI observations, and (iii) the number of critical steps leading to intelligence is not likely to exceed five.
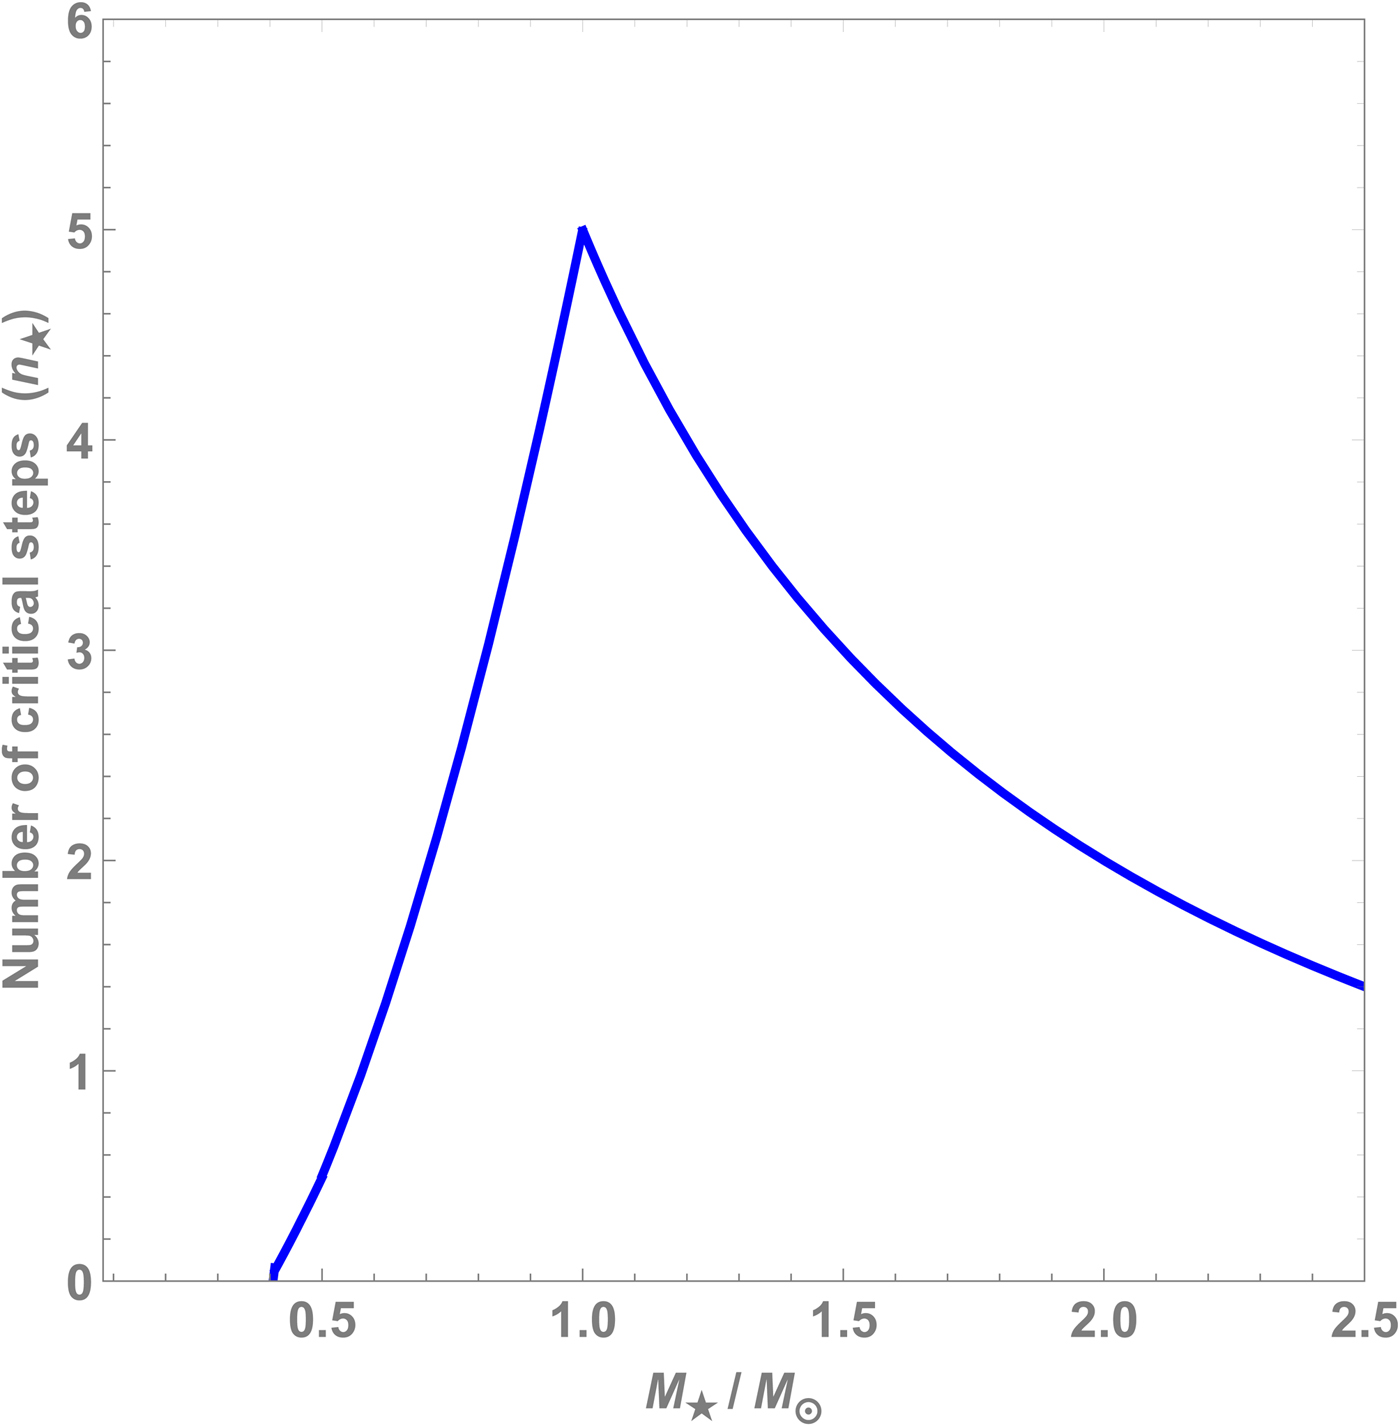
Fig. 3. Number of critical steps  $n_\star $ as a function of the stellar mass
  $M_\star $ based on (12).
An important point to recognize here is that although the value of n ≈ 5 occurs in the vicinity of  $M_\star \approx M_\odot $, this does not altogether preclude stars outside this range from hosting planets with technologically sophisticated species. This is because the total number of critical steps leading to the emergence of life and intelligence on other planets is unknown, and there are no reasons to suppose the total number of critical steps will always be the same.Footnote 9 On the other hand, once the number of critical steps drops below unity, it becomes rather unlikely that such stars (with
  $M_\star \lt 0.5\,M_\odot $) would have planets where intelligence can arise.
With these caveats in mind, we will, nevertheless, hypothesize that the critical steps discussed in the section ‘Critical Steps and Major Transitions on Earth’ (for Earth) are sufficiently general, and therefore applicable to a subset of hypothetically inhabited exoplanets. As we have seen, there are two constraints that were employed in our analysis: (I) the n steps must occur in the interval [0, t H], and (II) the first step (r = 1), namely abiogenesis, must occur at t 0. Hence, it follows that the remaining n − 1 steps must unfold in remaining time interval. We introduce the expression for the PDF of the (n − 1)-th step (in a sequence of n − 1 steps) in the time t′ − t 0:
 $$ P_{n-1,n-1}\left(t'-t_0\right) = {\cal C} (t'-t_0)^{n-2}, $$
with  ${\cal C}$ being a constant, based on the section ‘Methodology’. By integrating this PDF over the interval [t 0, t H], we obtain the probability, denoted by
  ${\cal P}_n(M_\star )$, for all n steps to occur (since we have already imposed the constraint that the first step is attained at t 0). The constant of proportionality
  ${\cal C}$ is calculated by demanding that
  ${\cal P}_n(M_\star ) = 1$ when t 0 = 0 because of criterion (I). This yields
 $$ {\cal P}_n\left(M_\star\right) = \left(1 - {\displaystyle{t_0} \over {t_H}}\right)^{n-1}, $$
and the same formula can be obtained from (4) with r → n − 1, n → n − 1 and t → t H − t 0; see also Barrow and Tipler (Reference Barrow and Tipler1986). Note that this formula is valid only when t 0 < t H, which automatically excludes stars with  $M_\star \lesssim 0.4 M_\odot $. There are two important scenarios worth considering from the standpoint of detecting the fingerprints of life:
• The probability of technological intelligence: This requires n = 5 based on the above assumptions. In this case, it will be theoretically possible to detect signs of intelligent life by searching for technosignatures because they are more distinctive.
• The probability of detectable primitive life: From the standpoint of microbial life, most of the well-known biosignatures like oxygen and ozone are not detectable until they have attained a certain level (Meadows Reference Meadows2017; Krissansen-Totton et al. Reference Krissansen-Totton, Olson and Catling2018). Hence, although Earth had life throughout most of its history, the low concentrations of oxygen and ozone until the GOE would have led to a ‘false negative’ (Reinhard et al. Reference Reinhard, Olson, Schwieterman and Lyons2017a). Based on our discussion in the section ‘Critical Steps and Major Transitions on Earth’, the evolution of oxygenic photosynthesis and the GOE correspond to n = 2 (or n = 3).
We have plotted (14) as a function of the stellar mass in Fig. 4. It is seen that the peak is at  $M_\star = M_\odot $, and that the curves rise sharply at
  $M_\star \approx 0.5 M_\odot $. The figure indicates that an Earth-analog around a G-type star would have the highest probability of achieving the critical steps necessary for detectable primitive or intelligent life.

Fig. 4. The probability of attaining the n-step as a function of the stellar mass  $M_\star $ based on (14).
We must however point out an important caveat here. For  $M_\star = M_\odot $ and n = 5, we obtain the probability
  ${\cal P}_n(M_\odot ) \approx 0.5$ upon making use of (14). In other words, this result should imply that the likelihood of attaining the fifth critical step (intelligence), even with the constraints (I) and (II), is about 50%. Naturally, this value appears to be very high, but it must be recognized that we have merely calculated the idealized mathematical probability. In reality, there will be a vast number of other criteria – for e.g. the presence of oceans (and continents), sufficiently high concentrations of bioessential elements, the existence of plate tectonics, the maintenance of a stable climate over Gyr timescales (Ward and Brownlee Reference Ward and Brownlee2000; Lammer et al. Reference Lammer, Bredehöft, Coustenis, Khodachenko, Kaltenegger, Grasset, Prieur, Raulin, Ehrenfreund, Yamauchi, Wahlund, Grießmeier, Stangl, Cockell, Kulikov, Grenfell and Rauer2009; Javaux and Dehant Reference Javaux and Dehant2010; Kasting Reference Kasting2010; Maruyama et al. Reference Maruyama, Ikoma, Genda, Hirose, Yokoyama and Santosh2013; Cockell et al. Reference Cockell, Bush, Bryce, Direito, Fox-Powell, Harrison, Lammer, Landenmark, Martin-Torres, Nicholson, Noack, O'Malley-James, Payler, Rushby, Samuels, Schwendner, Wadsworth and Zorzano2016; Stern Reference Stern2016; Lingam and Loeb Reference Lingam and Loeb2018a, Reference Lingam and Loeb2019a) – that must be simultaneously satisfied in order for each critical step to occur.Footnote 10 Hence, it is more instructive to view (14) as an upper bound, and use it to assess the relative prospects of life-bearing planets existing around stars of differing masses.
Hitherto, we have only discussed the prospects for life on an Earth-analog around a given star. However, it should be recognized that the total number of stars also varies depending of their mass, i.e. low-mass stars are more numerous than high-mass ones (Bastian et al. Reference Bastian, Covey and Meyer2010). Thus, we can calculate the relative number of stars  $\zeta _\star = {\cal N}_\star / {\cal N}_\odot $ with detectable primitive or intelligent life, with the total number of stars
  ${\cal N}_\star $ defined as follows:
 $$ {{\cal N}_\star = {\cal P}_n (M_\star)} \displaystyle{{{\rm d} N_\star} \over {{\rm d}\,(\ln M_\star)}}, $$
where  ${\rm d}N_\star /{\rm d}\,(\ln M_\star )$ represents the number of stars per logarithmic mass interval, and is calculated from the stellar initial mass function (IMF); here, we will use the IMF proposed by Kroupa (Reference Kroupa2001). Note that
  ${\cal P}_n(M_\star )$ is given by (14) and can be viewed as a measure of the probability of planets with life (and have passed through the n critical steps) per star.Footnote 11
We have plotted  $\zeta _\star $ as a function of
  $M_\star $ in Fig. 5. Let us begin by observing that
  $\zeta _\star = 1$ when
  $M_\star = M_\odot $ by definition. For n = 5, we find that the peak occurs at
  $M_\star = M_\odot $, implying that solar-mass stars in our Galaxy are the most numerous in terms of planets with intelligent life. On the other hand, for n = 2, the peak is seen at
  $M_\star \approx 0.6 M_\odot $ (and at
  $M_\star \approx 0.77 M_\odot $ when n = 3) indicating that K-type stars are potentially the most numerous in terms of having primitive, but detectable, life. For the values of n considered herein, we find that
  $\zeta _\star $ is almost constant in the range
  $0.5 M_\odot \lt M_\star \lt 1.5 M_\odot $ suggesting that these stars are the best targets in the search for life.

Fig. 5. The relative number of life-bearing stars  $(\zeta _\star )$ which have completed n critical steps as a function of the stellar mass
  $M_\star $.
The underlying reason for K-type stars being potentially more numerous in terms of hosting planets with detectable microbial biospheres stems from the fact that there are two distinct factors in (15). Hence, even though the probability per K-type star is comparatively lower than sun-like stars – see Fig. 4 – the second factor (relative number of K-type stars) compensates for the first, namely the probability  ${\cal P}_n(M_\star )$, in (15). On the other hand, when it comes to hosting planets with technological intelligence, the first factor in (15) dominates over the second, thereby ensuring that
  $\zeta _\star $ peaks for solar-type stars in Fig. 5.
Conclusion
We began by outlining a simple mathematical model predicated on the notion that evolution is effectively modelled as a series of independent ‘hard’ steps. One of the primary objectives was to study the ramifications of this model for the timing and likelihood of primitive and intelligent life on Earth and Earth-like exoplanets around other stars.
We began our analysis by focusing on the Earth and studying the total number of critical steps (n) that are likely on Earth based on the latest developments in geobiology. We found that the result depended on the time at which the Earth becomes uninhabitable in the future. For the more conservative estimate of 1 Gyr, we found that n = 5 probably represents the best fit, in agreement with previous studies. Unlike the standard 5-step model (Watson Reference Watson2008; McCabe and Lucas Reference McCabe and Lucas2010) based on the classic paradigm of major evolutionary transitions (Smith and Szathmáry Reference Smith and Szathmáry1995; Calcott and Sterelny Reference Calcott and Sterelny2011; Szathmáry Reference Szathmáry2015), we proposed that the following five steps could have represented vital breakthroughs in the history of life on Earth: (i) abiogenesis, (ii) oxygenic photosynthesis, (iii) eukaryogenesis (endosymbiosis leading to the acquisition of mitochondria and subsequently plastids), (iv) complex multicellularity (e.g. animals and plants), and (v) genus Homo (H. sapiens in particular). On the other hand, if the Earth's habitability comes to an end 2 Gyr in the future, we suggested that a 6-step model might represent the best fit, wherein the emergence of humans constituted the fifth critical step with one major transition yet to occur in the future.
Subsequently, we applied this model to study the prospects for life on Earth-analogs orbiting stars of different masses. Our analysis took into account constraints based on: (i) the duration of the CHZ, (ii) atmospheric escape due to stellar wind erosion, and (iii) availability of bioactive UV flux to promote abiogenesis. We found that the timescale for abiogenesis is longer than the duration of habitability for  $M_\star \lt 0.4 M_\odot $, strongly suggesting that such stars are not likely to host life-bearing planets. The prospects for primitive or intelligent life are highest for a generic Earth-analog around a solar-mass star based on this analysis.
Next, we computed the total number of planet-hosting stars (relative to the solar value) that could give rise to detectable signatures of primitive and intelligent life. With regard to the former, we found that the number peaks in the range 0.6– $0.8\,M_\odot $, implying that certain K- and G-type stars should potentially be accorded the highest priority in the hunt for biosignatures. Our analysis and conclusions are in agreement with previous studies of this subject (Huang Reference Huang1959; Dole Reference Dole1964; Kasting et al. Reference Kasting, Whitmire and Reynolds1993; Heller and Armstrong Reference Heller and Armstrong2014; Tian and Ida Reference Tian and Ida2015; Cuntz and Guinan Reference Cuntz and Guinan2016; Lingam and Loeb Reference Lingam and Loeb2017b). On the other hand, the total number of stars with intelligent life exhibited a peak near
  $M_\star \approx M_\odot $, thereby implying that sun-like stars represent the best targets for SETI. This could also serve to explain why technological intelligence like our own finds itself in the vicinity of a solar-mass star, despite the fact that low-mass stars are more numerous and long-lived (Loeb et al. Reference Loeb, Batista and Sloan2016; Haqq-Misra et al. Reference Haqq-Misra, Kopparapu and Wolf2018).
Naturally, there are a number of caveats that must be borne in mind with regard to the above conclusions. It is by no means clear as to whether evolution truly proceeds through a series of ‘hard’ steps, and that the number and nature of these steps will be similar on other exoplanets. Our analysis has dealt solely with the stellar mass, although other stellar parameters (e.g. activity, rotation, metallicity) play an important role. Moreover, by focusing exclusively on Earth-analogs, we have not taken the intricate non-equilibrium biogeochemical factors that have shaped Earth's evolutionary history into consideration. Our discussion also ignored the possible transfer of life between stars. Such transfer may involve lithopanspermia (Arrhenius Reference Arrhenius1908; Burchell Reference Burchell2004; Wickramasinghe Reference Wickramasinghe2010), directed panspermia (Crick and Orgel Reference Crick and Orgel1973; Mautner Reference Mautner1997) or interstellar travel and habitation by technologically advanced species (Shklovskii and Sagan Reference Shklovskii and Sagan1966; Crawford Reference Crawford1990; Lubin Reference Lubin2016; Lingam Reference Lingam2016b; Lingam and Loeb Reference Lingam and Loeb2018c). If such transfer events are common enough, which might be the case in some environments (Belbruno et al. Reference Belbruno, Moro-Martín, Malhotra and Savransky2012; Di Stefano and Ray Reference Di Stefano and Ray2016; Lingam and Loeb Reference Lingam and Loeb2017a; Chen et al. Reference Chen, Forbes and Loeb2018; Ginsburg et al. Reference Ginsburg, Lingam and Loeb2018), they could blur the quantitative conclusions of this paper because of diffusion processes and Galactic differential rotation (Newman and Sagan Reference Newman and Sagan1981; Lingam Reference Lingam2016a).
In spite of these limitations, it seems plausible that the critical step framework can be used to assess the relative merits of different models of the major evolutionary transitions on Earth. Furthermore, it also provides a useful formalism for gauging the relative likelihood of life on Earth-like planets orbiting different stars given the sparse data available at the current stage. Lastly, it offers testable predictions in the future, and, in principle, can therefore be falsified.
Acknowledgments
ML is grateful to Andrew Knoll for the illuminating and thought-provoking conversations. This work was supported in part by the Breakthrough Prize Foundation for the Starshot Initiative, Harvard University's Faculty of Arts and Sciences, and the Institute for Theory and Computation (ITC) at Harvard University.


