


Introduction
There are five known mechanisms by which autotrophic organisms fix carbon (Thauer Reference Thauer2007). Of these, however, a reductive tricarboxylic acid (rTCA) cycle, which is alternatively called the reverse Krebs cycle and the reductive citric acid cycle (Scheme 1), has been proposed as the most plausible metabolic pathway of CO2 fixation at the time life originated (Wachtershauser Reference Wachtershauser1990). That is, the rTCA cycle has been hypothesized as older than the origin of life, implying that it operated under non-enzymatic conditions. A non-enzymatic rTCA cycle might have functioned as an autocatalytic network of chemical reactions able to provide and self-sustain the biosynthetic pathways essential for life to originate (Wachtershauser Reference Wachtershauser1993; Morowitz et al. Reference Morowitz, Kostelnik, Yang and Cody2000; Smith & Morowitz Reference Smith and Morowitz2004). In this context, the rTCA cycle has also been suggested as the origin of the catabolic oxidative tricarboxylic acid cycle. The rTCA cycle also supplies metabolites for various biosynthetic pathways. For these reasons, a non-enzymatic rTCA cycle has received much attention in regard to the origin and evolution of life (Aoshima Reference Aoshima2007).

Scheme 1. The reductive tricarboxylic acid cycle as an engine for the synthesis of several major classes of biomolecules. Adapted from Smith & Morowitz (Reference Smith and Morowitz2004).
The rTCA cycle consists of reduction, carboxylation and dehydration reactions through a linear sequence of 11 carboxylic acids, which overall converts CO2 to citrate (Scheme 1). Kinetic considerations, however, show important limiting constraints for the viability of this cycle by non-enzymatic pathways (Ross Reference Ross2007). Specifically, slow reaction rates occur in the linear forward sequence compared with competing side and backward pathways. These unfavourable kinetics are explained at least in part by thermodynamically unfavourable endoergic steps. Recently, however, some of the endoergic reductive steps of the rTCA cycle were demonstrated as feasible through mineral photoelectrochemistry by the semiconductor mineral ZnS (sphalerite or wurtzite) (Zhang & Martin Reference Zhang and Martin2006). During ultraviolet irradiation, conduction band electrons with photoreducing ability are formed (Hoffmann et al. Reference Hoffmann, Martin, Choi and Bahnemann1995).
A critical point needing clarification for these earlier general findings demonstrating feasibility is to establish and constrain whether, for the specific conditions of the prebiotic world, the rTCA cycle can occur and self-sustain at a viable rate (Orgel Reference Orgel2000) when assisted by photoelectrochemistry (Schuster Reference Schuster2000). In this paper, we select one step of the rTCA cycle as a prototypical example and test its viability in detail under relevant prebiotic conditions. Specifically, we consider the viability of the photoelectrochemically driven rTCA reaction oxalosuccinate-to-malate reduction (Scheme 2). We measure the forward rate compared with the reverse oxaloacetate-to-pyruvate decomposition. The analysis supports that the non-enzymatic oxalate-to-malate pathway is viable for a wide range of prebiotic scenarios.
Scheme 2. Reduction of oxaloacetate (OAA) to malate (MA) competing against decarboxylation of OAA to pyruvate (PA). Reaction numbers correspond to those shown in the main text.
On prebiotic Earth 3.5 to 3.9 Ga ago, the atmospheric composition was dominated by N2, with important amounts of other gases, including 0.1 to 10 atm CO2 (Kasting Reference Kasting1993). In the absence of O3, wavelengths as short as 200 nm reached Earth's surface, penetrating into the oceans. A candidate environment for putting our laboratory study into context can be explored by adapting the conditions of today's hydrothermal sea vents to geochemical conditions in the past. Shallow-water vents are most relevant to photochemistry because ultraviolet light can penetrate. In these environments, the ocean waters receive warm gaseous and dissolved substances from these vents and exchange gases with the atmosphere. The concentrations of H2S, H2 and CH4 in the venting fluid are in the ranges 0.1–2400, 0.001–0.220, and 0.007–0.200 μM kg−1, respectively (Tarasov et al. Reference Tarasov, Gebruk, Mironov and Moskalev2005). Zn(II) concentrations range from 0.1 to >10 μM and can be taken as the expected lower limit for the conditions of early Earth. Compared with vent fluids of 10 to 120°C, surrounding waters are between 3 and 30°C. In prebiotic ocean waters (Holland Reference Holland1984) between pH 5.5 and 8 (Morse & Mackenzie Reference Morse and Mackenzie1998), high concentrations of aqueous HS− and Zn2+ are expected to have precipitated after cooling as low-solubility ZnS. Widespread occurrence of colloidal ZnS and other semiconducting minerals would have been capable of driving photoelectrochemical reactions in the top 200 m of the prebiotic ocean.
Experimental
Preparation of ZnS colloidal suspensions
A stock solution of 200 mM ZnSO4 (zinc sulphate heptahydrate, EM Science, Germany, 99.5% assay) was employed, together with a saturated stock solution of Na2S (EMD chemicals, 98% assay) that was kept in an O2-free environment, to prepare diluted suspensions for irradiation experiments. A suspension of ZnS colloid was prepared at 20°C by the addition of 240 mL of 52 mM ZnSO4 to 240 mL of nominally 52 mM Na2S added dropwise while stirring and continuously purging with ultra-high-purity argon gas. Argon-purged ultrapure Millipore water (18.2 MΩ cm) was used. The sulphide concentration in the stock Na2S solution with 1:100 dilution in 50% sulphide antioxidant buffer (SAOB) was determined by potentiometric titration with a 0.1 M Cd(NO3)2 standard (cadmium nitrate tetrahydrate, Fluka purum) using a sulphide ion selective electrode (Thermo Electron Corporation, Model Orion 94-16). SAOB was prepared from 80 g NaOH, 35 g ascorbic acid, and 67 g disodium ethylene diamine tetraacetic acid in 1000 mL water. Particle size, surface area, structure, morphology and surface defects of this kind of ZnS particle have been previously characterized (Zhang et al. Reference Zhang, Ellery, Friend, Holland, Michel, Schoonen and Martin2007).
Photochemistry experiments
Suspensions for the photochemistry experiments were prepared just prior to use. Oxaloacetic acid (CALBIOCHEM 98%) of 1.5 to 10 mM was added to the ZnS colloid, and the total volume was adjusted to 500 ml by the addition of concentrated H2SO4 (EMD Chemicals, 98.0% assay), 1 M NaOH, ultrapure water and Na2S stock solution. The Na2S concentration was 8 mM, and the initial pH was 7.0. The excess Na2S served to scavenge valence-band holes from ZnS during the course of the reaction, as well as to eliminate any adventitious O2. The colloidal suspension had a loading of 2.3 g L−1 ZnS.
The photochemical apparatus (Ace Glass, Vineland, NJ) consisted of a 500 ml glass reaction vessel outfitted with a water jacket to provide a thermostat/cryostat capability (Neslab RTE-111) of between 278 and 323 K. A 450 W medium-pressure ultraviolet mercury arc lamp was inserted in a quartz immersion well in the centre of the reaction vessel. The system was sealed and purged to exclude ambient O2. The ZnS suspension was constantly stirred during the irradiation. The light intensity between 200 and 400 nm (7.4×10⁻⁶ Einstein s−1) was measured by actinometry with potassium iron(III) oxalate (Kuhn et al. Reference Kuhn, Braslavsky and Schmidt2004).
Reactant and product analysis
Following irradiation for a selected time period, 1.0 mL of solution was withdrawn from the reaction vessel through a septum and passed through a 0.2 μm syringe filter to prepare for reactant and product analysis (IC Acrodisc 25 mm syringe filters, 0.2 μm pore size; Pall Corporation). The identity and the concentration of carboxylic acids in the filtrate were determined by ion chromatography. A Dionex ICS-3000, equipped with an IonPac AS11-HC analytical column (4×250 mm) and an IonPac AG11-HC guard column (4×50 mm), was used with conductivity detection and ASRS-ULTRA(II) (4 mm) suppression. A carbonate-free 100 mM NaOH eluent was prepared from a 50.3% sodium hydroxide solution (Fluka puriss) and ultrapure Millipore water (18.2 MΩ cm). A sodium-hydroxide gradient separation was applied, in which the mobile phase began at 2.5 mM NaOH for 2 min and was followed by a linear increase of 3.0 mM min−1 up to 54.0 mM NaOH for 5 min. Chemical species were identified by matching the retention times of pure standards. Concentrations were obtained from calibration curves. Standards included oxaloacetic acid (pK a1=2.85, pK a2=3.85), sodium pyruvate (Sigma-Aldrich ReagentPlus 99%), and malate (L-malic acid, disodium salt monohydrate, Sigma Aldrich 98%; pK a1=3.46, pK a2=5.10).
Decarboxylation experiments
Thermal decarboxylation kinetics were measured for the conversion of OAA to PA in the dark for 1.0 mM OAA at an initial pH of 7 and for temperatures in 5 K intervals from 278 to 323 K. OAA solutions were freshly prepared by adding solid oxaloacetic acid to a well-stirred NaOH solution adjusted to pH=7.0. A complication was that pH rose during the experiment because H+ was consumed by protonation of the enolate of the pyruvate product. To rule out any change in the rate of thermal decarboxylation over this range of change in pH, we ran analogous experiments in bicine buffer (Alfa Aesar, 99%) at pH=8.0 and 278, 298 and 318 K. In related experiments, we amended some solutions with variable concentrations of aqueous Zn(II) from ZnSO4.
Results and discussion
The viability of the photoelectrochemically driven OAA to MA reduction of the rTCA cycle can be assessed by an analysis of the reaction kinetics (reactions 2–5 of Scheme 2). The derivation presented in the appendix shows that the efficiency ξ of MA production from OAA relative to PA production from OAA decomposition (i.e., the forward compared with the backward directions of the rTCA cycle) is given by Eq. (1a) (see below). Furthermore, the derivation shows that the half-life t 1/2 of PA loss towards MA production (i.e., the speed of the forward direction of the rTCA cycle) is expressed in Eq. (1b) for OAA at steady state:
In Eqs (1a) and (1b), I a (Einstein s−1) is the absorbed light intensity, k i refers to the reactions in Scheme 2, and K 2, −2 is the equilibrium constant of reaction 2. Among other factors, the half-life through the pseudo-first order rate constant k′ depends on temperature via [HCO3−], K 2, −2, and k −2, on light intensity via I a and k 4, and on catalyst properties via k 4 and k 5. Investigations for k −2, K 2,−2, and γ are discussed below, while holding constant light intensity and catalyst properties but investigating the dependence on temperature, so that the efficiency and the half-life given by Eqs (1a) and (1b) can be estimated and hence the viability of the rTCA step of OAA→MA by mineral photoelectrochemistry can be assessed for early Earth conditions.
Oxaloacetate decarboxylation: k−2
Figure 1 shows the concentration of PA for increasing time at 5°C and pH=7.0, from which the rate constant k −2 for the thermal decarboxylation of OAA is obtained. The forward and backward reactions are as follows (Scheme 2):
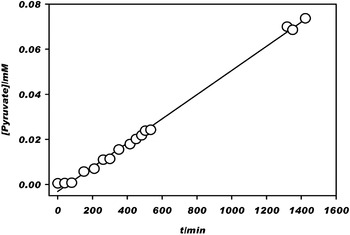
Fig. 1. Kinetics of the thermal decarboxylation of oxaloacetate. Pyruvate is the stochiometric product. The slope of the linear fit yields a rate constant k −2=8.9×10⁻⁷ s−1. Conditions: dark, neat solution (i.e., no colloidal ZnS or added ZnSO4(aq)), 278 K, pH=7.0, and 1 mM oxaloacetate.
From 5 to 50°C, the measured rate constants are plotted as 1/T in Fig. 2. Results are shown both for a buffer medium of bicine at pH=8.0 as well for unbuffered solution initially at pH=7.0, demonstrating a negligible effect of pH over this range. The pH increases from 7.0 during the course of an unbuffered experiment because of HCO3− production. The relationship k −2 versus 1/T has an Arrhenius dependence as log (k −2)=11.74−4956/T, where k −2 is in units of s−1, with an apparent activation energy E a,−2 of 94.6 kJ mol−1 and an A-prefactor of 4.9×10¹¹ s−1. The values of these parameters are consistent with those of other β-oxocarboxylic acids (Gelles Reference Gelles1956; Guthrie Reference Guthrie2002).

Fig. 2. Temperature dependence of the rate constant k −2 for the thermal decarboxylation of oxaloacetate. Circles: initial pH of 7.0. Rectangles: pH=8.0 in bicine buffer. Other conditions are as indicated for Fig. 1.
Pyruvate carboxylation: K2,−2
The free energy of reaction ΔrG° for equilibrium (2, −2) is 25.94 kJ mol−1 at 298 K, corresponding to K 2, −2=2.837×10⁻⁵ M−1 (Wood et al. Reference Wood, Davis and Lochmuller1966; Miller & Smith-Magowan Reference Miller and Smith-Magowan1990). The values of K 2,−2 at other temperatures, obtained from the integrated van't Hoff equation, are presented in Table 1. This equation is given by
and requires for evaluation the reaction enthalpy. The reaction enthalpy for pyruvate carboxylation ΔrH°(2, −2) can be obtained from the standard enthalpies of formation ΔfH° (aq) of the reactants and products in aqueous solution for standard states of 1 M for the ions and unit activity for water (i.e. pure water) (Miller & Smith-Magowan Reference Miller and Smith-Magowan1990; Kishore et al. Reference Kishore, Tewari and Goldberg1998):
Table 1. Values of k−2, K2,−2, and k′ from 273 to 323 K and pH=7.0

Then, ΔrH°(2, −2)=331.74 kJ mol−1. For comparison with ΔrG° (2, −2)=25.94 kJ mol−1 at 298 K, Smith & Morowitz (Reference Smith and Morowitz2004) reported 62.1 kJ mol−1, but this value appears incorrect; which can be explained by the omission of the water molecule in their calculation.
Oxaloacetate-to-malate photoreduction: γ
Figure 3 shows the quantum efficiency φMA of MA production from OAA in the presence of ZnS colloid for several concentrations of OAA. The mechanism of photoelectrochemistry can be simplified into photoexcitation, charge–carrier recombination, and reductive chemistry, as represented by reactions 3 to 5:
where ZnS* indicates an excited state. ZnS* can undergo relaxation through electron-hole pair recombination (reaction 4) or alternatively reduce OAA to produce MA (reaction 5) using a conduction band electron e−. The hole scavenger in this case is HS−. The composite rate coefficient j 5 of MA photoproduction, which is equal to that of OAA loss by Eq. (5), can be expressed as d[MA]/dt=−d[OAA]/dt=j (5) [OAA]=k 5 [ZnS*] [OAA], implying that j 5=k 5[ZnS*], where j 5 (s−1)≡φMAI a/[OAA] and φMA is the quantum yield. From Eqs (3)–(5), we write at steady state (see the Appendix) that [ZnS*]=I a(k 4+k 5 [OAA])−1, implying that φMA=[OAA](γ+[OAA])−1. The data of Fig. 3 fit this model for γ=k 4/k 5=2.1×10⁻³ M, which is shown as the solid line in the figure. Quantum yield is expected to depend on light intensity, colloidal particle surface area, pH, surface and bulk structures and defects, among other factors, all of which are held constant in this study, allowing the lumping of these terms into an effective coefficient j 5. In our analysis, we assume that these factors regarding catalyst properties in our laboratory study are representative of the photoelectrochemical properties of ZnS colloidal particles in the oceans of early Earth.
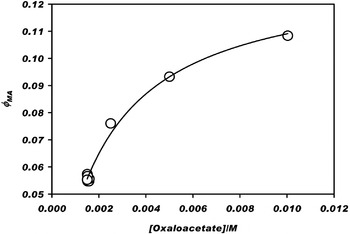
Fig. 3. Quantum efficiency φMA for the photoelectrochemical production of malate (MA) from several concentrations of oxaloacetate (OAA). The fitted curve yields φMA=0.13 [OAA] (2.1×10⁻³+[OAA])−1. Conditions: 2.3 g l−1 ZnS mineral, HS− valence band hole scavenger, pH=7.0, irradiated at λ>200 nm, 293 K, and pH=7.0. Control experiments: no malate was detected in the absence of any one of UV light, ZnS catalyst, H2S hole scavenger, or oxaloacetate reactant.
Figure 4 shows that the photoelectrochemical production rate of MA is independent of temperature, at least for the range of conditions investigated. Photoelectrochemical reaction rates in the condensed phase are often temperature-independent. There is thus a basic difference in the temperature dependence of the side or back thermal reactions compared with the forward photoreactions, and this difference is important when considering the viability of the forward pathway in the rTCA cycle.
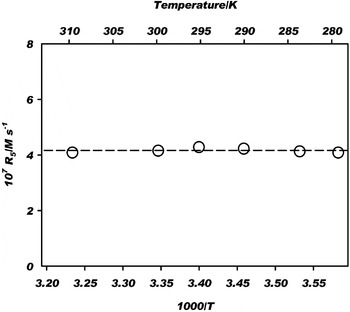
Fig. 4. Temperature independence of the photoelectrochemical production rate of malate from oxaloacetate. The horizontal line shows the mean production rate of 4.2×10⁻⁷ M s−1. Conditions: as indicated for Fig. 3 for 1.5 mM oxaloacetate.
Viability: ξ and t1/2
Table 1 and Fig. 5 respectively show k −2, K 2,−2, and k′ and the evaluation of ξ and t 1/2 as a function of temperature. For the calculation of k′, an expression for the dependence of [CO2(aq)] (M) on temperature at 1 atm CO2 was used (Lide Reference Lide2008):
[HCO3−] was obtained as 0.82 [CO2(aq)] to account for speciation at pH=7.0. Regarding I a, the ultraviolet fluxes for 3.5 to 3.9 Ga ago in UVA (315–400 nm), UVB (280–315 nm), and UVC (200–280 nm) were taken as 40, 5, and 1 W m−2, respectively (Cockell Reference Cockell2000), corresponding to a mean total ultraviolet intensity for the prebiotic Earth of 5.5×10⁻³ Einstein s−1. We assume that the ZnS loading was high enough to absorb all of these photons and we omit the screening effects of other chromophores in the ocean waters.

Figure 5 shows that the efficiency ξ of OAA→MA compared with OAA→PA drops from 90% at 280 K to 10% at 314 K, suggesting an increasing viability at lower temperatures. For increasing temperatures the backward thermal decomposition is progressively favored over the forward photoelectrochemical pathway. Over the same temperature range, the half-life of PA conversion towards MA increases from 3 yr at 280 K to 4×10⁵ yr at 314 K. For increasing temperature, the forward direction of this step of the rTCA slows, which can be explained by the decreasing efficiency. This study's measurements and the associated analysis presented herein for early Earth conditions therefore support a more efficient and more rapid turning of the rTCA cycle with regard to the OAA→MA step for decreasing temperatures. As an example, at 280 K there is 90% efficiency and 3 yr/cycle forward velocity for the OAA→MA step. These results suggest high viability for mineral photoelectrochemistry as an engine to drive the rTCA cycle through the early aeons of early Earth, at least for the investigated OAA→MA step.
Other factors
In the oceans of early Earth, besides ZnS colloidal particles, aqueous Zn(II) ions are also believed to have been present. A solution of OAA at pH=7.0 is speciated by more than 99.9% as the dianion and contains the keto:enol:hydrate forms in the ratios 81:12:7, respectively (Pogson & Wolfe Reference Pogson and Wolfe1972; Kokesh Reference Kokesh1976; Emly & Leussing Reference Emly and Leussing1981). Aqueous Zn(II) can form complexes with the keto and enol structures (Gelles & Hay Reference Gelles and Hay1958; Gelles & Salama Reference Gelles and Salama1958a,Reference Gelles and Salamab; Covey & Leussing Reference Covey and Leussing1974), and these complexes can promote decarboxylation to form PA. However, further enolization into stable intermediates, such as a dinuclear metal complex species, that hinder decarboxylation is also possible. These pathways could affect the viability of the overall PA→OA→MA sequence, and they should also therefore be considered.
Previous studies of the effect of Zn(II) on decarboxylation rates of OAA have been done at 303 K and pH=5 and found that for 0.1–32 mM Zn(II), k −2 increases by between 10 and 80 times relative to the uncatalysed reaction (Speck Reference Speck1949). At this pH, speciation is 7% as the monoanion species of OAA (OAAH−), which decarboxylates four times faster than the dianion OAA (OAA2−) (Pedersen Reference Pedersen1952). These studies, however, were not carried out for the pH conditions of our study, and the range of Zn(II) concentrations was limited.
We carried out a series of experiments on the possible influence of dissolved Zn(II) on the thermal decomposition of OAA for the range of our experimental conditions. Figure 6 shows the effect of Zn(II) concentration on the decarboxylation rate constant of OAA (k −2) at pH=7.0 and 298 K. For [Zn(II)] <0.01 mM, k −2 is the same within experimental uncertainty as measured for the unaugmented solution (Table 1). For 0.01 <[Zn(II)] <1 mM, k −2 increases, which can be explained by the formation of reactive keto complexes. The maximum increase is 10-fold. For [Zn(II)] >1 mM, k −2 drops to the unaugmented value. This inhibition results from the formation of unreactive dinuclear enolate metal ion complexes (Covey & Leussing Reference Covey and Leussing1974; Tsai & Leussing Reference Tsai and Leussing1987). The results shown in Fig. 6 bracket the expected range of dissolved Zn(II) in the oceans of early Earth. The values in Fig. 6 are slow enough that they do not influence our conclusions regarding the viability of the oxalate-to-malate transformation by mineral photoelectrochemistry.
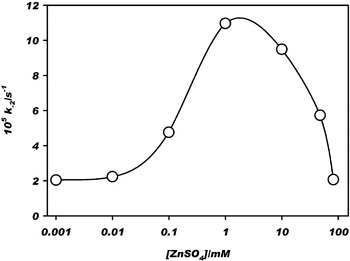
Fig. 6. Effect of aqueous Zn(II) concentration on the rate constant k −2 for the thermal decarboxylation of oxaloacetate to pyruvate at 298 K. Other conditions are as indicated for Fig. 1.
Conclusions
The kinetic measurements of this study demonstrate the viability of driving one part of the rTCA cycle (specifically, OAA to MA conversion) by colloidal photoelectrochemistry. They also support the possibility of driving the sequence PA→OAA→MA. These reactions harvest light as the primordial source of energy and provide a plausible mechanism for the formation of simple, biologically important molecules on early Earth. As an example, our analysis shows that there is 90% efficiency and a forward velocity of 3 yr/cycle for the OAA→MA step of the rTCA cycle at 280 K. Efficiency and velocity both decrease for increasing temperature. On this basis, an enzyme-free conversion OAA→MA on early Earth would have been possible in the rTCA cycle. More generally, the rTCA cycle has four other reductive steps in addition to the selected prototypical reaction OAA→MA (cf. Scheme 1). The viability of each of these other steps can be evaluated on the same basis as presented herein for OAA→MA.
In summary, it is possible that colloidal photoelectrochemistry had an active role on early Earth for converting and cycling small organic compounds essential for the origin of life (Zhang et al. Reference Zhang, Martin, Friend, Schoonen and Holland2004, Reference Zhang, Ellery, Friend, Holland, Michel, Schoonen and Martin2007; Zhang & Martin Reference Zhang and Martin2006). The interaction of excited-state species and radicals, driven by energy harvested from sun's photons, can open reaction pathways that can be slow by thermal chemistry alone. Reduction reactions can aid in the assembly of some of the building blocks essential to the prebiotic synthesis of even more organized molecules and structures, such as catalysts and bilayers.
Acknowledgments
M.I.G. is the recipient of a Postdoctoral Fellowship from the Harvard Origins of Life Initiative. This study is supported by the National Aeronautics and Space Administration under Grant NNX07AU97G issued through the Office of Space Science.
Supporting information available
Text: calculation of the concentration of CO2(aq) as a function of temperature in reference to Eq. (6).
Appendix
The rate equation for photoexcited ZnS* follows from reactions 3 to 5:
Under continuous irradiation, the steady-state approximation for ZnS* allows Eq. (A1) to be written as follows:
The rate of MA production and OAA loss in reaction 5 is given by the following equation:

For small [OAA], we obtain for reaction 5:
Using the steady-state approximation for [OAA], we can write for the sum of sources and sinks of OAA:

From Eq. (A5), the efficiency ξ of MA production from OAA relative to PA production from OAA decomposition is as follows:

where γ=k 4k 5−1. From Eqs (A4) and (A5), the overall rate for MA production from PA via OAA is as follows:
where K 2,−2=k 2/k −2 for equilibrium PA⇄OAA. For OAA at steady state, the half-life of PA loss towards MA production is expressed in Eq. (1b):
Calculation of CO2(aq) Concentration as a Function of Temperature
The following procedure was used to obtain the CO2(aq) concentrations as a function of temperature for the interval 0–50°C. The CO2 mole fraction, ![]() , in liquid phase at pressure P=1 atm=101.325 kPa as a function of temperature, T, was obtained by extrapolation of every pressure P vs.
, in liquid phase at pressure P=1 atm=101.325 kPa as a function of temperature, T, was obtained by extrapolation of every pressure P vs. ![]() data series, at each temperature. Data used for this purpose is in Table 8-84 of the CRC Handbook of Chemistry and Physics (Lide, Reference Aoshima2008). In this way a linear fitting is obtained at each temperature:
data series, at each temperature. Data used for this purpose is in Table 8-84 of the CRC Handbook of Chemistry and Physics (Lide, Reference Aoshima2008). In this way a linear fitting is obtained at each temperature:
where P is given in kPa units and b 1 and b 2 represent the slope and intercept coefficients, respectively. Table S1 gathers the linear regression fitting parameters for Equation S1 at P=101.325 kPa as a function of temperature.
Table S1. Linear coefficients for the CO2 mole fraction dependence with pressure, extrapolated CO2 mole fraction to 101.325 kPa, and calculated CO2(aq) molar concentration in water, at variable temperature

Table S1 also shows the conversion of extrapolated ![]() data at 101.325 kPa to [CO2(aq)] in molar concentration, results that represent the solubility of CO2 at variable temperatures. From a linear fitting for the log[CO2(aq)] vs. 1/T data of Table S1, the following expression to calculate molar CO2(aq) concentrations as a function of temperature at
data at 101.325 kPa to [CO2(aq)] in molar concentration, results that represent the solubility of CO2 at variable temperatures. From a linear fitting for the log[CO2(aq)] vs. 1/T data of Table S1, the following expression to calculate molar CO2(aq) concentrations as a function of temperature at ![]() atm is obtained:
atm is obtained:


