


Introduction
The discovery of liquid water below the icy surfaces of several moons orbiting Jupiter and Saturn is an exciting prospect for complex chemical and even biological activity taking place within them. However, accessing these subsurface oceans is problematic. The subsequent discovery (Dougherty et al., Reference Dougherty, Khurana, Neubauer, Russell, Saur, Leisner and Burton2006; Hansen et al., Reference Hansen, Esposito, Steward, Colwell, Hendrix, Pryor, Shemansky and West2006; Kargel, Reference Kargel2006; Spencer et al., Reference Spencer, Pearl, Segura, Flasar, Mamoutkine, Romani, Buratti, Hendrix, Spilker and Lopes2006) of water vapour plumes venting from Saturn's moon Enceladus (REnc~250 km) through geyser-like structures near the moon's south pole (Porco et al., Reference Porco, Helfenstein, Thomas, Ingersoll, Wisdom, West, Neukum, Denk, Wagner, Roatsch, Kieffer, Turtle, McEwen, Johnson, Rathbun, Veverka, Wilson, Perry, Spitale, Brahic, Burns, Del Genio, Dones, Murray and Squyres2006) , can help probe the interior processes of this particular object.
Most work to date on the molecular content of material ejected from Enceladus has been conducted through in situ observations by the Cassini spacecraft and by its Ion and Neutral Mass Spectrometer (INMS; Waite et al. Reference Waite, Combi, Ip, Cravens, McNutt, Kasprzak, Yelle, Luhmann, Niemann, Gell, Magee, Fletcher, Lunine and Tseng2006, Reference Waite, Lewis, Magee, Lunine, McKinnon, Glein, Mousis, Young, Brockwell, Westlake, Nguyen, Teolis, Niemann, McNutt, Perry and Ip2009). Molecules such as water, carbon dioxide, methane, methanol, ammonia and formaldehyde have been detected in the plumes; a further component of molecular mass 28 (CO or N2) has also been seen. These observations are conducted in flybys at different altitudes above the surface and on different trajectories, so the properties of the entirety of the plume and any chemical processing within the plume (e.g. by Solar ultraviolet light) must be inferred.
On larger scales, a neutral OH torus orbiting Saturn was found by Shemansky et al. (Reference Shemansky, Matheson, Hall, Hu and Tripp1993), which is fed by these active H2O plumes (Jurac et al., Reference Jurac, Johnson and Richardson2001; Jurac & Richardson, Reference Jurac and Richardson2005). The neutral torus is assumed to be centred on Enceladus' orbit (3.95 Saturn radii or RS; RS = 60268 km), extending from 2.7 to 5.2 RS (Farmer, Reference Farmer2009). H2O in the neutral torus has been further explored by the Herschel Space Observatory (Hartogh et al., Reference Hartogh, Lellouch, Moreno, Bockelée-Morvan, Biver, Cassidy, Rengel, Jarchow, Cavalié, Crovisier, Helmich and Kidger2011), while low signal-to-noise has limited Cassini from performing in situ measurements.
The Cassini mission has now ended and conducted its final flyby of Enceladus at the end of 2015. With little or no prospect of a new mission to Saturn before 2030, further studies and monitoring of the Enceladus plume must be done remotely from the Earth. Fortunately, submillimetre spectroscopy is well suited to such studies since many of the organic molecular species of interest have transitions at these wavelengths. A disadvantage is that single-dish telescopes, while suited to temporal monitoring, trace larger regions than the size of the plumes. In light of further developments in the plume composition from Cassini and neutral gas environment surrounding Enceladus by Herschel, we present the first results from a programme of submillimetre spectroscopic observations of a gas cloud near Enceladus using ground-based observatories from early 2008.
This paper is organized as follows: Section ‘Observations’ details the ground-based observations targeting methanol (CH3OH) and section‘Results’ presents the methanol spectrum. Section‘Models’ details the radiative transfer and dynamical models used to constrain the methanol abundance and the likely region from which the methanol originates. Lastly, we summarize our results and discuss their implications for using methanol as a biomarker in Solar system objects and exoplanet environments in Section‘Discussion and conclusions’.
Observations
The observations were made at the Instituto de Radioastronomie Milimetrica (IRAM) 30 m telescope at Pico Veleta, Spain at 1–8 h UT on 10 Jan 2008 using the HERA camera and the VESPA spectrometer. The CH3OH 5(1,1)-4(1,1) line at 239.7463 GHz was observed with 80 MHz passbands with a telescope beam size of ~10.5′′ full width at half maximum ( FWHM). The observations were made by frequency-switching over a narrow 3.45 MHz interval to maintain flat baselines using 80 kHz channels in VESPA. Figure 1 shows the location of Enceladus w.r.t. Saturn at the time of observations. The angular size of Enceladus was 0.08′′ with Saturn 8.6 AU from the Earth. The ring opening angle was −6.9°. We note that the only possible contaminant within the beam was the moon Mimas towards the end of the observing period.
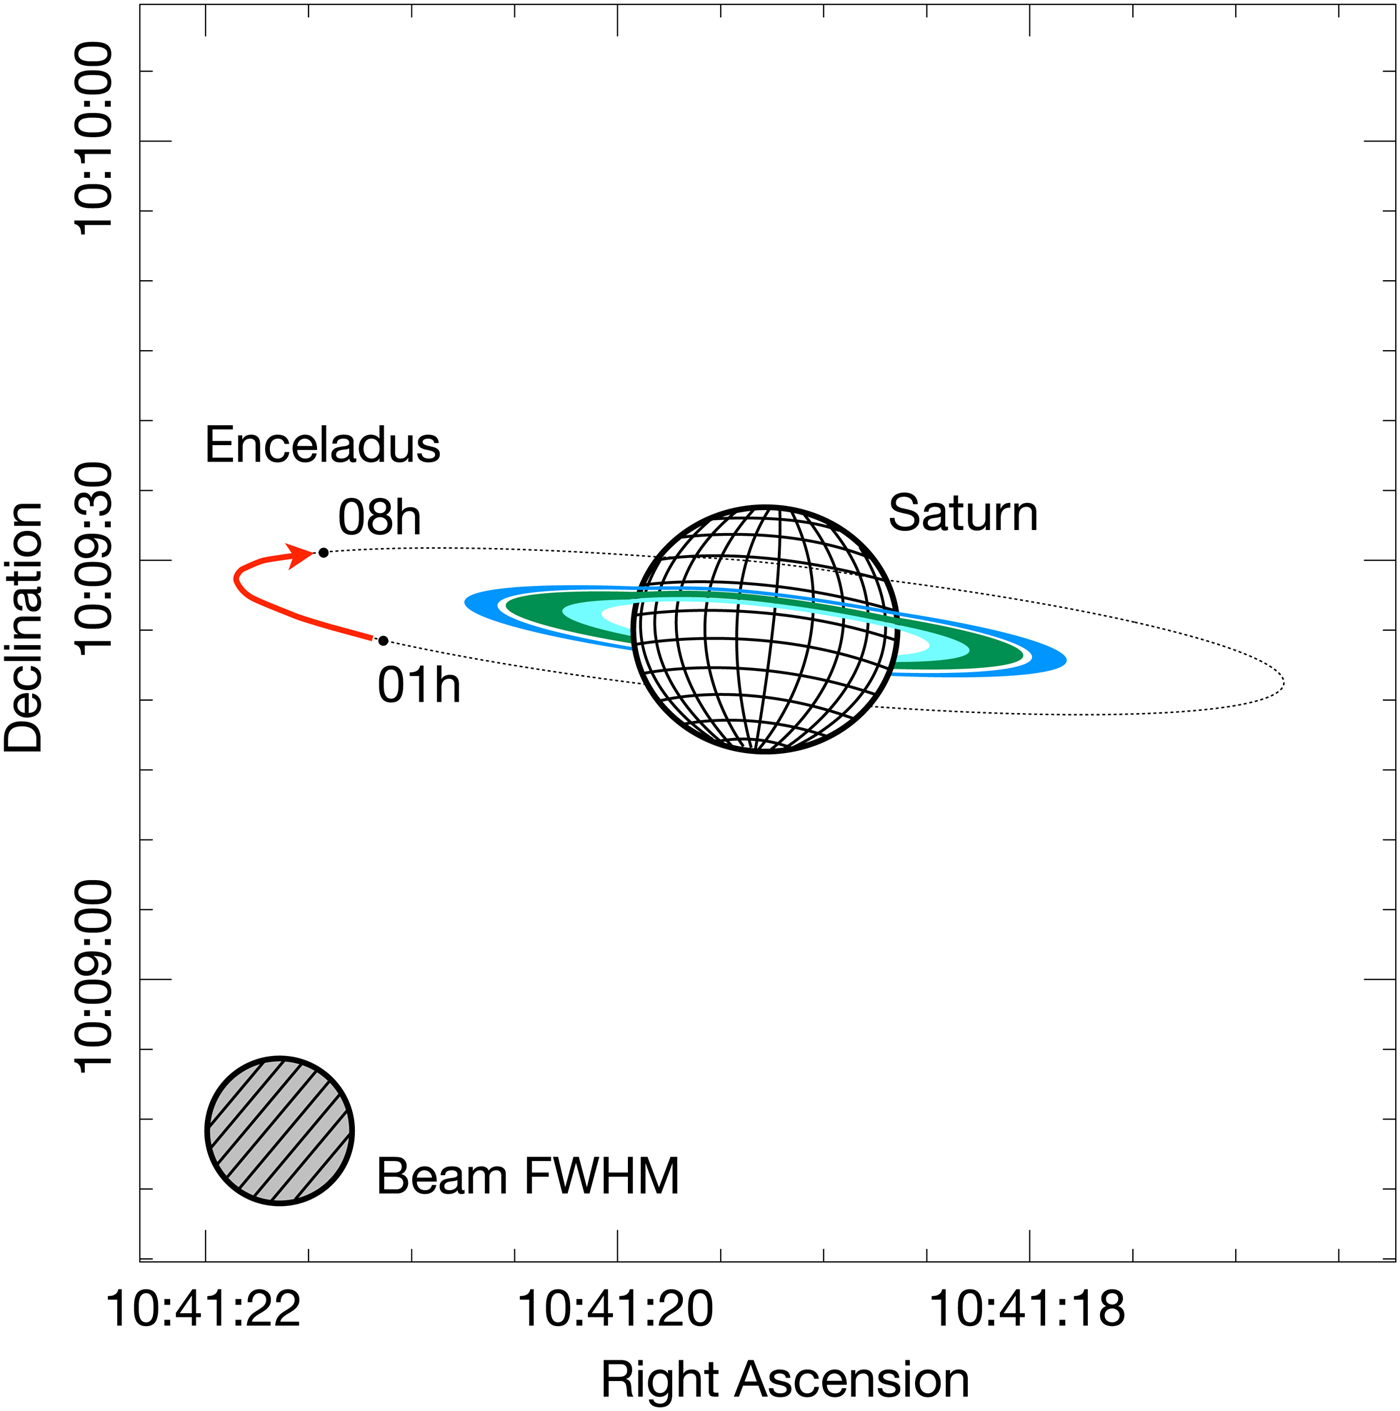
Fig. 1. Location of Enceladus and Saturn during the CH3OH observations on 10 January 2008 (1–8 h UT). The C- (innermost ring; light blue), B- (centre ring; green) and A-rings (outer ring; blue) are shown, along with the centre of the E-ring (dotted line), which also corresponds to Enceladus' orbital radius.
The telescope could track Enceladus, but the acquisition software was only able to track the velocity of Saturn. Saturn was offset by ≥30′′ during the observations to prevent spectral contamination of the Enceladus data. Velocity shifts to place the data in the Enceladus rest-frame were then made in reduction software for each observation. In total, 48 observations were made, with the drift between observations being <0.1 km s−1 on average (worst case of 0.4 km s−1). The applied shift varied from −9.2 km s−1 at the start to −12.6 km s−1 at the maximum elongation followed by reversal back to −10.6 km s−1 at the end of the track. Hence, any artefacts associated with particular spectrometer channels would be smeared over a few km s−1 in the co-added data, and so not be able to create a false-positive narrow line.
Details of the data reduction (i.e. despiking, baseline-fitting and baseline-subtraction) are given in the Appendix (see Fig. A1). The spectra are automatically calibrated to a T*A antenna temperature scale. However, we must correct the antenna temperature scale for telescope inefficiency. The efficiencies were not measured during our run, but the HERA User Manual (V2.0; Nov 2009) stated the beam efficiency is 0.52 at 230 GHz and the forward efficiency is 0.90. We calculate a main-beam temperature T MB = F eff/B eff T*A, i.e. T*A is divided by 0.58 to give T MB.
In addition to the CH3OH spectrum, we also include publicly available observations taken by Herschel (originally from project ID OT2_elellouc_3, PI Lellouch) of the ortho-H2O 212–101 line at 1669.9 GHz, taken on 27 June 2012 at ~22:00 UT over a period of ~0.33 h using the HIFI instrument. The observations were taken in the fast DBS (dual beam switch) raster mapping mode, where we extracted the spectrum using only the observation centred directly on Enceladus. The telescope beam FWHM is ~13′′ at ~1660 GHz. During this observation, Enceladus was at similar elongation from Saturn as the observations from IRAM, where the rings were edge-on.
Results
The co-added CH3OH spectrum is shown in Fig. 2(a) with 0.1 km s−1 velocity channels and in a frame co-moving with Enceladus. The peak antenna temperature T*A is 0.038 ± 0.011 K (3.6σ) and integrated intensity  $\int {{T}_A^{\ast}} \; \hbox{dv}$ is 0.018 ± 0.003 K km s−1 (5.9σ). This is the only significant feature within the passband, where all other signals summed across 0.8 km s−1 intervals (totalling 125 intervals across the 80 MHz passband) are ≤ 3σ (i.e. ≤ 0.009 K km s−1). See the Appendix for more detail regarding the robustness of the CH3OH detection (i.e. Fig. A1). Accounting for the beam and forwards efficiency, the peak main-beam temperature T MB is 0.066 K and integrated intensity
  $\int {T}_{\rm MB} \; \hbox{dv}$ is 0.031 K km s−1.
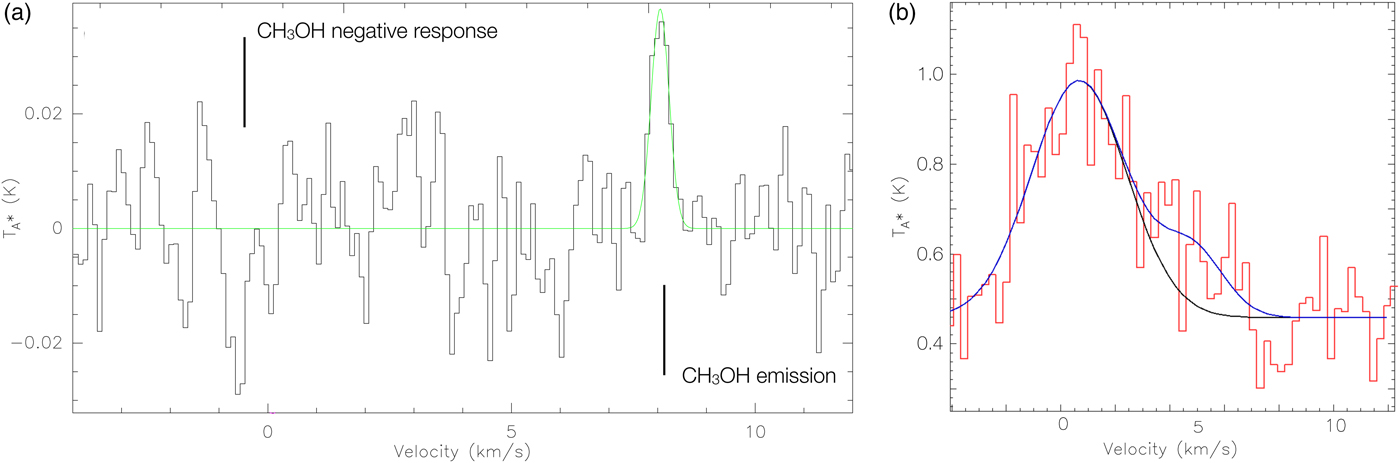
Fig. 2. CH3OH and H2O observations of Enceladus in the moon's velocity frame. Left: CH3OH spectrum in antenna temperature T*A (K), where the Gaussian fit to the line is overplotted in green. We note that the feature at ~ − 0.5 km s−1 is the CH3OH line seen as a negative response. The 3.45 MHz frequency-switching interval causes the CH3OH line emission to appear as both a positive and negative response, separated by twice the interval size (i.e. 6.9 MHz or ~ 8.6 km s−1). Right: H2O spectrum in antenna temperature T*A (K). We fit a Gaussian to the main peak in the spectrum (black) and a combination of two Gaussians to fit the full line profile.
The line FWHM is 0.43 km s−1 as measured by fitting a Gaussian to the methanol detection (Fig. 2), and the line is centred at +8.1 km s−1 relative to the moon. This indicates that we are not looking at material in the direct vicinity of the plume origin, but material that has been redshifted by some means.
The ortho-H2O 212–101 line is shown in Fig. 2(b) with 0.3 km s−1 velocity channels in a co-moving Enceladus frame. The full line profile must be fitted with a two-component Gaussian due to a significant redshifted H2O line-wing. This redshifted emission spans ~14 velocity channels (i.e. up to ~7 km s−1) with a total signal ~0.421 ± 0.105 K km s−1 (i.e. 4σ). Even though the venting process is variable (Hedman et al., Reference Hedman, Gosmeyer, Nicholson, Sotin, Brown, Clark, Baines, Buratti and Showalter2013), the Herschel H2O observation is redshifted by a similar amount as the CH3OH detection 4 years earlier.
Models
Even though methanol has been found within the plume components (Waite et al., Reference Waite, Lewis, Magee, Lunine, McKinnon, Glein, Mousis, Young, Brockwell, Westlake, Nguyen, Teolis, Niemann, McNutt, Perry and Ip2009), the region in which IRAM can detect methanol must be on a larger scale. The diameter of the telescope beam subtends ~73 000 km (~1.2 RS), which is much larger than Enceladus' diameter of only ~500 km. Even if the methanol cloud is optically thick and warm (e.g. plume temperatures are ~180 K; Johnson et al. Reference Johnson, Smith, Tucker, Liu, Burger, Sittler and Tokar2006; Cassidy & Johnson Reference Cassidy and Johnson2010), the minimum size we are sensitive to is ~1750 km, or 7 REnc. On the other hand, diffuse gas in the larger neutral torus could fill the beam (where the torus has a radial extent of REnc ± 1.25 RS and a vertical extent of ±0.4 RS; Farmer Reference Farmer2009; Hartogh et al. Reference Hartogh, Lellouch, Moreno, Bockelée-Morvan, Biver, Cassidy, Rengel, Jarchow, Cavalié, Crovisier, Helmich and Kidger2011).
For generality, we consider a cloud of methanol with length l, and use the non-local thermodynamic equilibrium (non-LTE) radiative transfer code RADEX to find solutions for the radiation temperature (T R). Details of RADEX and the full parameter space of the models that fit the CH3OH observation can be found in the Section‘Full RADEX parameter space’. For clouds with size scales smaller than the telescope beam (i.e. l < 73 000 km), we must account for beam dilution, which causes the main-beam temperature to be lower than the expected radiation temperature by T MB = η dil T R, where η dil = (l2/l2 + l2beam) and lbeam is the beam diameter.
For the radiative transfer models, we set the gas kinetic temperature T gas = 100 K (e.g. Hartogh et al. Reference Hartogh, Lellouch, Moreno, Bockelée-Morvan, Biver, Cassidy, Rengel, Jarchow, Cavalié, Crovisier, Helmich and Kidger2011) and the line FWHM at 0.43 km s−1 as observed (section‘Results’). While plume temperatures reach ~180 K (Johnson et al., Reference Johnson, Smith, Tucker, Liu, Burger, Sittler and Tokar2006; Cassidy & Johnson, Reference Cassidy and Johnson2010), we expect plumes to cool to Saturn's thermal field (100 K) at the scales traced by our observations (see Hartogh et al. Reference Hartogh, Lellouch, Moreno, Bockelée-Morvan, Biver, Cassidy, Rengel, Jarchow, Cavalié, Crovisier, Helmich and Kidger2011 for modelling of the gas temperature within the neutral torus). From the gas kinetic temperature, we can calculate the non-thermal (turbulent) velocity dispersion of methanol by σ 2NT = σ 2CH3OH − σ 2T, where σ NT is the non-thermal line width, σ CH3OH is the observed line width of CH3OH (calculated from  $ {\rm \sigma}_{{\rm CH}_3{\rm OH}}= \hbox{v}_{\rm FWHM} / \sqrt {8\ln (2))}$ and σ T is the thermal component of the line width (assuming a 100 K cloud). Removing the thermal component leaves a turbulent velocity dispersion of ~0.1 km s−1, suggesting the methanol gas is dispersing at ≤ 0.1 km s−1.
Solutions for T MB were sought for different CH3OH:H2O abundance ratios (X), where we relate the H2O density, n(H2O), to the CH3OH column density, N(CH3OH) by n(H2O) = (N(CH3OH)/lX). The CH3OH:H2O abundance is constrained as X ≤ 5%, which is the expected C:H2O budget (estimated from the CO2:H2O abundance within Enceladus' plumes; Waite et al. Reference Waite, Lewis, Magee, Lunine, McKinnon, Glein, Mousis, Young, Brockwell, Westlake, Nguyen, Teolis, Niemann, McNutt, Perry and Ip2009). If methane CH4 is the parent species of CH3OH, then the preferred CH3OH:H2O abundance is X ≤ 1%. In RADEX, the collision partner is H2, so we set density to be 10 × higher to account for the higher mass of the actual collision partner H2O.
Additionally, we find solutions for the cloud length l that reproduce TMB(CH3OH) within the allowed CH3OH:H2O abundance. Furthermore, a maximum H2O column density was applied. The maximum assumes that all of the H2O molecules vented (estimated to be 1028 molecules s−1; Smith et al. Reference Smith, Johnson, Perry, Mitchell, McNutt and Young2010) will survive during the photodissociation timescale ~2.5 months (e.g. Cassidy & Johnson Reference Cassidy and Johnson2010; Smith et al. Reference Smith, Johnson, Perry, Mitchell, McNutt and Young2010; Hartogh et al. Reference Hartogh, Lellouch, Moreno, Bockelée-Morvan, Biver, Cassidy, Rengel, Jarchow, Cavalié, Crovisier, Helmich and Kidger2011) within the specific region of size l.
Figure 3 depicts the models that match the expected CH3OH radiation temperature (i.e. the main-beam temperature corrected for beam dilution) within a conservative 50% uncertainty for each cloud length l. We investigate the CH3OH:H2O abundance by comparing the methanol and water column densities, N(CH3OH) and N(H2O) for each cloud length. We find allowed CH3OH cloud dimensions l to be 1750–72500 km. At smaller cloud lengths (l < 1750 km), methanol becomes increasingly beam diluted and high densities and column densities are needed to produce the methanol detection. However, CH3OH also becomes optically thick and higher gas temperatures are needed to adequately reproduce the beam-diluted detection. We find the modelled CH3OH-to-H2O abundance is relatively independent of cloud length, ranging from 0.5 to 5%. This abundance is ~50 × higher than what is found in the direct vicinity of the plumes (Waite et al., Reference Waite, Lewis, Magee, Lunine, McKinnon, Glein, Mousis, Young, Brockwell, Westlake, Nguyen, Teolis, Niemann, McNutt, Perry and Ip2009), implying chemical processing has occurred.

Fig. 3. Left: RADEX model results for CH3OH and H2O column densities and varying cloud lengths that match the CH3OH observation. Colours correspond to cloud lengths 1750–75 000 km (in increments of 250, 500 and 2500 km at ranges l < 2500 km, 2500 < l < 5000 km and l > 5000 km, respectively). Dashed lines (left to right) correspond to CH3OH-to-H2O abundances of 5, 1 and 0.5%. Right: Plasma velocities near Enceladus, based on Fig. 2 in Jia et al. (Reference Jia, Russell, Khurana, Ma, Najib and Gombosi2010). The component X (R=R Enc) is along the direction of the corotational flow around Saturn and component Y is positive towards Saturn. Velocities are measured w.r.t. Enceladus' orbital velocity. Contours correspond to the highest plasma densities, n~1–4 × 102 cm−3.
The cloud size scenarios are summarized in the appendix (Table B1), including the range of H2O densities from the RADEX models that fit the CH3OH observation. For smaller cloud lengths (e.g. l = 1750 km), we have H2O densities ranging from nRADEX(H2O) = 1.5 × 10⁹–1.1 × 1010 cm−3. This density range is reasonably in agreement with past Cassini measurements of the E3 and E5 flybys, which found the peak H2O density to reach ~108–109 cm−3 near the plumes (Smith et al., Reference Smith, Johnson, Perry, Mitchell, McNutt and Young2010; Teolis et al. Reference Teolis, Perry, Magee, Westlake and Waite2010). At larger cloud lengths (e.g. l = 72 500 km), we find the H2O density range to be nRADEX(H2O) = 4.5 × 10⁴–1.6 × 105 cm−3, slightly above Cassidy & Johnson (Reference Cassidy and Johnson2010), which found neutral densities in the torus ~104 cm−3.
We can estimate how far the CH3OH is able to travel outward from Enceladus from the photodissociation timescales under solar irradiation. If the gas is dispersing at ≤ 0.1 km s−1 and the photodissociation timescale is tphoto = 1.7 × 10⁶ s (accounting for Saturn's distance at 9.3 AU; Huebner et al. Reference Huebner, Keady and Lyon1992), then we expect a methanol cloud extent up to ≤ 173 000 km (i.e. ~3 RS). This means the methanol is easily able to spread into the neutral torus and fill the beam of the telescope. We note that H2O and CH4 have even longer photodissociation timescales than CH3OH and are not a limiting factor.
Therefore, there are two possible explanations for the narrow CH3OH line observation: methanol is made both by Enceladus and through other chemical pathways within the neutral torus that: (1) spreads outward or (2) remains in a more compact, confined gas cloud that trails Enceladus' orbit by several km s−1.
The velocities at which methanol is seen are consistent with a torus model, in particular with molecules spreading outwards from Enceladus' orbit (Farmer, Reference Farmer2009). At the time of observations, Saturn's rings were tilted such that a beam pointed at Enceladus' position passed preferentially through the far-side of the neutral torus and even broader E-ring (3-9 RS). Molecules further out than Enceladus will orbit with slower speeds. If we are observing the far-side of the torus or E-ring, molecular line observations will be redshifted w.r.t. Enceladus as it approaches. This is seen in the observations in Fig. 2. The magnitude of the line-of-sight velocity shift w.r.t. Enceladus can be fitted assuming the molecules are in Keplerian rotation in the ring plane, which was tilted w.r.t. Earth at 7° in 2008. The detected methanol must be at an orbit of ~8 RS to be in the telescope beam, assuming most of the spectral emission was contributed around the time of maximum elongation. However, methanol ejected directly from Enceladus through plumes may only be able to spread by ~3 RS accounting for a methanol photodissociation time at the distance of Saturn (i.e. out to a radius ~7 RS accounting for the distance between Saturn and Enceladus; Huebner et al. Reference Huebner, Keady and Lyon1992). Therefore, the detected methanol would have to be a secondary product of chemical processing within the larger neutral torus in this scenario, as discussed below.
The second possibility is that a compact, confined gas cloud trails Enceladus' orbit by several km s−1. An example of a trailing gas cloud can be seen in a model by Jia et al. (Reference Jia, Russell, Khurana, Ma, Najib and Gombosi2010), which was reconstructed from Cassini flyby measurements of the plasma. In Fig. 3, we show a diagram of Enceladus with the plasma velocities and density contours (based on Fig. 2 in Jia et al. Reference Jia, Russell, Khurana, Ma, Najib and Gombosi2010). The plume emerges from the southern pole of Enceladus (to -Z) and streams along the X-axis, which is in the line-of-sight for our observations. Electrons south of Enceladus' plumes form a denser cloud at length l≲1750 − 2000 km (7–8 REnc) and trail Enceladus by ≲6 km s−1. We have observed CH3OH redshifted by a similar +8.1 km s−1 and over a similar-sized region. However, further modelling and observations are needed to explain the mechanism in which gas would be confined by Saturn's magnetosphere.
Additionally, there is independent evidence of a significant (4σ; see section‘Results’) redshifted molecular component from archival ortho-H2O spectrum taken when Enceladus was at a similar elongation from the Saturn. Since the active plumes are thought to feed the neutral torus in orbit around the Saturn, it is expected that H2O will fill the Herschel telescope beam and be present at both small and large scales surrounding Enceladus. In particular, this redshifted H2O component can result from gas spreading (Farmer, Reference Farmer2009) or the presence of a confined cloud of gas lagging the orbital velocity of both the moon and the co-rotating neutral torus, where the latter process depends on the exact velocity of outgassing material at the time. If either gas spreading or a confined cloud are the causes of the redshifted molecular emission, we do not necessarily expect the H2O and CH3OH observations to be redshifted by the same amount because H2O may be tracing different radii than the CH3OH detection and/or temporal variations observed from the plumes (Hedman et al., Reference Hedman, Gosmeyer, Nicholson, Sotin, Brown, Clark, Baines, Buratti and Showalter2013). Careful monitoring of Enceladus needs to be done in the future to better understand how the plume processes change over time.
Considering that water, hydrogen, oxygen and hydroxyl are abundant in the torus, the rate of methanol production may depend on the availability of methane, which is a ~1.6% CH4:H2O abundance (Waite et al., Reference Waite, Lewis, Magee, Lunine, McKinnon, Glein, Mousis, Young, Brockwell, Westlake, Nguyen, Teolis, Niemann, McNutt, Perry and Ip2009), or other hydrocarbons. Using public astronomical networks (KIDAFootnote 1, UMIST; McElroy et al. Reference McElroy, Walsh, Markwick, Cordiner, Smith and Millar2013), we suggest possible routes to methanol through gas-phase associate detachment:
 $$ \hbox{CH}_3 + \hbox{OH}^{-} \rightarrow \hbox{CH}_3\hbox{OH} + \hbox{e}^{-}. $$
While other routes for the creation of methanol are possible, these involve more complex molecules that are less abundant and may not be present in the plume environments.
Coates et al. (Reference Coates, Jones, Lewis, Wellbrock, Young, Crary, Johnson, Cassidy and Hill2010) find that dissociative electron attachment can produce negative water-group ions (e.g. OH−, O−, H−) in Enceladus' plumes from neutral H2O, where O− and H− are produced by polar photodissociation of H2O by photons in ~36 − 100 eV. While H− has a relatively short photodissociation timescale (~6 s at Saturn; see Huebner et al. Reference Huebner, Keady and Lyon1992), Cordiner & Charnley (Reference Cordiner and Charnley2014) find that H− quickly reactions with H2O to produce OH− + H2 in the comet 1P/Halley environment, where both OH− and O− are abundant within the coma ( ≤ 1000 km from the nucleus). This cometary environment may be similar to Saturn, where Saturn is a soft X-ray source (scattering X-rays from the Sun; Bhardwaj et al. Reference Bhardwaj, Elsner, Randall Gladstone, Cravens, Lisse, Dennerl, Branduardi-Raymont, Wargelin, Hunter Waite, Robertson, Østgaard, Beiersdorfer, Snowden and Karchenko2007) that could form these water-group ions.
While the methyl radical is not directly modelled from the Cassini INMS data (Waite et al., Reference Waite, Combi, Ip, Cravens, McNutt, Kasprzak, Yelle, Luhmann, Niemann, Gell, Magee, Fletcher, Lunine and Tseng2006, Reference Waite, Lewis, Magee, Lunine, McKinnon, Glein, Mousis, Young, Brockwell, Westlake, Nguyen, Teolis, Niemann, McNutt, Perry and Ip2009), it is a key molecule in the production of more complex hydrocarbons (e.g. Titan; Atreya et al. Reference Atreya, Adams, Niemann, Demick-Montelara, Owen, Fulchignoni, Ferri and Wilson2006) and is likely present within Enceladus' plumes or created once material is ejected (Coates et al., Reference Coates, Jones, Lewis, Wellbrock, Young, Crary, Johnson, Cassidy and Hill2010). One possible pathway is through associative attachment from ethylene (CH2) and water-group ions, where traces of ethylene have been noted in the plume environment (Waite & Magee, Reference Waite and Magee2010):
 $$ \hbox{CH}_2 + \hbox{H}^- \rightarrow \hbox{CH}_3 + \hbox{e}^-, $$
Similarly, reactions directly with methane and other molecules abundant in the plume environment can produce the methyl radical. For example, ion-neutral reactions:
 $$ \hbox{CH}_4 + \hbox{O}^- \rightarrow \hbox{CH}_3 + \hbox{OH}^-, $$
 $$ \hbox{CH}_4 + \hbox{H}_2{\rm O}^+ \rightarrow \hbox{CH}_3 + \hbox{H}_3{\rm O}^+, $$
where H2O+ and H3O+ have been found directly (Tokar et al. Reference Tokar, Johnson, Thomsen, Wilson, Young, Crary, Coates, Jones and Paty2009; altitudes ~200 km). Neutral-neutral reactions with methane are also possible with neutral water-group atoms and molecules present in the E-ring environment:
 $$ \hbox{CH}_4 + \hbox{OH} \rightarrow \hbox{H}_2{\rm O} + \hbox{CH}_3, $$
 $$ \hbox{CH}_4 + \hbox{O} \rightarrow \hbox{OH} + \hbox{CH}_3, $$
In all of these proposed scenarios, the plasma density appears to be an integral part of the gas-phase chemical production of CH3OH and enhancement in CH3OH abundance once the plume material is ejected from Enceladus. This further supports the offsets in velocity we see in the CH3OH spectrum and the plasma within 2000 km from the south pole of Enceladus (Jia et al., Reference Jia, Russell, Khurana, Ma, Najib and Gombosi2010), where this material is travelling more slowly than the moon. Plasma densities are found to peak at ~102 cm−3, indicating an electron abundance ≥10−7 w.r.t. modelled H2O (see Table B1), which is similar to electron abundances found in the ISM (w.r.t. H2; Bergin & Tafalla Reference Bergin and Tafalla2007). As stated above, further observations are needed to constrain possible variability in the plume and surrounding environment, which may lead to changes in density, chemical composition and velocity of the ejected material over time.
We note that Hodyss et al. (Reference Hodyss, Parkinson, Johnson, Stern, Goguen, Yung and Kanik2009) find a potential CH3OH ice surface feature, though this can also be interpreted as hydrogen peroxide H2O2 (Newman et al., Reference Newman, Buratti, Jaumann, Bauer and Momary2007). However, the past work has also shown that CH3OH tends to be destroyed in ice pathways, making it less likely that CH3OH is produced from ice on Enceladus' surface (Bergantini et al., Reference Bergantini, Pilling, Nair, Mason and Fraser2014).
Discussion and conclusions
We report on the first ground-based detection of a molecule (CH3OH) in Enceladus' plumes. Radiative transfer models suggest the origin of methanol can be from a cloud with length ranging from 1750 km up to a size comparable with the neutral torus in the orbit around Saturn. There are two possible explanations for producing the redshifted CH3OH and H2O, taking into account the solar photodissociation timescale of CH3OH and the observed redshifted CH3OH emission. First, methanol may be a secondary product of chemical processing within the neutral torus and spread further out into the E-ring to a radius ~8 RS (e.g. Farmer Reference Farmer2009) at velocities smaller than Enceladus' rest-frame velocity (i.e. due to Keplerian rotation). Alternatively, methanol may original from a smaller, beam-diluted region nearer to Enceladus (i.e. l < 2000 km). To further distinguish between these two mechanisms, further modelling and observations are needed.
What is the origin of the methanol cloud surrounding Enceladus? Since methanol is expected to be present in an organic environment (Matson et al., Reference Matson, Castillo, Lunine and Johnson2007), an exciting prospect is that the observed methanol is being produced by living organisms within Enceladus' subsurface ocean. In Earth's oceans, Mincher & Aicher (Reference Mincer and Aicher2016) find that methanol is produced at a rate as high as 0.3% w.r.t. the total cellular carbon. If we assume that methanol production within subsurface oceans on Enceladus is similar to the Earth and all of the carbon measured in Enceladus' vents is expelled by microbes in the subsurface ocean (i.e. C:H2O~5%; Waite et al. Reference Waite, Lewis, Magee, Lunine, McKinnon, Glein, Mousis, Young, Brockwell, Westlake, Nguyen, Teolis, Niemann, McNutt, Perry and Ip2009), then we would expect a CH3OH:H2O abundance within Enceladus' subsurface oceans to be ~0.015% in an organic environment. This result is similar to the CH3OH abundance measured in the direct vicinity of the vents by Cassini at ~0.01% (Waite et al., Reference Waite, Lewis, Magee, Lunine, McKinnon, Glein, Mousis, Young, Brockwell, Westlake, Nguyen, Teolis, Niemann, McNutt, Perry and Ip2009), indicating that it is possible for the CH3OH found in the vents to be a biomarker in an extreme case with the carbon predominantly of biological origin.
In contrast at larger scales, our CH3OH observation suggests that the gas cloud trailing Enceladus has a CH3OH:H2O abundance that is ~50 × higher than in the vents. Therefore, it is likely that methanol is being produced once the material is ejected from the subsurface ocean, making it improbable as a biomarker signature in this particular case. In the future, caution should be taken when reporting on the presence of supposed biomarkers, in both solar system and exoplanet environments. The most robust method for investigating the complex chemistry, particularly in subsurface ocean environments, is obtaining observations close to the vents.
Acknowledgments
ED acknowledges funding from Cardiff University. This work uses observations from project number 220-07 with the IRAM 30 m Telescope. IRAM is supported by INSU/CNRS (France), MPG (Germany) and IGN (Spain). We would like to thank the referee Chris McKay for carefully reading this work. Lastly, members of our team acknowledge the three birthdays lost to this project, for the pursuit of science.
Appendix A. Methods and detection overview
We present an overview of the methods for reducing the CH3OH spectrum and determining the robustness of the CH3OH detection. Noticeable spikes towards the ends of the band were blanked before the baseline was fit and subtracted from the spectrum (Fig. A1). Both the positive and negative response of the CH3OH line can be seen at a velocity separation of 8.6 km s−1 due to frequency-switching (see the section ‘Results’ for more details). The robustness of the detection was investigated by averaging the CH3OH positive and negative response and investigating how likely these features are caused by noise (Fig. A1).

Fig. A1. Top left: Full spectrum from the IRAM 30-m telescope centred on 239.7463 GHz prior to fitting and subtracting the baseline. The spectrum was produced by shifting individual observations in velocity to Enceladus' rest frame and then averaged. Noticeable spikes (in both positive and negative due to frequency-switching) can be seen at velocity channels towards the ends of the band. Top right: Baseline-fitting was done with a 14th-order polynomial (the highest available in SPLAT) over the regions within the green boxes; the stepped parts show where channels are blanked in the spike removal. Bottom left: CH3OH spectrum after despiking and baseline-subtracting. Bottom right: We investigate the significance of both the positive and negative CH3OH response of the full spectrum. On the y-axis, we define the average of the CH3OH positive and negative response  $[\sum {{T}_{\rm A}^\ast (\hbox{line)}} - \sum {{T}_{\rm A}^\ast }(\hbox{inverse})]/2$ [i.e. (the sum of antenna temperature T*A over seven contiguous velocity channels minus the same sum over velocity channels that are 8.63 km s−1 lower) / 2]. The red point denotes the peak of the CH3OH line at +8 km s−1. Black points denote the same calculation for other velocity bins, excluding channels where the calculation would involve part of the bandwidth with spikes, or (for clarity) the line or its negative response. Hence, these black points show the statistics for a potentially false line due to noise. The dotted blue lines show the mean ±3σ bounds derived from all of the plotted points. We find the red point denoting the average CH3OH line and negative response to be the only point that is significant (at the 5σ level).
Appendix B. Full RADEX parameter space
RADEX is a one-dimensional non-LTE radiative transfer code that assumes isothermal and homogenous medium without large-scale velocity fields using the escape probability method (i.e. the probability a photon will break out of the surrounding medium). The program is iterative, finding a solution for the level populations and calculating the radiation temperature T R using the following method:
1. Input parameters are: molecular data file from LAMDA (Schöier et al. Reference Schöier, van der Tak, van Dishoeck and Black2005, which include term energies, statistical weights, Einstein coefficients and rate coefficients for collisional de-excitation), frequency range of the transition, kinetic temperature of the region, number of collision partners (typically H2 as the only collision partner, which has been scaled so that H2O is the collisional partner for our models), H2O density, temperature of the background radiation field, column density of the molecule being modelled and FWHM line width.
2. An initial estimate of the level populations is made by assuming optically thin emission and statistical equilibrium considering the background radiation field (typically 2.73 K blackbody representing the cosmic microwave background or CMB).
3. The optical depths are then calculated for the molecular line.
4. The program iteratively continues to calculate new level populations with new optical depth values until both converge on a consistent solution.
5. The program outputs are: background-subtracted molecular line intensities, excitation temperature and optical depth.
The full parameter space of the RADEX models that fit the CH3OH observation can be found in Table B1.
Table B.1. RADEX model parameter space for varying cloud lengths.


