


Introduction
The question of whether Mars ever hosted life remains unanswered. Theoretically, various kinds of metabolisms could have been supported there (Stamenković et al., Reference Stamenković, Ward, Mischna and Fischer2018), especially in the Noachian when conditions were supposedly more favourable to life. If life ever evolved on Mars, nowadays it could still develop underground, given the harsh irradiation conditions on the surface (Cockell, Reference Cockell2014). The upcoming missions to Mars aim to detect traces of extant or recently extinct life, namely biomarkers. A biomarker definition is still under development and debate; but it should be considered as a fingerprint of past or present biological activity (McMahon, Reference McMahon2021) and thus, be strictly biogenic (not found in the abiotic organics in nature). Indeed, it should be an integral component of any water-based life form, and should possess universal chemical and physical properties required for any form of life as we know it. Diverse organic biomarkers have been classified based on the biological features that belong to all known life forms on Earth, such as a compartmentalized shape, energy-producing and storage mechanisms, and the use of biomolecules to store hereditary information (Parnell et al., Reference Parnell, Cullen, Sims, Bowden, Cockell, Court and Rohmer2007; Summons et al., Reference Summons, Albrecht, McDonald and Moldowan2008). These biomarkers are made of simple monomers that constitute the building blocks of cells, such as amino acids, sugars, pigments and lipids, as well as more complex biopolymers such as nucleic acids. A critical consideration in biomarker detection is the compound's resiliency. For example, the persistence of possible biomarkers on the surface of Mars could be affected by the current hostile environmental conditions, such as the unshielded flux of UV and ionizing radiation (Dartnell et al., Reference Dartnell, Desorgher, Ward and Coates2007, Reference Dartnell, Page, Jorge-Villar, Wright, Munshi, Scowen and Edwards2012a) and strongly oxidizing conditions.
In this framework and with the aim of achieving a list of biomarkers to serve as reference in the ExoMars mission, the BIOlogy and Mars EXperiment (BIOMEX) has exposed for 16 months extremophiles and molecules outside the ISS (de Vera et al., Reference de Vera, Alawi, Backhaus, Baqué, Billi, Böttger and de la Torre Noetzel2019) to investigate their resistance and stability. Among them, the cryptoendolithic fungus Cryomyces antarcticus, living in the McMurdo Dry Valleys rocks, Antarctica, is a relevant test organism (Onofri et al., Reference Onofri, Selbmann, Pacelli, Zucconi, Rabbow and de Vera2019). Endolithic black fungi find refuge in the rock's subsurface, where they receive protection from the extreme conditions on the surface, and it has been speculated that a hypothetical form of life may have adopted the same strategy on Mars (Friedmann, Reference Friedmann1986). Here, colonies of C. antarcticus were grown on two Martian rock-analogues: the Phyllosilicatic Mars Regolith Simulant (P-MRS) that resembles altered igneous rocks to clays and the Sulfatic Mars Regolith Simulant (S-MRS) mimicking a more acidic environment with sulphate deposits. Samples were grown also on the original substrate (OS), the Antarctic sandstone, as a comparison. Once grown, colonies were dried and exposed outside the ISS onboard the exposure facility EXPOSE-R2 (Fig. 1(a)). During the mission, samples in Tray 1 (space vacuum and solar radiation, from λ ≈ 110 nm) and Tray 2 (Mars-like UV flux, λ > 200 nm and Mars-like atmosphere) received total UV (200–400 nm) fluencies of about 2.73–3.26 × 10² and 3.13–3.63 × 10² kJ m−2, respectively, and 0.5 Gy of cosmic ionizing radiation (Rabbow et al., Reference Rabbow, Rettberg, Parpart, Panitz, Schulte, Molter and Willnecker2017). Samples in Tray 1 were the ones grown on the OS, samples in Tray 2 were the ones grown on P-MRS and S-MRS analogues (Fig. 1(b)).
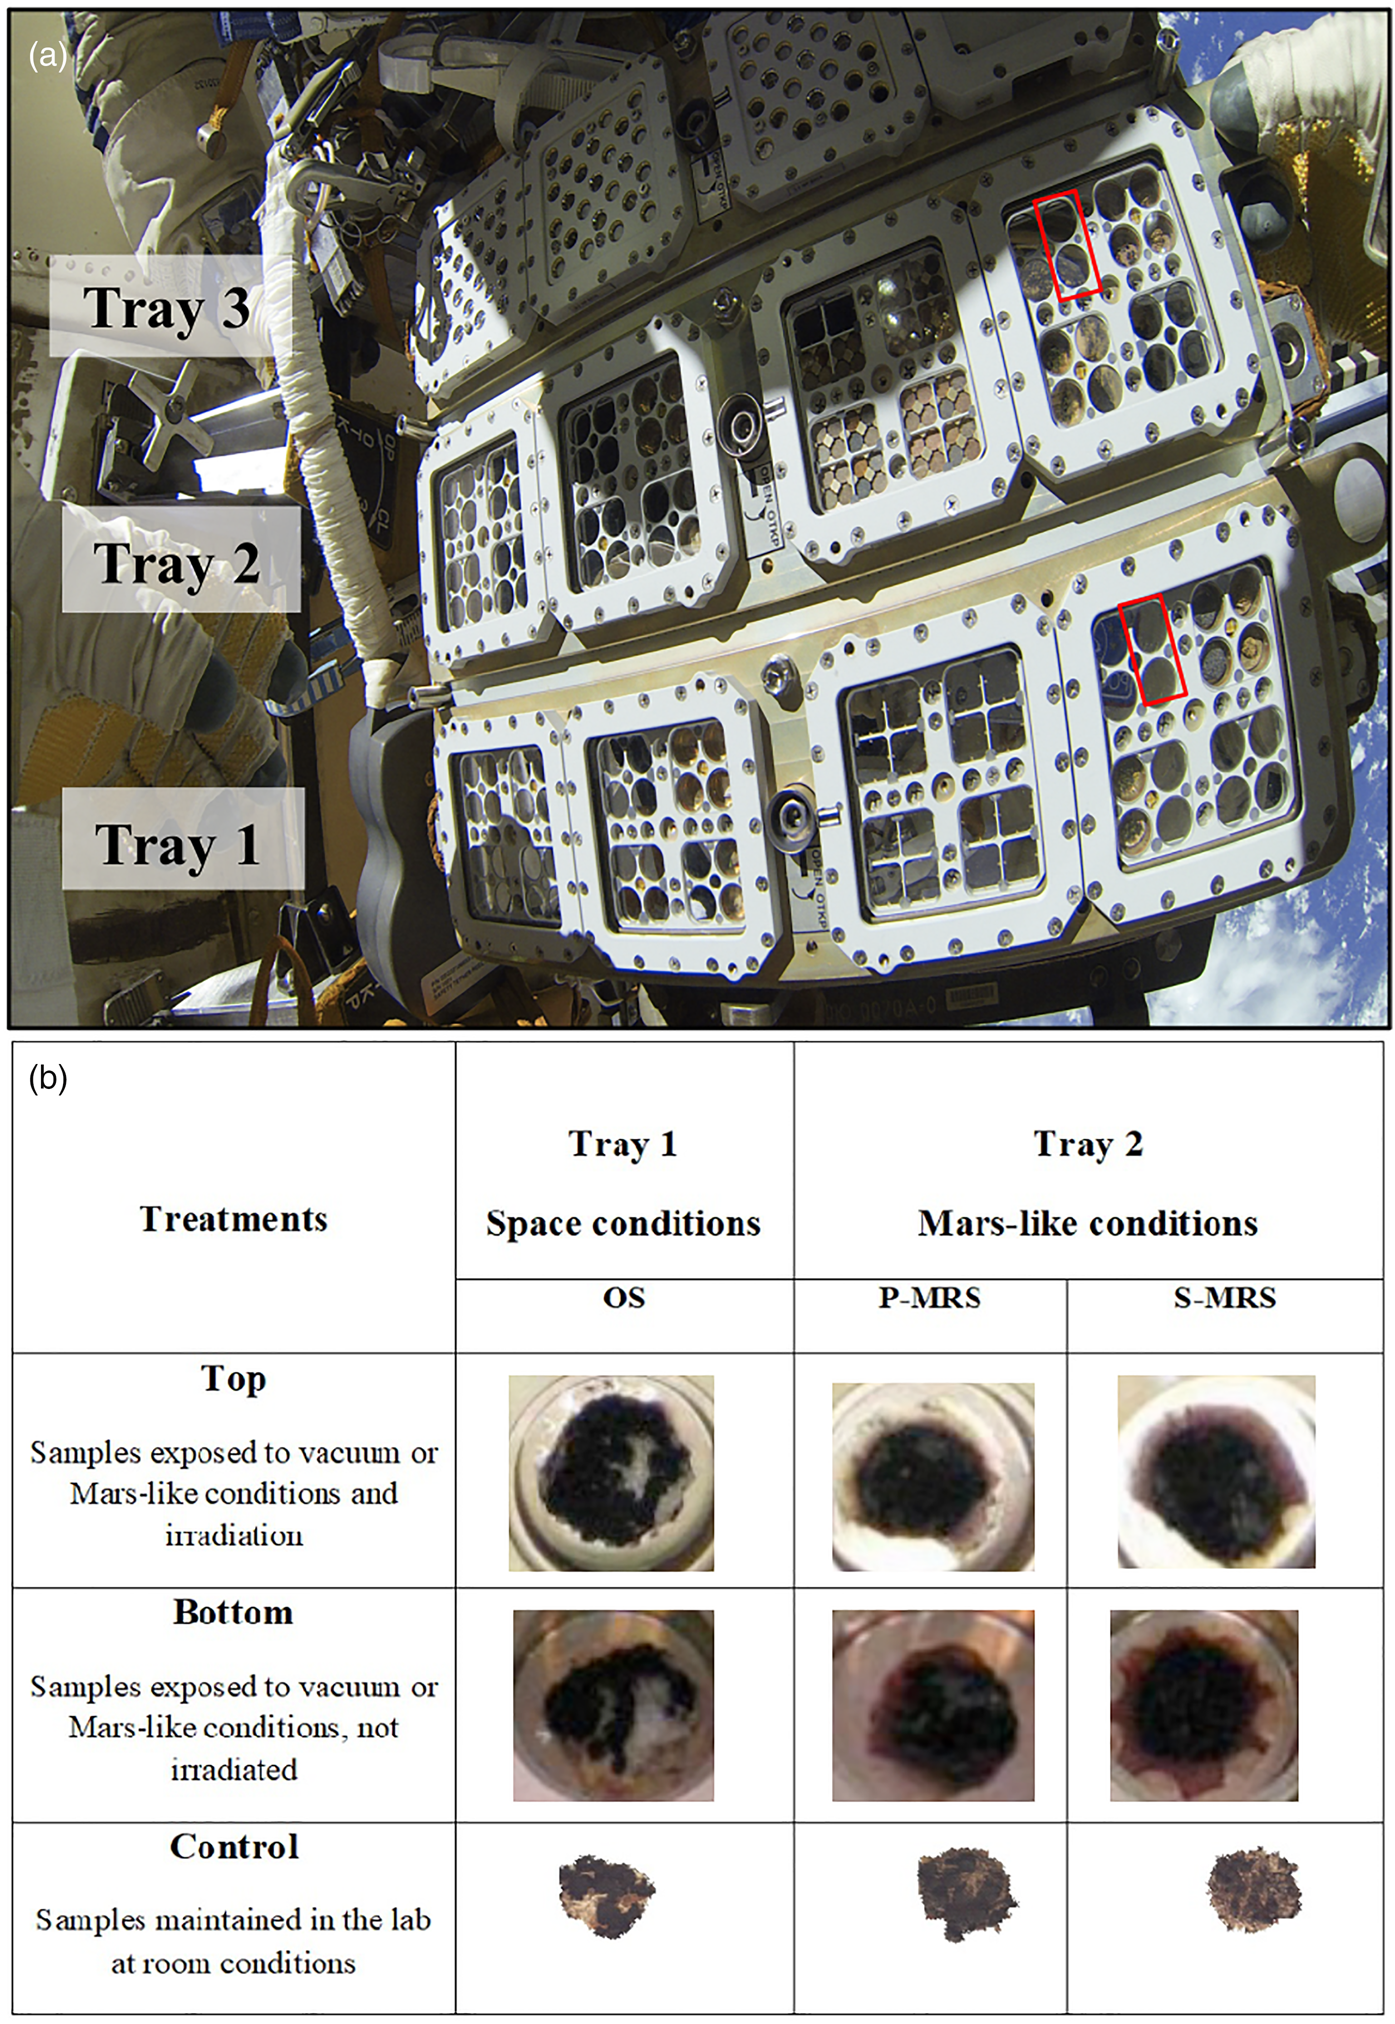
Fig. 1. Exposure setup. (a) EXPOSE-R2 facility during exposure outside the ISS, red squares indicate C. antarcticus samples accommodation. (b) Set of samples: for each sample (OS, original substrate; P-MRS, Phyllosilicatic Mars Regolith Simulant; S-MRS, Sulfatic Mars Regolith Simulant), one disk was exposed in the Top and one in the Bottom position of the two-layer sample carrier. In the top-layer carrier of Tray 1, samples were exposed to space condition and UV irradiation (Top samples), in the bottom layer to space condition only (Bottom samples, dark in-flight control). In the top-layer carrier of Tray 2, samples were exposed to a Mars-like UV flux and Mars-like atmosphere (Top samples); in the bottom-layer carrier only to Mars-like atmosphere (Bottom samples, dark in-flight control). A set of control samples was kept in the laboratory in the dark and at room temperature (control samples). All samples were dried before the exposure. All details for exposure conditions are reported in ‘Exposure conditions aboard the ISS’ section. Photo credits: (a) Cosmonauts Maksim Surayev and Aleksandr Samokutyaev, (b) Elke Rabbow.
We studied three treatments: (i) samples exposed to the whole conditions experienced in space (OS) or Mars-like (P-MRS and S-MRS), including UV radiation (Top), (ii) samples maintained in darkness (shielded from UV radiation, Bottom) and (iii) samples maintained in the laboratory at room conditions (Control) (detailed description in the section ‘Exposure conditions aboard the ISS’). By using instruments analogous to those carried by Perseverance and Rosalind Franklin rovers (Raman and infrared spectroscopy and gas chromatography-mass spectrometry (GC-MS)), we determined if fungal molecules are stable and can be detected in samples similar to those that would be explored by the rovers in the near future. Our goals were to optimize the detection of fungal biomarkers after exposure to simulate the detection of possible traces of life on Mars, as well as to highlight some current limitations and challenges of analytical techniques used in life detection missions.
Materials and methods
Test organism
The test organism used in the experiment is the cryptoendolithic black yeast-like fungus C. antarcticus MNA-CCFEE (Italian National Antarctic Museum's Culture Collection of Fungi from Extreme Environment) 515 that was isolated by R. Ocampo-Friedmann from sandstone collected at Linnaeus Terrace in the Antarctic McMurdo Dry Valleys (Southern Victoria Land) by H. Vishniac, in the expedition 1980–1981 (Selbmann et al., Reference Selbmann, De Hoog, Mazzaglia, Friedmann and Onofri2005). The fungus was grown on OS (sandstone) and Mars Regolith Simulants (MRS). Substrata were prepared as follow: 2% of Malt Extract Agar (MEA) was mixed with 1.5 g of Antarctic sandstones, 1 g of P-MRS or S-MRS analogues, as described in the following section (‘Mars analogues composition and preparation’). After growth, each substratum with fungal colonies was de-hydrated under sterile conditions and then cut in a 12 mm-diameter disk to fit within the wells of exposure facility.
Mars analogues composition and preparation
Two MRS were used as reported in de Vera et al. (Reference de Vera, Boettger, de la Torre Noetzel, Sánchez, Grunow, Schmitz and Rettberg2012): two specific Martian mineral analogue mixtures were developed in the frame of the BIOMEX project to simulate early acidic and late basic Mars surface lithosphere composition. The MRS composition was developed and produced by the Naturkundemuseum Berlin according to the data of Mars missions (McCollom and Hynek, Reference McCollom and Hynek2005; Bibring et al., Reference Bibring, Langevin, Mustard, Poulet, Arvidson, Gendrin and Berthe2006; Chevrier et al., Reference Chevrier, Poulet and Bibring2007). The use of two different mixtures derives from the observation that phyllosilicate deposits do not occur together with sulphate deposits (Poulet et al., Reference Poulet, Bibring, Mustard, Gendrin, Mangold, Langevin and Gomez2005). Both mixtures are composed of igneous rocks with a mineral composition similar to those of Martian meteorites (composed mainly of pyroxene and plagioclase (gabbro), and olivine). Quartz and anhydrous iron oxide hematite (Fe2O3) were added to both mixtures (Böttger et al., Reference Böttger, de Vera, Fritz, Weber, Hübers and Schulze-Makuch2012). The phyllosilicatic MRS resembles igneous rocks altered by pH neutral hydrous fluids to clays of the smectite group, including montmorillonite [(Na,Ca)0.3(Al, Mg)2Si4O10(OH)2 + H2O] and chamosite [(Fe2+,Mg,Fe3+)5Al(Si3Al)O10(OH,O)8] (Poulet et al., Reference Poulet, Bibring, Mustard, Gendrin, Mangold, Langevin and Gomez2005), and the clay mineral kaolinite [Al2Si2O5(OH)4] (Mustard et al., Reference Mustard, Ehlmann, Murchie, Poulet, Mangold, Head and Roach2009). Siderite [FeCO3] and hydromagnesite [Mg5(CO3)4(OH)2 + 4H2O] are included to account for carbonates formed by either precipitation or interaction between a primitive CO2-rich atmosphere/hydrosphere and the basaltic subsurface rocks (Chevrier and Mathé, Reference Chevrier and Mathé2007; Morris et al., Reference Morris, Ruff, Gellert, Ming, Arvidson, Clark and Fleischer2010). The sulfatic S-MRS serves as an analogue for a more acidic environment with sulphate deposits: it includes igneous rocks, anhydrous iron oxides, goethite [a-FeOOH] and gypsum [CaSO4 + 2H2O]. Minerals were mechanically crushed and only fragments smaller than 1 mm were used for the mineral mixtures (Böttger et al., Reference Böttger, de Vera, Fritz, Weber, Hübers and Schulze-Makuch2012). In comparison, the original substratum of the fungus, namely sandstone (composed mainly of quartz) from Beacon Valley in Antarctica, was used.
Exposure conditions aboard the ISS
Samples, in the EXPOSE-R2 facility (Fig. 1(a) and (b)), were exposed to different conditions:
• to space condition for 16 months outside the International Space Station, in two layers on the Top (exposed to sunlight with 0.1% Neutral Density filters) and Bottom (dark control in space) positions of the two-layer stacked sample carrier of EXPOSE-R2 (Fig. 1(a)).
• Tray 1 (Space conditions) was used to expose samples grown on OS to space vacuum (ranging from 1.33 × 10⁻³ to 1.33 × 10⁻⁴ Pa), while Tray 2 (Mars-like conditions), to expose samples grown on P-MRS and S-MRS to Mars-like gas mixture composed of 95.55% CO2, 2.70% N2, 1.60% Ar, 0.15% O2, ~370 ppm H2O, at a pressure of 980 Pa. Samples in Tray 1 were exposed to solar UV spectrum >110 nm below MgF2 windows; a Mars-like spectrum >200 nm for Tray 2 samples was achieved by respective cut-off filters (Fig. 1(a)).
Timing and conditions of space exposure
Four identical sample sets were subjected to different environmental conditions:
-
Set 1 was exposed to space vacuum and full-spectrum solar light (OS Top),
-
Set 2 was exposed to space vacuum but shielded against the Sun (OS Bottom),
-
Set 3 was kept in a Mars-like atmosphere and solar wavelength spectrum (P-MRS and S-MRS Top),
-
Set 4 was kept in a Mars-like atmosphere but shielded against the Sun (P-MRS and S-MRS Bottom).
Pressure
Sets 1 and 2 were placed in the same sample compartment and therefore shared the same pressure history. Before launch, their compartment was filled with nitrogen at 105 Pa ( = 1 atm = 760 mm Hg). Once the EXPOSE facility was deployed outside the ISS, this compartment was evacuated by the opening of a valve. The pressure dropped down to near-vacuum, which ranged between 1.33 × 10⁻³ and 1.33 × 10⁻⁴ Pa. The valve was closed again before EXPOSE was moved back into the ISS, leaving the near-vacuum intact until the samples were removed after landing. Sets 3 and 4 were placed in the same sample compartment and therefore shared the same pressure history. Before launch, this compartment was filled with ‘Martian air’ at 980 Pa. Mars-like pressure was retained until the samples were removed after landing.
Solar irradiation
Set 1 was covered by an optical window made of MgF2 (transmission: λ > 110 nm), and a 0.1% Neutral Density filter. The total solar dose received by Set 1 ranged between 4750 and 5450 kJ m−2. Set 2, sharing the same sample compartment, was maintained in darkness for reference.
Set 3 was covered by a window made of quartz (transmission: λ > 170 nm), a cut-off filter (transmission: λ > 200 nm) to approach the solar wavelength spectrum at the surface of Mars, and a 0.1% Neutral Density filter. The total solar dose received by Set 3 ranged between 4260 and 4750 kJ m−2. Set 4, sharing the same sample compartment, was maintained in darkness for reference.
Temperature
Sets 1, 2, 3 and 4 experienced a similar temperature history. The highest recorded temperature was +47 °C, the lowest −15.0 °C, and the average +18.5 °C (Rabbow et al., Reference Rabbow, Rettberg, Parpart, Panitz, Schulte, Molter and Willnecker2017). The strong temperature variations were caused by the constantly changing attitude of the orbiting EXPOSE facility towards the Sun.
Cosmic radiation
The total mission dose of the BIOMEX samples was 200–230 mGy. With a mission duration of 696 days, this translated into a daily dose of 290–330 μGy. Inside the ISS (the Columbus module), daily doses of 210–300 μGy were measured. The similarity of the radiation doses recorded outside the ISS (in Expose) and inside (in Columbus) is due to the fact that EXPOSE provided its samples with ≥2.2 g cm−2 of mass shielding by its metal structure, windows and optical filters. This was enough to stop the low-energy cosmic particles, i.e. electrons and most of the protons (Berger et al., Reference Berger, Bilski, Hajek, Puchalska and Reitz2013).
Mission timeline
BIOMEX spent 696 days in space (from launch until landing), 531 of them externally exposed.
12.06.2014 Sample integration completed at MUSC/DLR, Cologne
23.07.2014 Launch
20.08.2014 EXPOSE placed outside the ISS; evacuation of Sets 1 and 2
22.10.2014 Sun shield removed; start of solar exposure Sets 1 and 3
03.02.2016 EXPOSE moved back into the ISS
18.06.2016 Landing
24.06.2016 Sample de-integration at MUSC/DLR, Cologne
Raman spectroscopy analyses
Raman spectroscopy was performed at the German Aerospace Center (DLR) in Berlin, using a 532 nm excitation laser, with a WITec alpha300 Confocal Raman microscope, at room temperature, under ambient atmospheric conditions. The spectral resolution of the spectrometer is 4–5 cm−1, a Nikon 10× objective with a 0.25 numerical aperture was used to focus the laser on a 1.5 μm spot. Before the analyses, a spectral calibration was performed with a pure silicon and paracetamol test samples. For single spectra, all measurements were performed at 0.1 mW laser power with 10 s integration and 50 accumulation. Image scans were done at 0.7 mW with 1 s and 1 accumulation (to avoid signal saturation or damaging effects) on three distinct areas up to 100 μm × 100 μm and up to 500 image points, thus collecting a minimum of 1000 measurements per sample. The optimization of Raman measurements is of utmost importance for the discernibility of melanin and amorphous carbon spectra. Therefore, to avoid melanin degradation and thus noticeable shifts in band positions at higher laser powers, the laser power was kept below 0.7 mW with 1 s integration time and 1 s accumulation for image scans, and 0.1 mW with 10 s integration time and 50 accumulations for single spectra acquisitions. All data analyses were performed with the WITec Project FOUR software. Parameters used for analysis were the value of signal coverage, to show the presence/absence of the signal, and the value of signal to noise ratio (SNR), defined as spectra having SNR > 5. To analyse the presence of the signal, the region of interest (between 200 and 2000 cm−1) was cropped, then a fifth order polynomial function was applied for background subtraction, and finally SNR masks were applied. The SNR is defined here as the height of the 1600 cm−1 band divided by the noise represented as the standard deviation of the spectral region (1750–1950 cm−1), as previously applied to carotenoids in Baqué et al. (Reference Baqué, Hanke, Böttger, Leya, Moeller and de Vera2018). The typical Raman signal expected from C. antarcticus consists of two main melanin bands with a higher intensity band that is located in the region 1590–1605 cm−1 and a second band around 1350 cm−1. Since the exact pigment composition of the fungus is not completely defined (Pacelli et al., Reference Pacelli, Cassaro, Maturilli, Timperio, Gevi, Cavalazzi and Onofri2020), we compared the fungus Raman spectra with the spectra of two synthetic melanins: DOPA (3,4-DiOxyPhenylAlanine) and DHN-melanin (1,8-DiHydroxyNaphthalene), which were bought at Sigma-Aldrich and Thermo-Fisher Scientific, respectively. Detailed description of two synthetic melanins used as control is reported in Supplementary Section 1 ‘Material and Methods’. As additional comparison, the spectra acquired from colonies were compared with the spectrum of melanin extracted from the fungus.
Melanin was extracted from dried colonies of C. antarcticus, optimizing the protocol reported by Rosas et al. (Reference Rosas, Nosanchuk, Gómez, Edens, Henson and Casadevall2000). Fungal cells were collected by centrifugation at 16 100 rcf for 20 min, washed with phosphate-buffered saline (PBS) (pH 7.4). Cells were suspended in 20 μl of a buffer composed of 0.25 μl of Trichoderma harzianum (Sigma #L1412), 50 μl of 0.2 M sodium citrate (pH 5.5), 15 μl of 0.2 M citric acid and 18.2 g of sorbitol, up to the final volume of 500 μl.
Samples were incubated overnight at 30 °C, shaken at 50 rpm; samples were washed with PBS two times and collected by centrifugation (10 min at 16 100 rcf). The supernatant was removed by adding 1 ml of 4 M guanidine thiocyanate (VWR International s.r.l.) and samples were incubated overnight on a stirrer. Samples were washed with PBS and centrifuged for 15 min at 16 100 rcf for two times. In total, 1 mg ml−1 of Proteinase K, previously dissolved in the reaction buffer (4 μl of TRIS HCl, 1 μl of CaCl2 and 1 ml of SDS, up to the final volume of 20 ml) was added to the samples; they were incubated at 37 °C for 4 h and then centrifuged for 5 min at 16 100 rcf. Samples were washed two times by adding 1 ml of PBS 4×, and three times by adding 1 ml of chloroform.
In total, 2 ml of HCl 6 M were added to the samples and they were boiled for 1 h. Samples were transferred in dialysis membrane (SnakeSkin Dialysis Tubing, 3.5 K MWCO-Thermo Scientific, Waltham, MA, USA) in sterile water for 3 days, changing the water every day. Finally, samples were lyophilized overnight with the Lyophilizer FreeZone 2.5 Liter Freeze Dry Systems, LabConco and then used for the analyses.
Fourier-transform infrared spectroscopy
Mid infrared spectra were obtained with an infrared spectrometer Bruker Vertex80V, at the Planetary Emissivity Laboratory (DLR), Berlin at room temperature, operating under vacuum conditions to remove atmospheric features from the spectra. Reflectance measurements (showed as transmittance units), performed on fungal colonies grown on each medium mixed with the respective regolith analogue after exposure, were obtained over a spectral range of 600–4000 cm−1 at a resolution of 4 cm−1. Smoothing and Fourier self-deconvolution were used to make the spectra. To enhance those specific absorptions and enable better comparisons and interpretations, quadratic polynomials were used to baseline these spectra in those ranges. Three analyses were performed for each sample. Band assignments were performed with 5% of threshold and 2 of prominence.
Lipid extraction and fractionation and gas chromatography-mass spectrometry analysis
Solvents and reagents for the extraction and fractionation and for GC-MS analysis were purchased from Sigma Aldrich. GC-MS was recorded on a Varian 410 GC-320 MS (Palo Alto, CA, USA) using a VF-5 ms column (30 m, 0.25 mm, 0.25 m), and an electron beam of 70 eV. All experiments were performed in triplicate.
The fungal colonies grown on each medium mixed with the respective regolith analogue after exposure were grinded in agate mortar and then suspended in 2 ml of ethyl acetate. The mixture was left 4 h under magnetical stirring at room temperature. After this time, the suspension was filtered through celite to remove the solid and the solution obtained was concentrated under reduced pressure obtaining a mixture. The mixture obtained with the extraction and fractionation processes was analysed by GC-MS after silylation with N,N-bis-trimethylsilyl trifluoroacetamide in pyridine (620 μl) at 60 °C for 4 h and addition of a betulinic acid [3β-hydroxy-20(29)-lupaene-oic acid] internal standard (0.2 mg). Mass spectrometry was performed through the following program: injection temperature 280 °C, detector temperature 280 °C, gradient 100 °C for 2 min and 10 °C min−1 for 60 min. To identify the structure of the products, two strategies were followed. First, the spectra were compared with commercially available electron mass spectra libraries such as NIST (Fison, Manchester, UK). Second, GC-MS analysis was repeated with standard compounds. All products were recognized with a similarity index >98% compared with that of the reference standards. The analysis was limited to products of >1 ng ml−1, and the yield was calculated as micrograms of isolated products. Mass-charge ratio (m/z) values and the abundance of mass spectra peaks of compounds identified are shown in Table S1 (Supplementary Section 2 ‘Results’).
Nucleic acids extraction and quantitative PCR
DNA was extracted from colonies, using Nucleospin Plant kit (Macherey-Nagel, Düren, Germany) following the protocol optimized for black fungi as reported in Selbmann et al. (Reference Selbmann, De Hoog, Mazzaglia, Friedmann and Onofri2005). Before amplification, DNA was quantified using QUBIT system and diluted at the same concentration (0.1 ng μl−1).
Two different target genes were amplified with quantitative polymerase chain reaction (qPCR) approach to investigate the differences in acid nucleic detection: a small but non-repeated fragment in the genome (β-actin gene of 330 bp) and a long-repeated fragment (LSU gene of 939 bp). qPCR was performed with a BioRad CFX96 real-time PCR detection system (BioRad, Hercules, CA, USA) using primers targeting the fungal LSU rRNA gene and the β-actin gene: LR0R [ACCCGCTGAACTTAAGC (Cubeta et al., Reference Cubeta, Echandi, Abernethy and Vilgalys1991)] and LR5 [TCCTGAGGGAAACTTC (Vilgalys and Hester, Reference Vilgalys and Hester1990)], and ACT512-F (ATGTGCAAGGCCGGTTTCGC) and ACT783-R (TACGAGTCCTTCTGGCCCAT) (Carbone and Kohn, Reference Carbone and Kohn1999) respectively, each at 5 pmol final concentration.
The primers LR0R and LR5 were used to amplify a 939 bp product spanning the LSU region of rRNA encoding genes. The standard qPCR cycling protocol, consisting of a denaturation step at 94 °C for 5 min, followed by 35 cycles of denaturing at 94 °C for 45 s, annealing at 52 °C for 30 s and elongation steps at 72 °C for 2 min, was performed.
The primers ACT512-F and ACT783-R were used to amplify a 330 bp product. The standard qPCR cycling protocol, consisting of a denaturation step at 95 °C for 10 min, followed by 35 cycles of denaturing at 95 °C for 15 s, annealing at 61 °C for 20 s and elongation steps at 72 °C for 15 s, was performed. Fluorescence measurements were recorded at the end of each annealing step. After 35 cycles, a melt curve analysis was performed by recording changes in fluorescence as a function of raising the temperature from 60 to 90 °C in 0.5 °C per increments. All tests were performed in triplicate.
For multiple data points, the calculation of the mean and standard deviations was performed. Statistical analyses were performed by one-way analysis of variance (ANOVA) and pair wise multiple comparison procedure (t test), carried out using the statistical software SigmaStat 2.0 (Jandel, USA).
Results
Raman spectroscopy analyses
Raman spectroscopy is one of the analytical techniques in future missions potentially capable of detecting traces of life on Mars. Nevertheless, what is the potential of a Raman spectrometer to detect microbial life signatures in Martian rock-analogues? Specifically, in our case, which are the main spectral features from C. antarcticus, and are they stable after 16 months of space exposure? Raman mapping was performed on colonies of C. antarcticus that have been exposed for 16 months to space and Mars-like conditions. Raman spectra of the substrata identified component minerals (Fig. S1; Supplementary Section 2 ‘Results’).
Pigments detection by Raman spectroscopy
The main spectra acquired from fungal colonies correspond to the melanin spectrum. According to Culka et al. (Reference Culka, Jehlička, Ascaso, Artieda, Casero and Wierzchos2017), the melanin signature consists of two broad bands that can be clearly distinguished: a higher intensity band in the region 1590–1605 cm−1 and a second lower intensity band around 1340 cm−1. Recently, it has been demonstrated that C. antarcticus possesses a mixture of two different melanins, L-DOPA and DHN (Pacelli et al., Reference Pacelli, Cassaro, Maturilli, Timperio, Gevi, Cavalazzi and Onofri2020). Therefore, we compared the Raman spectra of the fungal colony (Fig. 2, black line), with the spectra of two synthetic melanins, L-DOPA and DHN (Fig. 2, blue and red lines, respectively). In addition, the spectrum of melanin extracted from the fungal colonies was used as a reference (Fig. 2, green line).

Fig. 2. Raman spectra of the melanin extracted from the fungus (green line), fungal colony (black line), compared with the spectra of two synthetic melanins: L-DOPA and DHN melanins (blue and red line, respectively). Amorphous carbon spectrum from P-MRS analogues was reported as comparison (turquoise line).
Melanin pigments versus amorphous carbon detection
It was an open question whether melanin detected by Raman spectroscopy can be accounted as a biomarker due to its high similarity with the amorphous carbon spectrum. Indeed, the presence of amorphous carbon in the P-MRS analogue (Böttger et al., Reference Böttger, de Vera, Fritz, Weber, Hübers and Schulze-Makuch2012) represents a challenge for the unambiguous detection of melanin, as demonstrated by the recorded spectrum of amorphous carbon in P-MRS (Fig. 2, turquoise line). However, we pointed out that the melanin and amorphous carbon spectra are different: (i) the positions of the D (‘disorder’ or ‘defect’) and G (graphite) bands of amorphous carbon differ from the recorded melanin spectra with a higher shift for each feature (1350 cm−1 for D and 1612 cm−1 for G, see Fig. 2), and (ii) an additional band around 1457 cm−1 was found only in the spectra from the fungal colony and the extracted melanin, highlighted by a grey box in Fig. 2. In addition, the band around 1600 cm−1 in the amorphous carbon in P-MRS is shifted and thinner than the broader bands shown in the melanin spectra, as similarly reported in Ferrari et al. (Reference Ferrari, Rodil and Robertson2003). The optimization of Raman measurements is of utmost importance for the discernibility of melanin and amorphous carbon spectra.
Raman analyses interpretation
As previously applied to the preservation of carotenoids in cyanobacteria (Baqué et al., Reference Baqué, Hanke, Böttger, Leya, Moeller and de Vera2018), we defined the signal coverage as a criterion for quantifying the melanin in the exposed samples. In Fig. S2 (Supplementary Section 2 ‘Results’), we defined the SNR for the melanin spectra as the height of the 1604 cm−1 band divided by the noise represented as the standard deviation of the spectral region 1750–1950 cm−1 near the Raman bands. SNR intensity masks were then derived for each image scan containing 400 spectra on a 100 × 100 μm area, as shown in Fig. S2B (Supplementary Section 2 ‘Results’). The band positions were recorded for each measurement series and did not vary significantly for Top, Bottom and Control samples (1603–1604 cm−1), regardless of the substratum (Fig. S3; Supplementary Section 2 ‘Results’). The presence of signal, expressed as signal coverage for the image scans, was then defined by a mask with an SNR superior to 5 and was considered as 100% for the control of each substratum (Fig. 3). No significant differences were recorded between the exposure conditions (Top, Bottom, and Control): melanin spectra were present at the same level as non-exposed controls even on Top samples (Fig. 3(a)). Exposure to Mars-like conditions on the P-MRS and S-MRS analogues (Tray 2) did not show a significant difference either between the controls and the exposed samples. However, a higher and more heterogeneous fluorescent background was recorded around the melanin bands (1607 cm−1) in the presence of the P-MRS analogue, as shown in Fig. 3(b). The presence of fluorescence was already highlighted in the preparation and first characterization of the P-MRS analogue by Raman spectroscopy (Böttger et al., Reference Böttger, de Vera, Fritz, Weber, Hübers and Schulze-Makuch2012) and it is shown here to be more problematic when exposed to simulated Martian conditions in space, either in Top or Bottom samples. Single spectra recorded on three different spots on each sample all showed the unequivocal presence of the melanin signal in all tested conditions (Top, Bottom and Control) for each substratum (Fig. 4(a)–(c)). The two main bands recorded on fungal colonies, synthetic melanins and extracted melanin at around 1340 and 1604 cm−1, as well as the additional band around 1457 cm−1 found only on fungal colonies and extracted melanin, could be identified. As stated above, only the spectra recorded in the presence of the P-MRS analogue proved to be altered due to the higher fluorescent background (Fig. 3(b)). No changes were recorded in the melanin spectra related to the different conditions of exposure (Fig. 4(a)–(c)). To further confirm the presence of unaltered melanin fingerprint in all experimental conditions, we reported in Fig. S3 a histogram with the bands position, showing no differences among all tested samples. The highest recorded shift for the ~1600 cm−1 melanin band was 1605 cm−1 which is significantly lower than the G band of amorphous carbon given our instrument resolution (1612 cm−1).
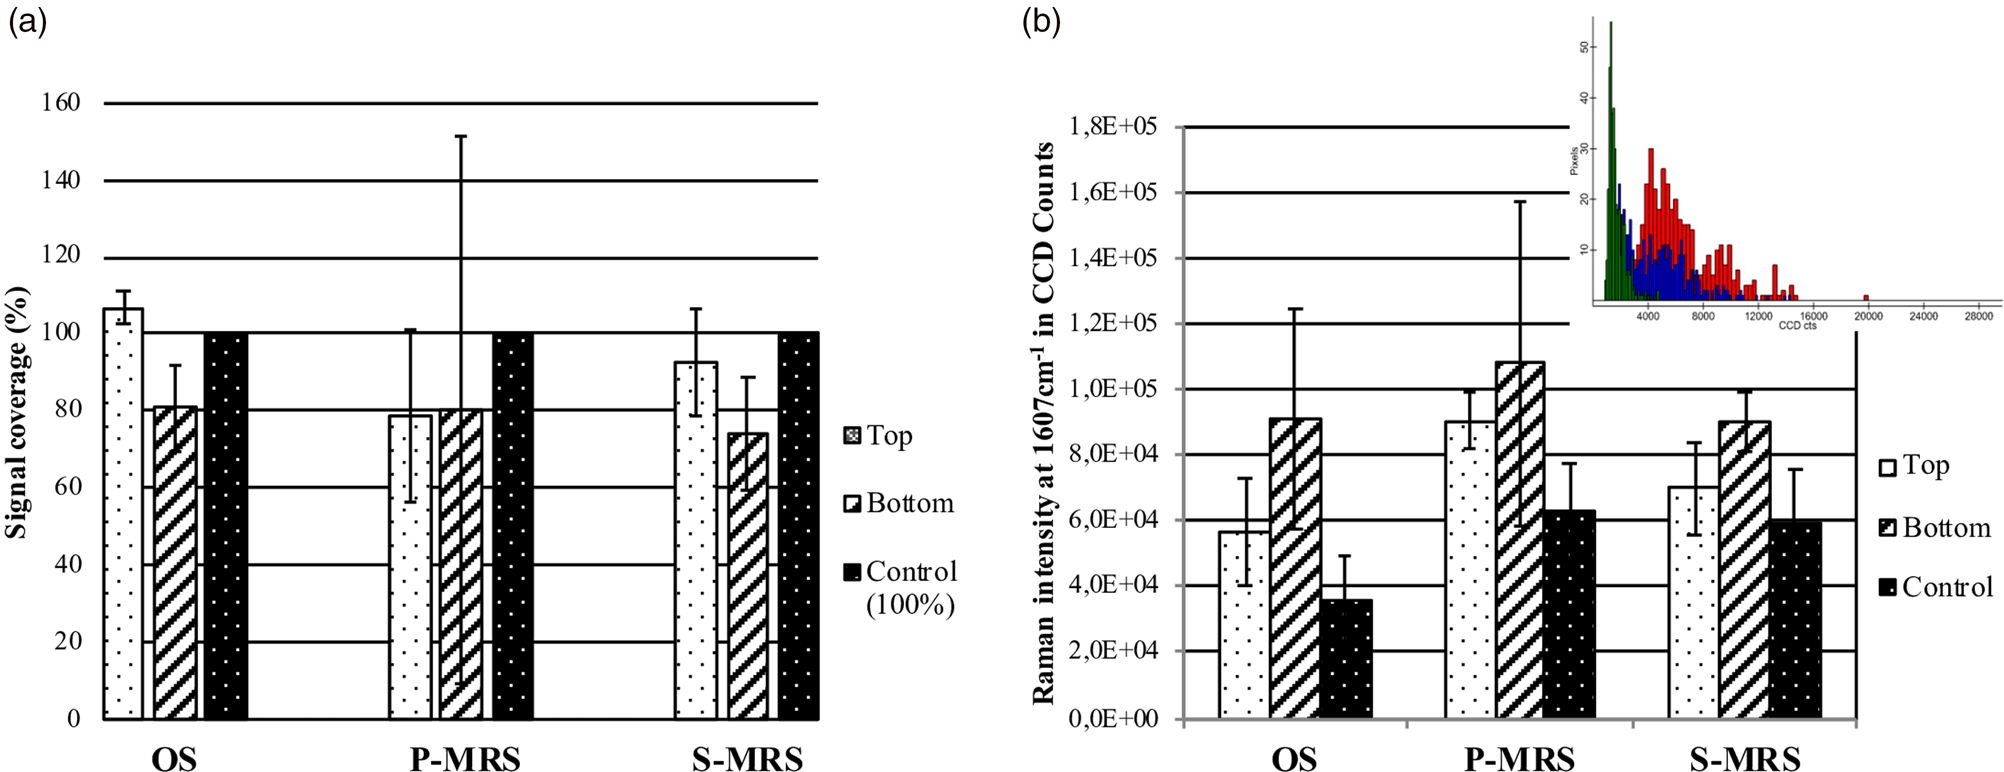
Fig. 3. (a) Signal coverage (%) calculated by applying an SNR mask superior to 5. (b) Average value of fluorescent background around 1607 cm−1 on image scans for each exposure condition and substratum, and example of a histogram highlighting the distribution of the fluorescent background in Charge-Coupled Devices counts per pixels on Image scans of the Bottom P-MRS analogue sample (colours as in Fig. 4).

Fig. 4. Raman spectra of C. antarcticus grown on (a) OS (Antarctic sandstone), (b) P-MRS and (c) S-MRS analogues, after exposure to different conditions: Top (exposed to vacuum or Mars-like conditions and irradiation): red spectrum, Bottom (exposed to vacuum or Mars-like conditions, not irradiated): blue spectrum and control (kept in the lab, in the dark at room temperature): green spectrum.
Organic compounds detection by Fourier transform infrared resonance spectroscopy
Among spectroscopy techniques, Fourier transform infrared resonance (FTIR) spectroscopy has been the preferred one to analyse spectral composition assignments of functional groups by associating them to their respective absorption bands (Centeno and Shamir, Reference Centeno and Shamir2008). This technique has the advantage to be rapid, requires only a small amount of sample, and has been used successfully for the identification of microorganisms and microscopic biological structures (Preston et al., Reference Preston, Johnson, Cockell and Grady2015). FTIR spectroscopy is a technique well proven in space studies and expected to be even more valuable and precise at the local scale within ExoMars instrumentations (Korablev et al., Reference Korablev, Dobrolensky, Evdokimova, Fedorova, Kuzmin, Mantsevich and Griffiths2017). Mid-infrared spectra of the OS, P-MRS and S-MRS analogues without colony, used as a reference for mineralogical absorbance, are reported in Fig. S4 (Supplementary Section 2 ‘Results’). Figure 5 shows the IR spectra of OS, P-MRS and S-MRS samples (Fig. 5(a)–(c), respectively). Several organic functional groups were identified in the spectra. The IR spectra of OS samples (Fig. 5(a)) Control, Bottom and Top (green, blue and red lines, respectively) show the characteristic bands of quartz around 1000 cm−1, identified in Fig. S4A (Supplementary Section 2 ‘Results’) and, in addition to gypsum, there are also vibrational modes indicative of carbonate ions (CO32−) around 1080 cm−1. Some organic functional groups can be identified; we report the presence of carboxylic acids with the bands around 3000 cm−1 ( = C–H stretch) and 1740 cm−1 (C = O stretching in esters), as well as the presence of amides around 1535 cm−1 (Dovbeshko et al., Reference Dovbeshko, Gridina, Kruglova and Pashchuk2000). The presence of melanin bands (3422, 2917, 2843, 1621 and 1024 cm−1) can be highlighted. Figure 5(b) shows the IR spectra of P-MRS samples Control, Bottom and Top. The main bands for carboxylic acids [3001, 1732, 739 cm−1 (Forfang et al., Reference Forfang, Zimmermann, Kosa, Kohler and Shapaval2017)] are evident in the spectra. The presence of carboxylic acids is more evident in S-MRS samples (Fig. 5(c)); bands related to C-H stretching vibrations ( = C–H stretch at 3011 cm−1, C–H stretching in CH3 and CH2 at around 2928 cm−1), C-O-C stretching in esters (1070 and 1250 cm−1) and CH2 rocking [729 cm−1 (Shurvell, Reference Shurvell and Chalmers2006)] are showed. The presence of amides I and II [1610 and 1502 cm−1 (Movasaghi et al., Reference Movasaghi, Rehman and Rehman2008)] are also reported. Our previous study of C. antarcticus melanin characterization by FTIR spectroscopy (Pacelli et al., Reference Pacelli, Cassaro, Maturilli, Timperio, Gevi, Cavalazzi and Onofri2020) reported the following bands as characteristic for fungal melanin: broad absorption bands at 3360–3000 and 2920–2850 cm−1, indicative of stretching vibration of OH groups and NH, respectively, a band at 1633 cm−1 (vibration of the aromatic groups C = C or C = O), and a band around 1024 cm−1 (for the aromatic ring CH stretching) (Dovbeshko et al., Reference Dovbeshko, Gridina, Kruglova and Pashchuk2000). In particular, the two distinct bands of extracted pigments at 2917 and 2843 cm−1 were reported as distinctive of IR spectra of the melanin of C. antarcticus. Although the presence of melanin can be related to the bands at 1632 and 1032 cm−1, the bands around 2921 and 2835 cm−1 are in common with those reported for carboxylic acids [due to C–H stretching vibration in CH2 (Shurvell, Reference Shurvell and Chalmers2006)], and therefore it is difficult to unequivocally assign the molecules. In general, the FTIR analyses revealed the presence of functional groups related to carboxylic acids, amides and melanin pigments. Overall, we found a similar trend for the IR spectra regardless of the substrata: (i) no significant differences were found between Top, Bottom and Control samples (Fig. 5, red, blue and green lines, respectively); (ii) some bands of mineral and organic compounds overlap and it is not always possible to unequivocally discern their presence.
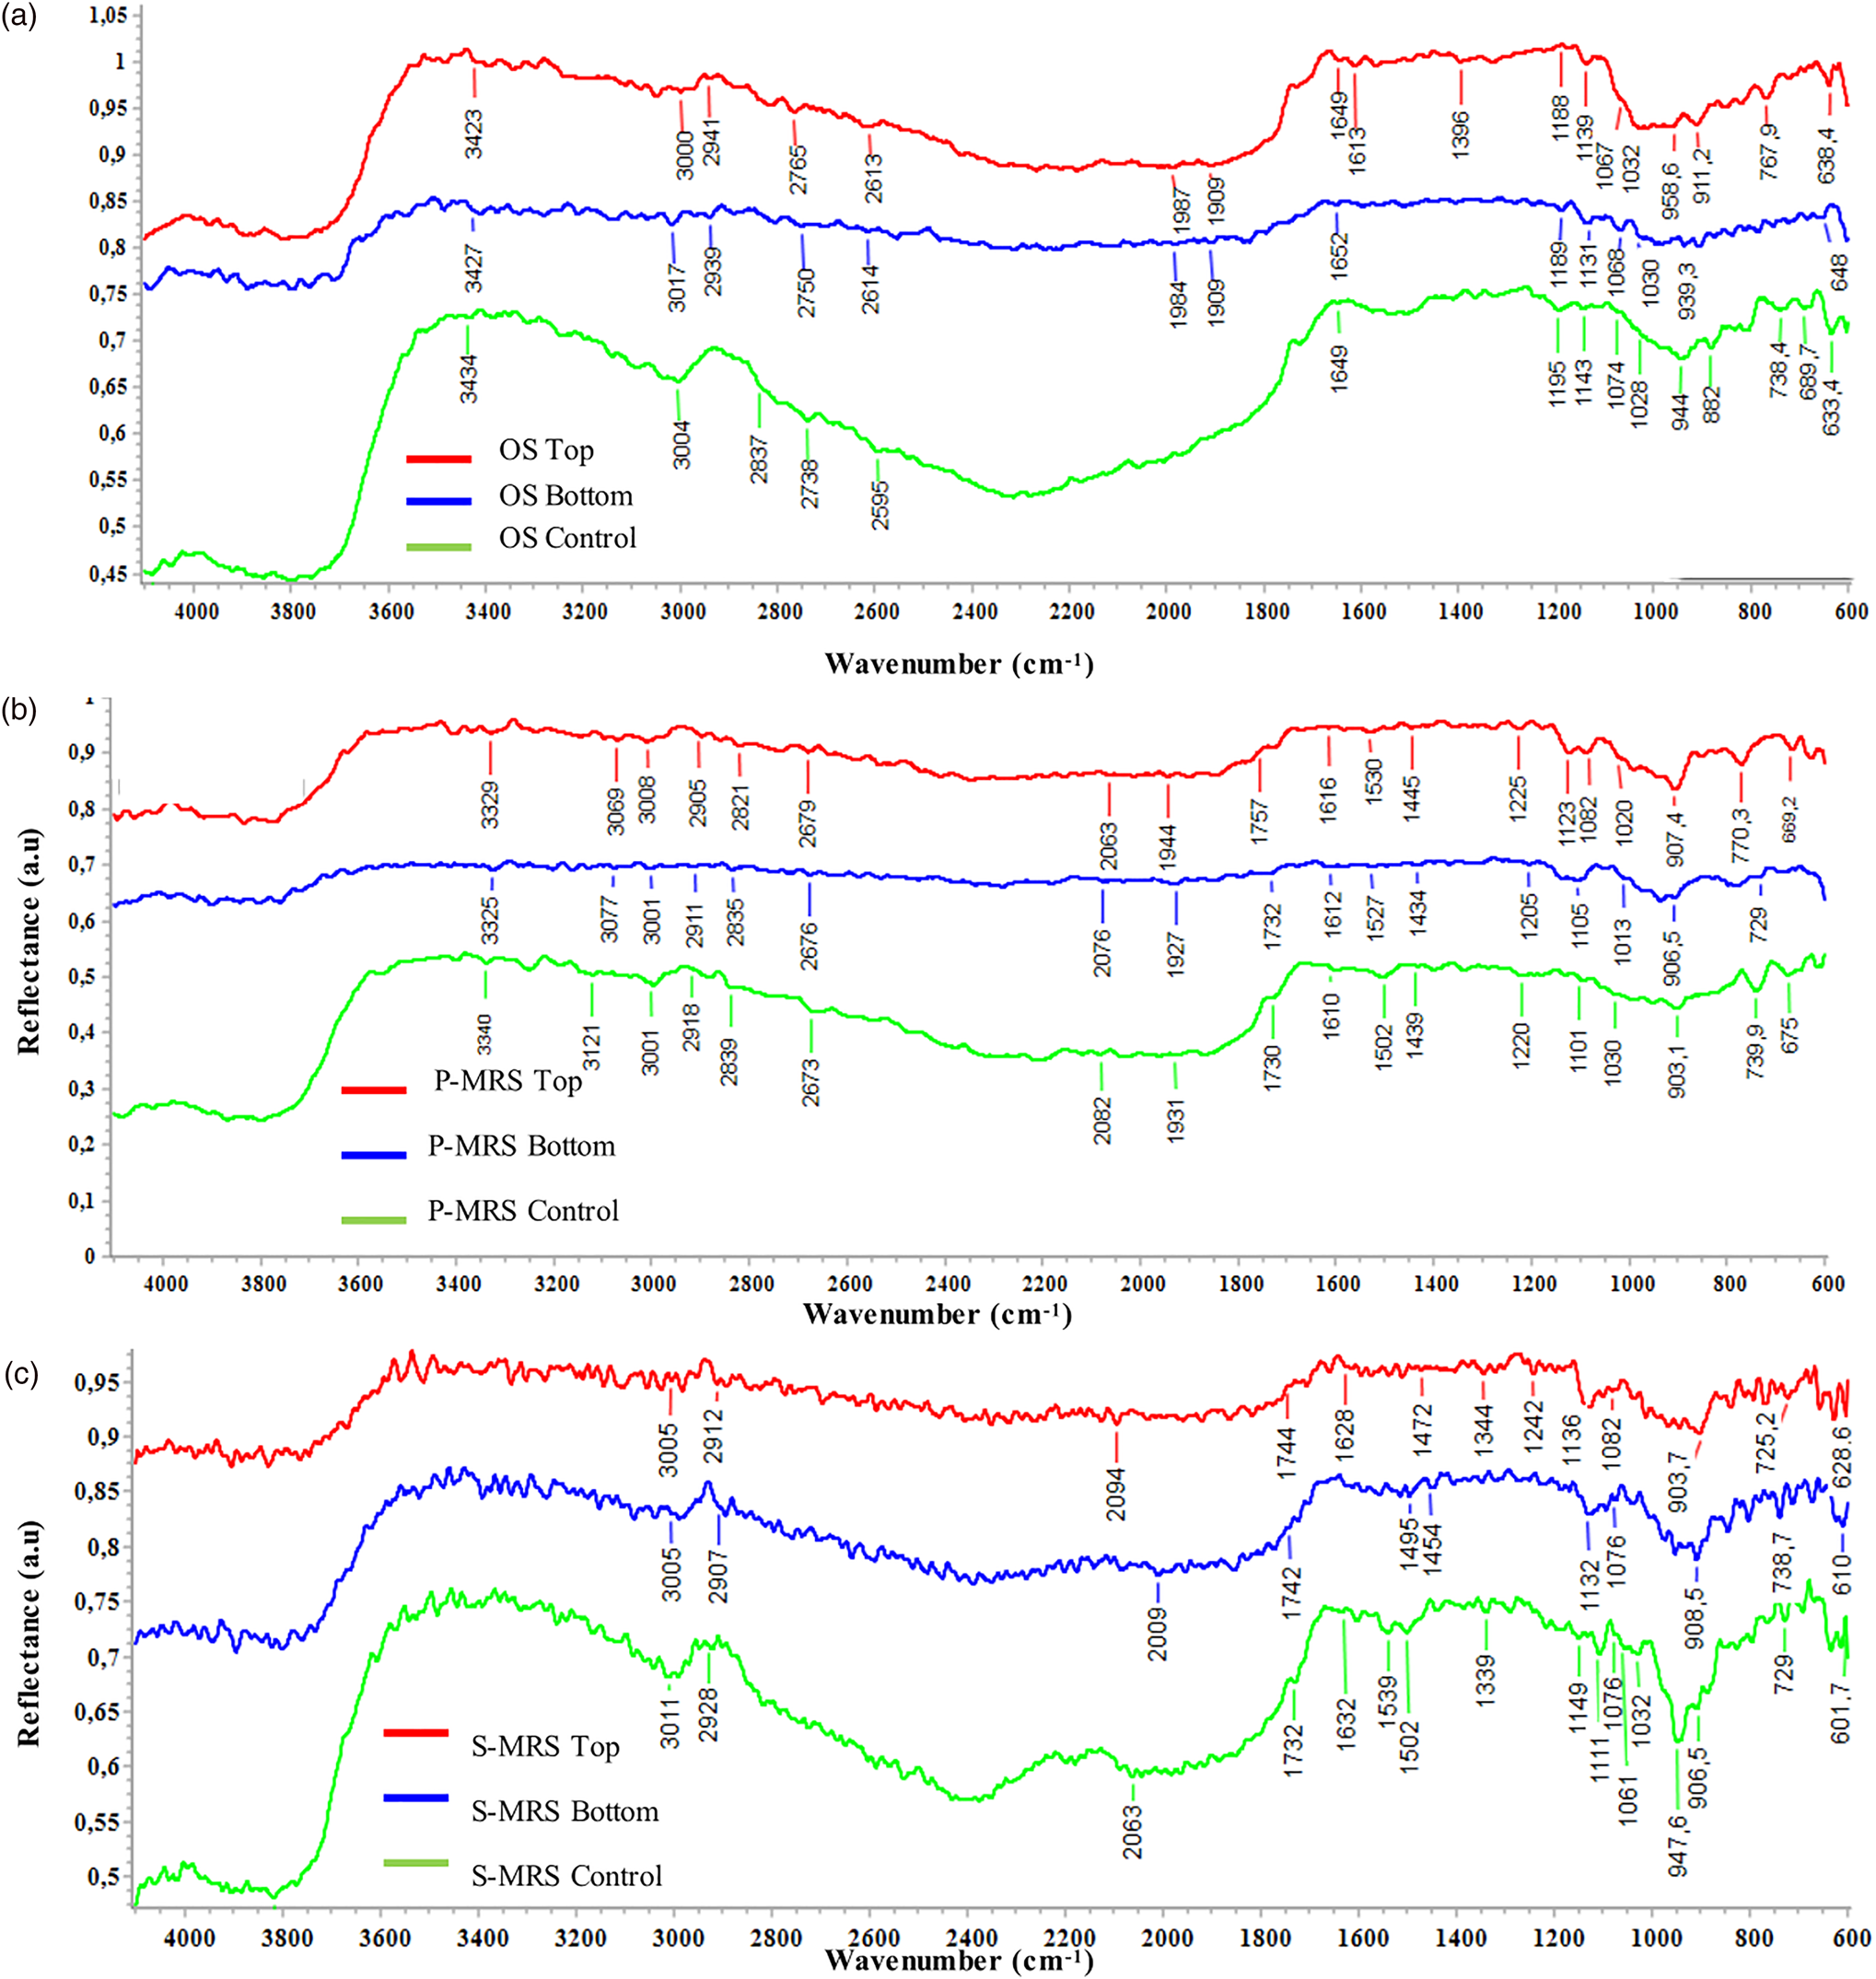
Fig. 5. MID infrared spectra of fungal colonies growth on different substrata after space exposure. Spectra of C. antarcticus grown on (a) OS = original substrate (Antarctic sandstone), (b) P-MRS and (c) S-MRS analogues, after exposure to different conditions: Top (exposed to vacuum or Mars-like conditions and irradiation): red spectrum, Bottom (exposed to vacuum or Mars-like conditions, not irradiated): blue spectrum and control (kept in the lab, in the dark at room temperature): green spectrum. Absorbance is expressed as an arbitrary unit.
Organic compounds detection by gas chromatography associated to mass spectrometry
Gas chromatography associated to mass spectrometry has been selected for the analysis of samples onboard the ESA-ExoMars rover (Holland et al., Reference Holland, Chutjian, Darrach and Orient2003) and has a long history of successful use on space missions (Biemann, Reference Biemann2007; Mahaffy, Reference Mahaffy2008). In order to distinguish which organic compounds are directly related to the presence of the fungus and which are related to the growth medium (rock analogues with MEA), a subset of samples, consisting of substrata without fungal colony, was investigated with this technique. They did not show organic compounds in appreciable amount, except for sugar derivatives as glucose and fructose (results not shown). The identification of compounds was performed by using commercially available electron mass spectra libraries such as NIST (Fison, Manchester, UK) and by comparison with standard compounds (Supplementary Section 2, ‘Results’). The results of the GC-MS analyses of the samples exposed outside the ISS for 16 months are reported in Table 1, showing the identified compounds (and the respective amount) for each substratum and treatment. A selected chromatogram is shown as an example (Fig. S5; Supplementary Section 2 ‘Results’). The m/z values and the abundance of peaks of the identified compounds are reported in Table S1. The following compounds were identified: azelaic acid (1,7-epta-didecanoic acid), myristic acid (1-tetradecanoic acid), palmitic acid (1-hexadecanoic acid), stearic acid (1-octadecanoic acid), lactic acid, pyruvic acid, glucose, fructose, glucitol, glycerol (1,2,3-tri-hydroxy propane) and ethylene glycol (1,2-dihydroxy ethane) (Table 1). Note that sugar derivatives (glucose and fructose) most probably derived from the malt extract used as cultivation medium of C. antarcticus. The samples exposed in the Top and the Bottom position of EXPOSE-R2's carriers on the ISS showed a composition of organic compounds similar to that of the respective Control samples (Table 1, Fig. S6), with some exceptions. Myristic acid, absent in the Control samples, was detected in OS, P-MRS and S-MRS Top samples, while palmitic acid was detected only in OS Bottom and Top samples. Glycerol was observed in Bottom and Top samples, but never in the Control sample. Among the samples, OS samples were characterized by the largest panel of carboxylic acid derivatives, including palmitic acid, stearic acid and lactic acid. Irrespective of the analysed sample, azelaic acid was detected in all the conditions tested (and not detected in the samples without colony) and therefore can be considered distinctive for the presence of fungal colony. To the best of our knowledge, this is the first time that azelaic acid shows the potential to be used as a biomarker.
Table 1. GC-MS analyses of samples after 16 months exposure outside the ISS

a The analysis was performed after silylation with N,N-bis-trimethylsilyl trifluoroacetamide in pyridine (620 μl) at 60 °C for 4 h, followed by addition of betulinic acid [3β-hydroxy-20(29)-lupaene-oic acid] as internal standard. Values are expressed as micrograms (μg) of identified compound. Nd: not determined. Samples reference: OS = original substrate (Antarctic sandstone), P-MRS and S-MRS analogue, after exposure to different conditions: Top (exposed to vacuum or Mars-like conditions and irradiation), Bottom (exposed to vacuum or Mars-like conditions, not irradiated) and control (kept in the lab, in the dark at room temperature).
Nucleic acids detection by quantitative polymerase chain reaction
Nucleic acids detection methods like PCR are highly specific and sensitive, able to detect even a single DNA molecule in a sample. The persistence and the detection of fungal DNA were analysed on samples after 16 months exposure to space and Mars-like conditions outside the ISS. Two different target genes were amplified with a qPCR approach to investigate the differences in nucleic acid detection: a long-repeated fragment [Long SubUnit (LSU) gene of 939 bp] and a small but non-repeated fragment in the genome (β-actin gene of 330 bp). Figure 6 shows the results of the LSU and β-actin genes amplification; the DNA was detectable in all the experimental conditions: 5400 DNA copies on average and never less than 300 copies were amplified. The test of LSU amplification highlighted a common trend for all the samples, i.e. a lower amount of amplified DNA for samples exposed to UV radiation and vacuum (Top), a higher copy number for samples exposed to vacuum but no radiation (Bottom) and a further increase in the control samples (up to 105 DNA copies, Fig. 6(a)). The β-actin gene amplification reported a lower number of amplified DNA copies (2700 bp on average). Top samples, in general, showed a lower copy number, which confirms that their DNA was more damaged than the other samples (Fig. 6(b)), but still amplifiable. To conclude, both LSU and β-actin genes amplification were successful, the number of amplified DNA copy was never under the amplification limit, despite the treatments.
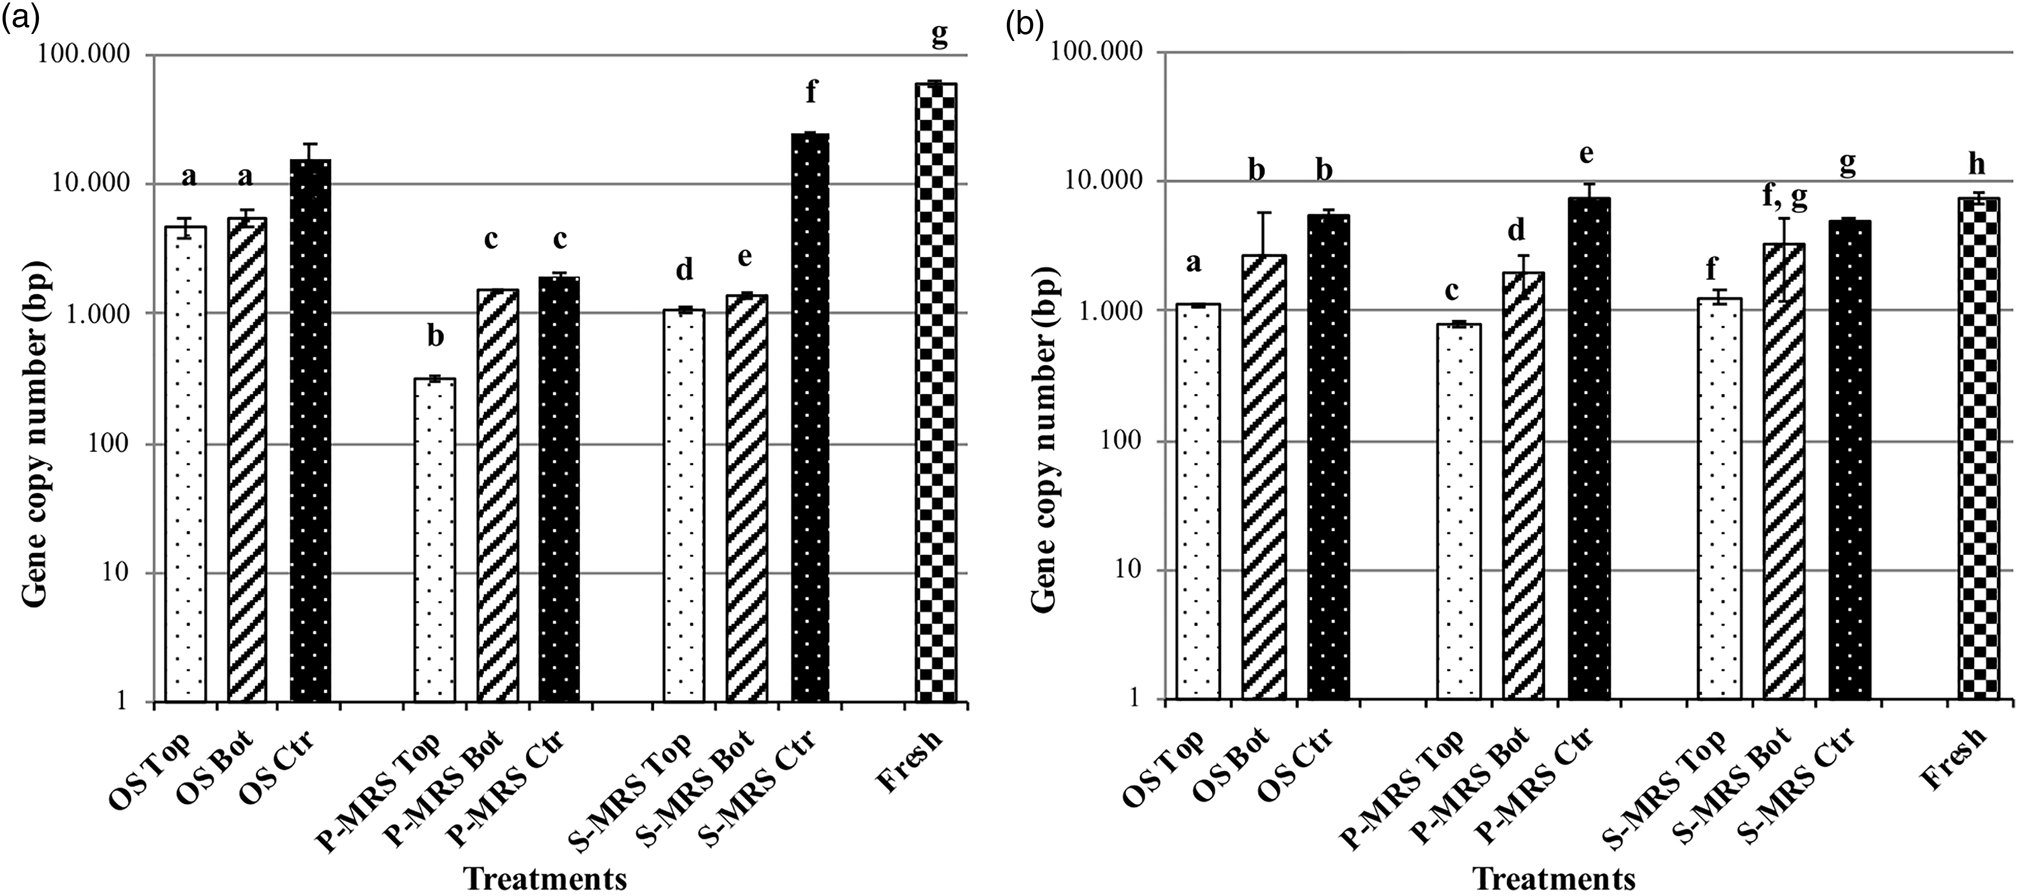
Fig. 6. Histogram of real-time qPCR. Amplification comparison between (a) a 939 bp target gene (LSU) and (b) a 330 bp target gene (β-actin) of C. antarcticus DNA, after 16 months exposure outside the ISS. On the y-axis is the number of amplified copies on a logarithmic scale. On the x-axis the treatments are reported as follow: DNA from samples grown on OS = original substrate (Antarctic sandstone), P-MRS analogue and S-MRS analogue, and exposed to different conditions: Top (exposed to vacuum or Mars-like conditions and irradiation), Bottom (exposed to vacuum or Mars-like conditions, not irradiated) and control (kept in the lab, in the dark at room temperature). Fresh = positive control: DNA extracted from fungal colony in physiological condition (not dried). The same letters above the bars indicate that the values are not statistically significant according to the t test (p ≤ 0.05).
Discussion
In the context of planetary exploration, this paper reports the first investigation on biomarkers stability in the black fungus C. antarcticus, isolated from the Antarctic desert ecosystems of the McMurdo Dry Valleys that have close analogies with Mars, after 16 months exposure in space and Mars-like conditions. Raman and infrared spectroscopies, and GC-MS were chosen to check the stability of pigments and organic compounds, because they are among the selected instrumentations onboard the upcoming missions to Mars (Vago et al., Reference Vago, Witasse, Svedhem, Baglioni, Haldemann, Gianfiglio and de Groot2015). The aim was to answer the following questions: are the distinctive Raman and infrared fingerprints of the fungus affected by space and Mars-like conditions exposure? Are the fungal compounds modified or distorted by radiation-induced breakdown, and therefore difficult to be detected in highly irradiated Martian surface environment?
Raman spectroscopy is a recent addition to astrobiological missions, and is included both on ESA ExoMars and NASA Mars missions, to analyse subsurface samples of Martian soil retrieved by the rover's drill system in the case of the ExoMars rover (Rull et al., Reference Rull, Maurice, Hutchinson, Moral, Perez, Diaz and Forni2017). Since Raman is a non-destructive technique and does not require reagents or sample preparation, it is a very promising tool for in situ diagnosis of biomolecules during life detection missions; it is also sensitive to mineralogy, so it can provide information on the geochemistry of the soil. In addition, Raman instruments allow to detect a low concentration of organic molecules and have the potential to be miniaturized and used aboard the planetary exploration rovers (Edwards et al., Reference Edwards, Jehlička and Culka2021).
To gain insight into the preservation of fungal pigments in exposed samples, Raman spectra were recorded. They show the typical melanin signal: two main bands around 1600 and 1340 cm−1. The assignment of these two bands is not entirely agreed upon; some authors have attributed both bands to the stretching of the C-C bonds within the rings of the aromatic monomers (Galván et al., Reference Galván, Jorge, Ito, Tabuchi, Solano and Wakamatsu2013). Others assigned the contribution of the 1600 cm−1 band to the vibration of the aromatic C = C stretching modes and the 1340 cm−1 band to the C–N stretching band of indole (Dhole et al., Reference Dhole, Khollam, Gunjal, Shelke and Jadkar2016). It is likely that the broad features of melanin are composed of many overlapping Raman bands because of the vibrations of the constituent monomers; furthermore, it is important to highlight that even if some authors pointed out a marked resemblance of the melanin bands to the bands of amorphous carbon (Capozzi et al., Reference Capozzi, Perna, Gallone, Biagi, Carmone, Fratello and Cicero2005), we demonstrated that spectra are discernible. Figure 2 reports the melanin and amorphous carbon spectra: the amorphous carbon spectrum in P-MRS does not have the intermediate band characteristic for fungal melanin (around 1450 cm−1) and the entire spectrum is slightly shifted (1350, 1612 cm−1) compared to the melanin one. In general, the intermediate band around 1450 cm−1 is only in the spectra from C. antarcticus colonies and from their extracted melanin. According to the study of Culka et al. (Reference Culka, Jehlička, Ascaso, Artieda, Casero and Wierzchos2017), this can be due to the CH deformation vibrations from compounds such as lipids, polysaccharides and proteins that form the fungal biomass, mainly the cell walls, and this is a distinctive signature of the fungal melanin. The main outcomes of our Raman investigations are that fungal melanin is always detectable through Raman spectroscopy in all experimental conditions and it could be considered as a suitable biomarker (Fig. 4(a)–(c)). To our knowledge, this is the first study reporting the persistence of fungal melanin in Martian rock-analogues after space and Mars-like conditions exposure. This is even more noteworthy if we consider that, due to the presence of harmful ultraviolet and cosmic radiation on the Martian surface, it can be expected that microbial life, if it ever existed on Mars, would have produced UV-protecting pigments, as part of its survival strategy. The remarkable protective role of melanin has already been widely reported; melanins act as powerful protectors against a broad range of stressors, such as UV and ionizing radiation, extremes of temperature, oxidizing agents and antibiotics, hypersaline and desiccation conditions (Eisenman and Casadevall, Reference Eisenman and Casadevall2012). In particular, the presence of a thicker cell wall and consequent denser incrustation of melanin have previously been demonstrated to enhance the resistance to acute and chronic ionizing radiation of C. antarcticus, if compared to its non-melanized counterpart (Pacelli et al., Reference Pacelli, Selbmann, Zucconi, De Vera, Rabbow, Horneck and Onofri2017, Reference Pacelli, Bryan, Onofri, Selbmann, Zucconi, Shuryak and Dadachova2018) and to a different species of the same Cryomyces genus, namely C. minteri, after 18 months of space and Mars-like exposure (Onofri et al., Reference Onofri, de la Torre, de Vera, Ott, Zucconi, Selbmann and Horneck2012, Reference Onofri, de Vera, Zucconi, Selbmann, Scalzi, Venkateswaran and Horneck2015, Reference Onofri, Selbmann, Pacelli, Zucconi, Rabbow and de Vera2019). In addition, due to the melanins’ wide distribution in all kingdoms of life, they are considered ancient molecules (Blois, Reference Blois and Fox1965). Moreover, melanin is exceptionally preserved in fossils; Glass et al. (Reference Glass, Ito, Wilby, Sota, Nakamura, Bowers and Wakamatsu2012) have demonstrated the preservation of eumelanin in fossil records older than 160 Ma. Therefore, it is plausible that melanization represents an important adaptation mechanism to Earth's climate history and eukaryotic evolution (Pinkert and Zeuss, Reference Pinkert and Zeuss2018). Nevertheless, highly energetic UV and ionizing radiations, as present on the early Earth, and present-day Mars, are reported to be the major unresolved issue in the search for biomarkers of past or present microbial life on the Martian surface (Dartnell et al., Reference Dartnell, Desorgher, Ward and Coates2007). Dartnell et al. (Reference Dartnell, Desorgher, Ward and Coates2012b) pointed out the effect of long-term irradiation, especially ionizing radiation, on the preservation of biomolecules, namely deinoxanthin in Deinococcus radiodurans and β-carotene in Synechocystis. However, recent findings demonstrated that the carotenoids were quickly destroyed by γ rays only on cells irradiated alone, but they were totally preserved if protected by two Martian mineral analogues, up to the dose of 117 kGy of ionizing radiation (Baqué et al., Reference Baqué, Hanke, Böttger, Leya, Moeller and de Vera2018). Differently, Leuko et al. (Reference Leuko, Bohmeier, Hanke, Böettger, Rabbow, Parpart and de Vera2017) reported the disappearance of the deinoxanthin signal in D. radiodurans after exposure to simulated Mars-like conditions in LEO for a prolonged period as part of the BIOMEX project. Our results suggested that melanins are promising biomarkers of microbial life being preserved under space and Mars-like exposure, as well as potentially on the Martian subsurface, due to their distinctive and stable fingerprint by Raman spectroscopy.
Among spectroscopy techniques, FTIR is the most appropriate technique to analyse spectral composition assignments of functional groups by associating them to their respective absorption bands (Centeno and Shamir, Reference Centeno and Shamir2008). The ESA ExoMars rover includes within its payload three IR spectrometers, namely ISEM (Infrared Spectrometer for ExoMars), MicrOmega and Ma-MISS (Mars Multispectral Imager for Subsurface Studies). It offers a collection of different methods for the mineralogical and organic characterization of the Martian soil at landing site. Near-IR spectroscopic observations of the Martian surface have not been performed from any surface platform to date. Therefore, the close-up near-IR capability of ISEM on the ExoMars rover offers a very high diagnostic potential (Vago et al., Reference Vago, Coates, Jaumann, Korablev, Ciarletti, Mitrofanov and Rull2018). Here, IR spectra complemented the mineralogical information obtained by Raman analyses and showed the main molecular vibrations of some organic compounds (Fig. S4). The assignment of the main bands (assignment cm−1, Fig. 5) to several vibrational functional groups of organics was at the 3401 [O–H stretch, with potential contribution of N–H stretch], 2960 [C–H asymmetric stretch (CH3)], 1740 [C=O stretch stretching (Fabian et al., Reference Fabian, Jackson, Murphy, Watson, Fichtner and Mantsch1995)], 1650 [amide I: C=O, C–N, N–H], 1540 [amide II: N–H, C–N], 1423 [C–H bending], 1315 [ester C–O], 1168 [C–OH asymmetric stretch] and 863 [possibly the aromatic C–H out of plane bend] regions. The presence of amide I and II was potentially due to peptides from proteins, while bands around 2800 cm−1 are due to the stretching vibrations of CH2 and CH3 of phospholipids in cell membranes. Bands around 2917, 2843, 1621 and 1024 cm−1 are indicative for melanin pigments. The organic functional groups that could be attributed to melanin, carboxylic acids and amides were hard to be unambiguously discerned, due to the strong and similar mineralogical absorptions. However, as for the Raman investigation, no significant differences were found among the treatments.
The MOMA (Mars Organic Molecule Analyzer) instrument, onboard the ExoMars rover, will carry a GC-MS for the extraction and robotic characterization of organic molecules, including carboxylic acids and amino acids, and their degradation products (Vago et al., Reference Vago, Westall, Coates, Jaumann, Korablev, Ciarletti and Rull2017). Our GC-MS data suggested the presence of carboxylic acids as well as the occurrence of appreciable degradative processes for the samples exposed on the ISS facility. Low molecular weight carboxylic acids, such as pyruvic acid and lactic acid, were most probably produced by radiolysis of glucose and fructose occurring in the growth medium, in accordance with the results previously reported for the formation of simple carboxylic acids during the oxidative transformation of monosaccharides (Novotný et al., Reference Novotný, Cejpek and Velíšek2008). In a similar way, glycerol and ethylene glycol may be derived from an extensive degradation of the sugars present in the samples (Baraldi, Reference Baraldi1973). Contrary, high molecular weight carboxylic acids, including azelaic, myristic, stearic and palmitic acids (Table 1) cannot be directly related to the radiolysis of monosaccharides; among them, the azelaic acid was clearly associated to the presence of C. antarcticus irrespective of the treatments. Azelaic acid is known to be an inhibitor of tyrosinase, one of the key enzymes for melanogenesis process, of mitochondrial enzymes of the respiratory chain, and of DNA synthesis (Nazzaro-Porro, Reference Nazzaro-Porro1987). It remains unclear if the other carboxylic acid derivatives can actually act as biomarkers, even if some of them appeared as possible degradation products of C. antarcticus. Carboxylic acids are key intermediates of numerous processes as the production of energy and the biosynthesis of primary and secondary metabolites; the long-chain carboxylic acids (C9–C20) are especially important because they are constituents of lipids. Indeed, fatty acids are ubiquitous and abundant constituents of bacterial and eukaryotic cellular membranes, bound in phospholipids and glycolipids (Vestal and White, Reference Vestal and White1989). The hydrocarbon-based acids and alcohols that contribute to the amphiphilic properties of membrane lipids in most bacteria (eubacteria) and eukaryotes have typical chain lengths between 14 and 18 carbons (Georgiou and Deamer, Reference Georgiou and Deamer2014); we found myristic acid (C14), palmitic acid (C16) and stearic acid (C18) in our samples. Fatty acids derived from microbial cellular metabolic processes have an even-over-odd carbon chain length preference due to enzymatically formed acetyl (C2) units derived from glucose (Volkman and Brown, Reference Volkman and Brown2006). However, the carbon chain length and carbon number preference are not always diagnostics of biotic versus abiotic genesis (Williams et al., Reference Williams, Eigenbrode, Floyd, Wilhelm, O'Reilly, Johnson, Craft, Knudson, Andrejkovičová, Lewis, Buch, Glavin, Freissinet, Williams, Szopa, Millan, Summons, McAdam, Benison, Navarro-González, Malespin and Mahaffy2019). Short-chain carboxylic acids may be metabolic products not incorporated into membranes, and Fischer-Tropsch-type reactions can generate long-chain carboxylic acids. In addition, abiotic hydrocarbon derivatives were identified in the Murchison meteorite (Naraoka et al., Reference Naraoka, Shimoyama and Harada1999) and they can spontaneously self-assemble into membranous bilayer vesicles in aqueous phases (Deamer and Pashley, Reference Deamer and Pashley1989). Therefore, we must consider that biotic and abiotic carboxylic acids produce distinctly different GC-MS patterns and these patterns can be used as biomarkers (Georgiou and Deamer, Reference Georgiou and Deamer2014). Nevertheless, the most important outcome of this approach is the identification of azelaic acid as a distinctive feature of the fungal presence, despite the treatments and the substrata (Fig. S6); therefore, azelaic acid should be taken into account as a biomarker.
Lastly, even if PCR-based instruments have not been planned for the future Mars missions, our purpose was to detect nucleic acids from Martian analogue samples using the PCR technique, to test its applicability to an in-situ DNA detection technique on Mars for future exploration campaigns. In fact, currently, the detection of nucleic acids as biomarkers is one of the strategies under development for life-detection missions destined for Mars (Maggiori et al., Reference Maggiori, Stromberg, Blanco, Goordial, Cloutis, García-Villadangos and Whyte2020). PCR is a useful technique that allows amplifying fragments of a DNA molecule, making it possible to detect even minimal traces; therefore, recent efforts have focused on developing robotic instruments able to perform PCR or direct DNA sequencing on environmental samples with low DNA amount (Carr et al., Reference Carr, Rowedder, Vafadari, Lui, Cascio, Zuber and Ruvkun2013). Nucleic acids are excellent biological markers for several reasons including their presence in all forms of life and their specificity as a marker of terrestrial life, their endurance upon adsorption to rocks, the resistance of the information contained therein, and the formation of polymeric, double-stranded chain, improbable under abiotic conditions (Trevors, Reference Trevors2003). The results reported here revealed the extraordinary resistance of C. antarcticus DNA, being always detectable after 16 months of space exposure (Fig. 6). The presence of DNA-like molecules in Martian soils is plausible due to large meteoritic exchanges between Mars and Earth and there is an acceptable chance that potential past or eventually present life on Mars could be related to life on Earth (Thiel et al., Reference Thiel, Pletser and Foing2011). These results also highlighted the risk of the ‘forward contamination’ of spacecraft hardware, consisting of terrestrial microbes and/or their components (Rummel et al., Reference Rummel, Beaty, Jones, Bakermans, Barlow, Boston, Chevrier, Clark, de Vera, Gough, Hallsworth, Head, Hipkin, Kieft, McEwen, Mellon, Mikucki, Nicholson, Omelon and Wray2014) that can generate false-positive results.
Implications for the search of Earth-like life on Mars
The outcomes of this research are very timely and relevant for space exploration considering that the imminent robotic exploration of Mars will carry Raman, FTIR, and GC-MS instruments. Raman and FTIR spectroscopies offer complementary elemental and mineralogical analysis techniques; they highlighted the presence in our samples of melanin pigments, carboxylic acids and amides. Even if the detection of organic compounds by IR spectroscopy is challenging due to the huge overlap between organic and mineralogical vibrations, it should be highlighted that aliphatic structures were observed, as indicated by C–H stretching vibrations in the region 2960–2850 cm−1. Since C–H bonds exist in virtually all organic compounds, the C–H stretch vibration may be considered the most characteristic for recognizing organic compounds; in addition, this region is free of any mineralogical vibration and therefore of utmost importance for organic compounds detection. Nevertheless, it should be noted that even if IR spectroscopy showed the presence of carboxylic acids and amides, these molecules are not recorded in the Raman analysis. On the contrary, the Raman analyses are dominated mainly by the melanin spectrum; the presence of melanin can also be found by FTIR spectroscopy, but it is difficult to unequivocally assign the bands to the presence of melanin due to vibration overlapping with other organic compounds (as carboxylic acids) and minerals. The identification of carboxylic acids by FTIR spectroscopy was confirmed by the GC-MS analyses; they identified, for the first time, the azelaic acid as a potential biomarker. The detection of nucleic acids by amplification methods in all the samples, and the non-detection by the other used techniques, may suggest new designs for future payloads in the search for life in the solar system. Overall, our results underlined that each technique has its own constraints and limitations on the kind of given information. These results do not have to discourage, instead they highlight the importance to use a suite of complementary analytical techniques to support any identification of organic compounds in future space robotic exploration.
To conclude, we reported on the persistence of fungal biomolecules after 16 months of space and Mars-like conditions exposure outside the ISS, and we discussed their potential use for searching traces of extant or recently extinct Earth-like life on Mars. We have demonstrated (i) the robustness of the fungal melanin detection by Raman spectroscopy, (ii) the presence of carboxylic acids and amides functional groups by FTIR spectroscopy, (iii) the detection of azelaic acid as a distinctive sign of fungal presence by GC-MS, and (iv) the detection of nucleic acids by amplification methods. Our analytical techniques are also consistent, to some extent, with the ones proposed in the current and near-future exploration mission to Mars. Results from this study will contribute to the development of a data library to support the interpretation of data generated by future missions to Mars. Besides, our results suggest that the used techniques should be added in the analysis of the Mars Samples Return (MSR), compared to the life-detection protocol reported in Kminek et al. (Reference Kminek, Conley, Allen, Bartlett, Beaty, Benning and Westall2014). These researches also have implications in the planetary protection issue, since a hypothetical contaminant could persist under the harsh conditions of an extraterrestrial celestial body. However, some Martian conditions may be deleterious to potential organisms or organic molecules, but could also offer protection, especially for extremophilic organisms or their remains, thanks to their extraordinary adaptation mechanisms (Hallsworth, Reference Hallsworth2021).
Supplementary material
The supplementary material for this article can be found at https://doi.org/10.1017/S1473550421000240
Acknowledgements
We thank the European Space Agency (ESA) for offering the flight opportunity on the ISS and the Russian cosmonauts who took care of the samples between launch and landing. The Italian National Program of Antarctic Researches (PNRA) and the Italian National Antarctic Museum ‘Felice Ippolito’ (MNA) are also acknowledged for funding the collection of Antarctic samples and the CCFEE.
Author contributions
J-PPdV, SO, RD, LS and LZ designed the research; CP, AC, MB, LB and ER performed the experiments. CP, AC, MB, RS, AM, UB and RD analysed data. CP drafted the paper with inputs from all other authors. All authors approved the submitted version.
Financial support
This work was supported by the Italian Space Agency (BIOMEX MicroColonial Fungi-ASI grant n. 2013-063-R.0 and BioSigN MicroFossils-ASI grant n. 2018-6-U.0). Part of this work was performed also in the frame of Europlanet 2020 Research Infrastructure. Europlanet 2020 RI has received funding from the European Union's Horizon 2020 research and innovation programme under grant agreement No 654208. Further support of this work was given by the German Aerospace Center (DLR) within the DLR-FuW-Project BIOMEX (2474128).
Conflict of interest
None.


