Introduction
The differences between likely early anaerobic mechanisms and aerobic metabolism are remarkable. Canfield et al. (Reference Canfield, Rosing and Bjerrum2006) discuss many possible electron donors and acceptors available to early anaerobic metabolisms. For example, the reaction H2 + 1/2S2 → H2S produces 21 kJ/mol, while the aerobic reaction H2 + 1/2O2 → H2O generates some 241 kJ/mol. The evolutionary transition producing this change in available metabolic free energy enabled the eukaryotic transition to complex cellular organisms. What is the nature of such ‘self-referential’ evolutionary dynamics (Goldenfeld & Wose Reference Goldenfeld and Wose2011)? Here we explore an analogy with economic ratchets (Wallace Reference Wallace2015, Ch. 7) that seems particularly illuminating, adapting groupoid symmetry methods that are associated with cognitive gene expression (Wallace Reference Wallace2012).
Evolution involves at least four factors (Lewontin Reference Lewontin2010; Wallace Reference Wallace2010):
1. Variation: Across individual organisms at any time, there is considerable variation in structure and behaviour.
2. Inheritance: Offspring will resemble their own progenitor or progenitors more than other progenitors.
3. Change: Across time, variation in structure and behaviour is constantly occurring in surviving organisms.
4. Environmental interaction: Individual organisms and related groups engage in powerful, often punctuated, dynamic mutual relations with their embedding environments that may include the exchange of ‘heritage material’ between markedly different entities through various means.
Next, many of the essential processes within this structure can be represented in terms of interacting information sources, constrained by the asymptotic limit theorems of information and control theories. Following the arguments of Wallace (Reference Wallace2010), it can be shown that
1. An embedding ecosystem has ‘grammar’ and ‘syntax’ that allows it to be represented as an information source, say X.
2. Genetic heritage can also be characterized as a ‘language’, and hence an information source Y.
3. Gene expression is a cognitive process that can be expressed in terms of another information source, Z. Cognition, at base, demands that an entity choose one or a small number of responses to environmental or other signals from a much larger set of those available to it. Choice involves reduction in uncertainty in a formal manner, and implies the existence of an information source (Atlan & Cohen Reference Atlan and Cohen1998). In addition, cognition is canonically associated with an inherent groupoid structure that generalizes the more familiar idea of a symmetry group (Weinstein Reference Weinstein1996). See the Mathematical Appendix for a brief introduction to groupoid symmetries. The argument involves equivalence classes of the paths necessarily associated with cognition (Wallace Reference Wallace2012). The inference is quite direct and will not be presented here to avoid reproduction of material already in the literature.
4. Large deviations in dynamical systems are excursions from non-equilibrium steady states (nss) that occur with very high probability only along certain developmental pathways, allowing definition of an information source we will call L D. See Champagnat et al. (Reference Champagnat, Ferriere and Meleard2006) for details. The essential point is that, according to the Gartner/Ellis and similar theorems (Dembo & Zeitouni Reference Dembo and Zeitouni1998), large deviations are to be associated with quantities
 $ - \sum\nolimits_j P_j\log [P_j]$ where the P j constitute a probability distribution (Dembo & Zeitouni Reference Dembo and Zeitouni1998). Such sums characterize information sources (Cover & Thomas Reference Cover and Thomas2006).
As a consequence, it becomes possible to define a joint Shannon uncertainty representing the interaction of these information sources as
Phase change
Following Feynman's (Reference Feynman2000) identification of information as a form of free energy, an ‘entropy’ can be defined across a vector of driving system parameters ![]() ${\bf J}$ as the Legendre transform of H(X, Y, Z, L D):
${\bf J}$ as the Legendre transform of H(X, Y, Z, L D):
Then, in first order, it is also possible to apply an analogue to the Onsager approximation of non-equilibrium thermodynamics in which system dynamics are determined by gradients of S in the components of ![]() ${\bf J}$ (de Groot & Mazur Reference de Groot and Mazur1984):
${\bf J}$ (de Groot & Mazur Reference de Groot and Mazur1984):
 $${\rm d}J_t^i \approx \left( {\sum\limits_k {\rm \mu} _{i,k} \partial S/\partial J_t^k} \right){\rm d}t + {\rm \sigma} _i J_t^i {\rm d}B_t. $$
This is a standard construction for which μi,k is a kind of diffusion matrix, in this approximation. The last term characterizes stochastic ‘volatility’: the σi are magnitude parameters, and dB t represents a noise that may not be the usual Brownian white noise which is supposed to have uniform strength at all frequencies.
Setting the expectations of these equations to zero, it is assumed here, produces a relatively large set of nss, each indexed by some set j = 1, 2, …, j max and each characterized by a joint source uncertainty having value H j. Noise effects ensure that the nss are not inherently unstable.
Assuming metabolic free energy is available from the embedding environment at some index of intensity ρ, it is possible to define a pseudoprobability for state q as
where κ is an index of loss due to thermodynamic Second Law effects. We can iteratively use that pseudoprobability to define a ‘higher free energy’ Morse Function F (Pettini Reference Pettini2007) in terms of the denominator sum,
Arguing by abduction from physical theory, changes in ρ will, as in the case of ordinary phase transitions at different temperatures, be associated with profound – and highly punctuated – evolutionary transitions (Eldredge & Gould Reference Eldredge, Gould and Schopf1972; Gould Reference Gould2002). As in the case of physical phase changes, higher values of the ‘temperature’ ρ will be associated with richer cognitive structures. These transitions, it is important to realize, are indexed by the symmetries of the underlying cognitive gene expression groupoids (Wallace Reference Wallace2012) and define entirely new pathways along which organisms develop. The approach represents extension of group symmetry breaking arguments from physical systems to groupoid symmetry breaking/making in biological systems (Landau & Lifshitz Reference Landau and Lifshitz2007; Pettini Reference Pettini2007). This is no small thing.
Ratchet dynamics
It is possible to formally describe an economic-like ratchet that, although constrained by evolutionary limitations, is usually characterized as a ‘self-referential’ dynamic. Goldenfeld & Wose (Reference Goldenfeld and Wose2011) describe the underlying mechanism as involving self-referential dynamics in which the update rules changes during the evolution of the system, a function of its state and history.
The evolutionary ‘economic-like’ ratchet we propose involves the interaction of metabolic energy cycles and the organisms that utilize them. The simplest way to explore such mechanisms is via an extension of equation (4).
First, assume that the right-hand side of equation (4) can be decently approximated as an integral. Second, suppose that the maximum possible value of H, say H max, is much greater than κρ as a consequence of entropic loss. Third, suppose that ρ → ρ + Δ, Δ ≪ ρ.
This leads to an expression for the free energy index F of the form
 $$\eqalign{& \exp \left[ { - \displaystyle{F \over {{\rm \kappa} ({\rm \rho} + \Delta )}}} \right] \approx \int_0^{H_{{\rm max}}} \exp [ - H/{\rm \kappa} ({\rm \rho} + \Delta )]{\rm d}H \cr & \quad \approx \int_0^\infty \exp [ - H/{\rm \kappa} ({\rm \rho} + \Delta )]{\rm d}H = {\rm \kappa} ({\rm \rho} + \Delta ).} $$
 Defining another entropy in the free energy measure F as ![]() ${\rm {\cal S}} \equiv F(\Delta ) - \Delta {\rm d}F/{\rm d}\Delta $ allows use of an iterated stochastic Onsager approximation for the dynamics of Δ in the gradient
${\rm {\cal S}} \equiv F(\Delta ) - \Delta {\rm d}F/{\rm d}\Delta $ allows use of an iterated stochastic Onsager approximation for the dynamics of Δ in the gradient ![]() ${\rm d}{\cal S}/{\rm d}\Delta $ (de Groot & Mazur Reference de Groot and Mazur1984). The resulting stochastic differential equation is
${\rm d}{\cal S}/{\rm d}\Delta $ (de Groot & Mazur Reference de Groot and Mazur1984). The resulting stochastic differential equation is
 $$\eqalign{& {\rm d}\Delta _t = \displaystyle{{{\rm \mu} \Delta _t {\rm \kappa}} \over {{\rm \rho} + \Delta _t}} {\rm d}t + {\rm \sigma} \Delta _t {\rm d}W_t \cr & \quad \approx \displaystyle{{{\rm \mu \kappa}} \over {\rm \rho}} \Delta _t {\rm d}t + {\rm \sigma} \Delta _t {\rm d}W_t,} $$
where μ is another ‘diffusion coefficient’, dW t represents Brownian white noise, σ determines the magnitude of the volatility, and we use the condition that Δ ≪ ρ.
Applying the Ito Chain Rule (Protter Reference Protter1990) to log [Δ] produces the SDE
Invoking the Stochastic Stabilization Theorem (Mao Reference Mao2007; Appleby et al. Reference Appleby, Mao and Rodkina2008),
almost surely unless
 $$\eqalign{& \displaystyle{{{\rm \mu \kappa}} \over {\rm \rho}}\, \gt\, \displaystyle{1 \over 2}{\rm \sigma} ^2, \cr & {\rm \rho}\, \lt\, \displaystyle{{2{\rm \mu \kappa}} \over {{\rm \sigma} ^2}}.} $$
The essential point is that there will be an upper limit to ρ in this version of the ratchet. Above that ceiling, other things being equal, Δt → 0.
This mechanism might constrain the maximum possible per cent of oxygen in Earth's atmosphere as a result of the aerobic transition.
Conversely, environmentally driven onset of a negative ratchet may explain patterns of local oxygen depletion in aquatic environments: increase in σ triggers a decline in ρ that in turn increases σ.
Another possible inference, however, might well be that increasing ‘volatility’ as a consequence of global warming can lower global oxygen concentration, perhaps triggering a downward ratchet to Mars-like conditions. The scenario would involve something like economically driven desertification of the tropics followed, through various mechanisms, by large-scale ocean eutrophication and massive plankton die-off.
Discussion and conclusions
These arguments suggest a mechanism by which, given initially sufficient available metabolic free energy, a self-referential upward ratchet or sequence of ratchets in levels of biological organization – like the famous eukaryotic transition – become possible. It is, however, quite striking that such transitions, in this model, are necessarily associated with, and indeed indexed by, groupoid symmetry changes in the mechanisms of gene expression, bringing a central perspective of physical theory – symmetry breaking – into the study of the most central of biological processes. This observation gives new support to arguments that understanding the modalities of cognitive gene expression, centring on regulation, provides deeper insight into evolutionary and other biological phenomena than does the current narrow focus on genes themselves. Indeed, simplistic gene-centred views constrain research efforts and deform not only evolutionary theory, but our understanding of developmental pathologies and disease processes (Wallace & Wallace Reference Wallace and Wallace2016; Wallace Reference Wallace2017).
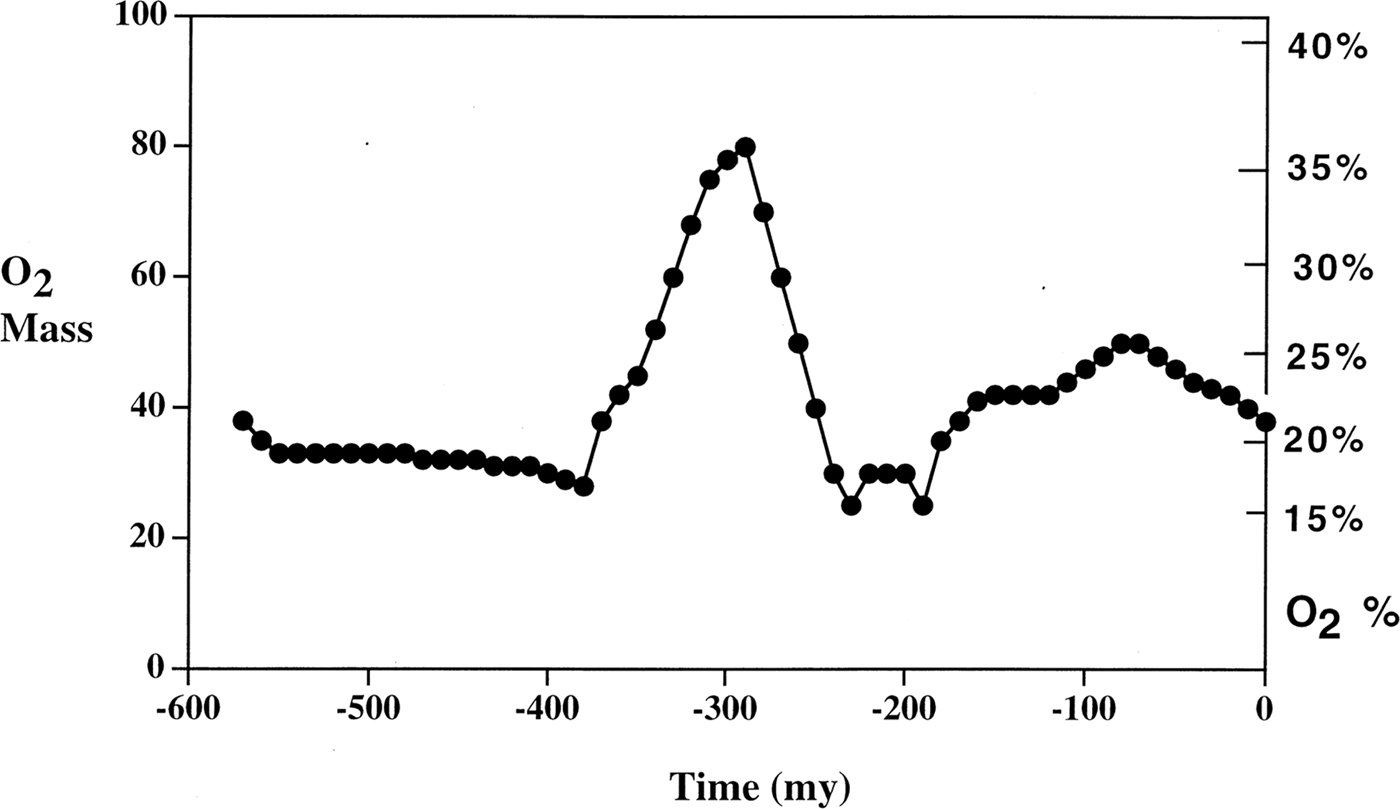
Another central question, as raised by one reviewer, is whether ρ, κ, μ and σ can be directly related to the observable characteristics of Earth or other planets. While an answer is beyond the scope of this paper, which is limited to formal characterization of underlying mechanism, there are some hints in existing data. Figure 1, from Berner (Reference Berner1999), shows an estimate of oxygen concentration in Earth's atmosphere over the last 550 million years, using a sediment abundance model.

Fig. 1. From Berner (Reference Berner1999). Oxygen concentration dynamics for Earth over the last 550 million years.
Apparently, Earth's oxygen concentration is highly dynamic, depending critically not only on present parameters, but on a path-dependent ecosystem/evolutionary trajectory. Such processes are not predictable without historical data, difficult for Earth and even more so for astrobiology.
For Earth, however, some relevant comment is possible.
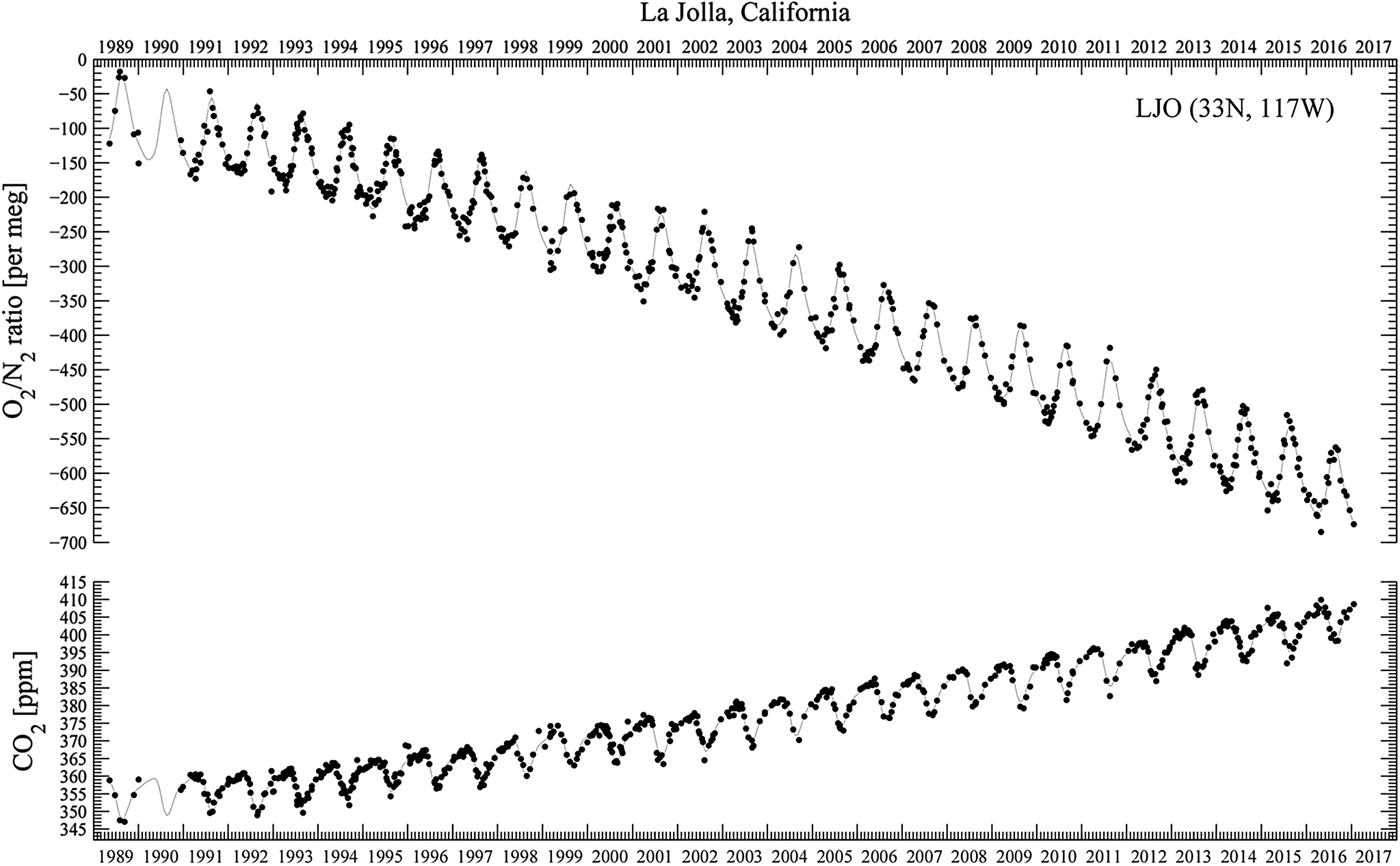
Figure 2, from the Scripps O2 Program (Scripps 2017), superimposes rising carbon dioxide and falling oxygen levels from 1985 through 2016. The decline for oxygen is approximately 19 molecules per million per year. Continuing at this rate of loss, atmospheric oxygen concentration would be cut by a half in only 26 000 years, hardly a deep-time effect.

Fig. 2. From the Scripps O2 Program. Downward trend in oxygen concentration, 1985–2016, and upward trend in carbon dioxide concentration. The upper panel shows oxygen concentrations as changes in oxygen/nitrogen ration in meg units. The lower panel shows carbon dioxide concentrations in ppm units. Points are daily average concentrations, and curves are fit to the data using a spline with a controlled stiffness and a 4-harmonic fit. The falling O2 level corresponds to losing 19 oxygen atoms per million per year. Atmospheric oxygen concentration, at this rate of loss, halves in 26 000 years.
Another – possibly synergistic and far more rapid – scenario would be that, under an unregulated ‘big business’ agroecology, overfarming of tropical landscapes causes widespread desertification, with associated runoff and global climate change that seriously disrupt oceanic phytoplankton life cycles, leading to large, spreading dead zones and triggering a more rapid decline in global oxygen concentration.
Economic-like ratchets, depending on the details, may move in either direction, and can have a broad spectrum of time constants, both matters requiring deeper study than provided here.
Mathematical appendix: groupoids
Given a pairing, connection by a meaningful path to the same basepoint, it is possible to define ‘natural’ end-point maps α(g) = a j, β(g) = a k from the set of morphisms G into A, and a formally associative product in the groupoid g 1 g 2 provided α(g 1 g 2) = α(g 1), β(g 1 g 2) = β(g 2), and β(g 1) = α(g 2). Then the product is defined, and associative, i.e. (g 1 g 2)g 3 = g 1(g 2 g 3), with inverse defined by g = (a j, a k), g −1 ≡ (a k, a j).
In addition, there are natural left and right identity elements λg, ρg such that λg g = g = gρg.
An orbit of the groupoid G over A is an equivalence class for the relation a j ~ Ga k if and only if there is a groupoid element g with α(g) = a j and β(g) = a k. A groupoid is called transitive if it has just one orbit. The transitive groupoids are the building blocks of groupoids in that there is a natural decomposition of the base space of a general groupoid into orbits. Over each orbit, there is a transitive groupoid, and the disjoint union of these transitive groupoids is the original groupoid. Conversely, the disjoint union of groupoids is itself a groupoid.
The isotropy group of a ∈ X consists of those g in G with α(g) = a = β(g). These groups prove fundamental to classifying groupoids.
If G is any groupoid over A, the map (α, β) : G → A × A is a morphism from G to the pair groupoid of A. The image of (α, β) is the orbit equivalence relation ~G, and the functional kernel is the union of the isotropy groups. if f : X → Y is a function, then the kernel of f, ker(f) = [(x 1, x 2) ∈ X × X : f(x 1) = f(x 2)] defines an equivalence relation.
Groupoids may have additional structure. As Weinstein (Reference Weinstein1996) explains, a groupoid G is a topological groupoid over a base space X if G and X are topological spaces and α, β and multiplication are continuous maps. A criticism sometimes applied to groupoid theory is that their classification up to isomorphism is nothing other than the classification of equivalence relations via the orbit equivalence relation and groups via the isotropy groups. The imposition of a compatible topological structure produces a non-trivial interaction between the two structures. Below we will introduce a metric structure on manifolds of related information sources, producing such interaction.
In essence, a groupoid is a category in which all morphisms have an inverse, here defined in terms of connection by a meaningful path of an information source dual to a cognitive process.
As Weinstein (Reference Weinstein1996) points out, the morphism (α, β) suggests another way of looking at groupoids. A groupoid over A identifies not only which elements of A are equivalent to one another (isomorphic), but it also parameterizes the different ways (isomorphisms) in which two elements can be equivalent, i.e. all possible information sources dual to some cognitive process. Given the information theoretic characterization of cognition presented above, this produces a full modular cognitive network in a highly natural manner.
Brown (Reference Brown1987) describes the basic structure as follows:
A groupoid should be thought of as a group with many objects, or with many identities…A groupoid with one object is essentially just a group. So the notion of groupoid is an extension of that of groups. It gives an additional convenience, flexibility and range of applications…
EXAMPLE 1. A disjoint union [of groups] ![]() $G = \cup _{\rm \lambda}\,\, G_{\rm \lambda}, \,{\rm \lambda} \in \Lambda $, is a groupoid: the product ab is defined if and only if a, b belong to the same G λ, and ab is then just the product in the group G λ. There is an identity 1λ for each λ ∈ Λ. The maps α, β coincide and map G λ to λ, λ ∈ Λ.
$G = \cup _{\rm \lambda}\,\, G_{\rm \lambda}, \,{\rm \lambda} \in \Lambda $, is a groupoid: the product ab is defined if and only if a, b belong to the same G λ, and ab is then just the product in the group G λ. There is an identity 1λ for each λ ∈ Λ. The maps α, β coincide and map G λ to λ, λ ∈ Λ.
EXAMPLE 2. An equivalence relation R on [a set] X becomes a groupoid with α, β : R → X the two projections, and product (x, y)(y, z) = (x, z) whenever (x, y), (y, z) ∈ R. There is an identity, namely (x, x), for each x ∈ X…
Weinstein (Reference Weinstein1996) makes the following fundamental point:
Almost every interesting equivalence relation on a space B arises in a natural way as the orbit equivalence relation of some groupoid G over B. Instead of dealing directly with the orbit space B/G as an object in the category S map of sets and mappings, one should consider instead the groupoid G itself as an object in the category G htp of groupoids and homotopy classes of morphisms.
It is, in fact, possible to explore homotopy in paths generated by information sources.
Acknowledgements
The author thanks Dr D.N. Wallace for useful discussions on aquatic ecology and an anonymous reviewer for remarks useful in revision.


