


INTRODUCTION
In 2018, the Southern Poverty Law Center (SPLC) documented 1,020 hate groups operating in the United States, the highest number in over a decade. Hate groups have historically existed in all 50 states and the District of Columbia. Some of these organizations operate as legitimate businesses, lobbying organizations, and political movements (SPLC 2019). There have been a wide range of hate groups active throughout the United States and around the world, many of whom have had, or continue to have, charismatic leaders. Of course, some of the best known include the Ku Klux Klan, the neo-Nazis, and the Skinhead movement. These groups, however, are not the only domestic or international threats that have coalesced around a charismatic leader. Charismatic leaders have appeared in terrorist organizations, domestic threat groups and fringe political movements with violent agendas. Groups have formed around charismatic leaders at both extremes of the political spectrum, both the far right and the far left. Charismatic leaders have been active in single-issue groups, such as anti-abortion and anti-immigration movements. Even though the number of active hate groups in the United States dropped to 940 in 2019, civil unrest on racial and socio-political fronts has been rampant in the United States (SPLC 2020).
For the current study, white supremacy groups are the focus of the agent-based simulation models (ABMs) aimed at determining how hate groups form. Limiting the analysis to this subset of hate groups has the added effect of sharpening the focus on a specific, more homogeneous portion of hate groups who have similar ideologies and target similar minority groups. Plus, the parameters examined in this research, societal hate and charismatic leadership, have a well-documented history for these groups. William Simmons, Sam Green, Samuel Bowers, Robert Shelton and David Duke were among the better-known charismatic leaders of the Ku Klux Klan (Chalmers Reference Chalmers1987; Wade Reference Wade1987). Klan activities before, during and after the Civil Rights Movements of the 1950s and 1960s illustrate how hate groups interact with the greater community during times of low, medium, and high societal hate (Chalmers Reference Chalmers1987; Wade Reference Wade1987). The Klan reached out to the public through television and magazine interviews, as well as acts of terroristic violence and used the social and political climate to its advantage in recruitment and seeking political and social support for its activities (Chalmers Reference Chalmers1987; Wade Reference Wade1987). Another hate group in the United States that relied on charismatic leadership was the Order, founded by Robert Matthews (Hamm Reference Hamm2007). Matthews hoped to use his organization to ferment an Aryan revolution in the United States in the 1980s (Hamm Reference Hamm2007). His death in a shootout with the Federal Bureau of Investigation raised him to the status of a white supremacist martyr (Hamm Reference Hamm2007). While the Klan has had thousands of members throughout history, other groups like the Order had only fifty core members (Wade Reference Wade1987; George and Wilcox Reference George and Wilcox1996; Hamm Reference Hamm2007).
CHARISMATIC LEADERSHIP AS THE DRIVING CAUSE OF GROUP FORMATION
As previously noted, hate groups, such as the Ku Klux Klan and the Order, have had numerous charismatic leaders rise to the forefront of the movement. Much of the scholarly literature regarding how charismatic leadership influences group formation has focused on theoretical explanation and description of these phenomena. Research in criminology has touched upon the role of charismatic leadership as relevant to studies of ethnic and youth gangs (Hughes and Short Reference Hughes and Short2006; Brown and Wilson Reference Brown and Wilson2007), Asian organized crime groups (Lindberg et al. Reference Lindberg, Petrenko, Gladden and Johnson1998), and some drug gangs (Paoli Reference Paoli2004). Among the original theories of charismatic leadership is Max Weber’s (Reference Weber1947) identification of the charismatic leader as one whose authority rested on the population’s “devotion to the specific sanctity, heroism, or exemplary character of an individual person and of the normative pattern or order revealed by him” (Weber Reference Weber1947:328).
Charisma is a characteristic based on the leader’s beliefs about his position, his power and, his destiny (Ulman and Abse Reference Ulman and Abse1983). It also includes the faith the leader’s followers have in him and his message (Ulman and Abse Reference Ulman and Abse1983). The relationship between a charismatic leader and his followers is a symbiotic relationship (Weber Reference Weber1947). The presence and loyalty of the followers and their belief in the charismatic leader assist the charismatic leader in her maintenance of her position and power (Weber Reference Weber1947). Charisma can be possessed by either positive or negative leaders, megalomaniacs, or saints (Volkan Reference Volkan1980; Howell Reference Howell, Conger and Kanungo1988; Popper Reference Popper2000). The charisma itself is neutral. It is the power wielded by the individual and the resulting behavior of his followers that makes charismatic leadership dangerous or desirable (Volkan Reference Volkan1980; Howell Reference Howell, Conger and Kanungo1988; Popper Reference Popper2000).
When a group has a charismatic leader, the group is an extension of its leader and his ideas (Tucker Reference Tucker1968). Part of the success of a charismatic leader is the historical and socioeconomic factors surrounding their rise to power or acquisition of followers (Wilner and Wilner Reference Wilner and Wilner1965; Tucker Reference Tucker1968). One thing that has made the charismatic leaders of white supremacist hate groups so successful has been their attention to their social and political environment and being aware of their supporters and detractors (Wilner and Wilner Reference Wilner and Wilner1965; Tucker Reference Tucker1968). This social and political environment is the basis for running variants of the proposed models at different levels of societal hate, simulating varying levels of popular support. Often the charismatic leader offers hope or deliverance as the draw for followers (Tucker Reference Tucker1968). If potential followers do not feel hopeless or in need of rescue, they will not follow (Tucker Reference Tucker1968). Charismatic leaders are usually placed in two categories: those who are seeking personal gain and those who use their power to serve or assist others (Howell Reference Howell, Conger and Kanungo1988; Howell and Avolio Reference Howell and Avolio1992).
Another major aspect of a charismatic leader’s sphere of influence is who identifies with his message. The more influential the leader, the broader his audience. This message may continue long after he is dead. Examples include the rhetoric and ideology espoused by Adolf Hitler, which still strongly influence neo-Nazis and racist skinheads. These groups have accepted his message and his views as part of their collective identity. A charismatic leader expands upon collective identity and often highlights the situations facing his followers and elevates them through rhetoric, focusing on their homogeneity.
RESEARCH QUESTION
The research question is: Does the presence of a charismatic leader influence variations in the attributes of hate group formation?
Hypothesis 1a (H1a) is: The presence of a charismatic leader will increase the number of groups that form.
Hypothesis 1b (H1b) is: The presence of a charismatic leader will increase the speed at which hate groups form.
Hypothesis 1c (H1c) is: The presence of a charismatic leader will increase the size of the hate groups that form.
These hypotheses build on the first tenet of Weber’s (Reference Weber1947) theory of charismatic leadership. Weber (Reference Weber1947) asserts that groups need a charismatic leader or form due to their members’ susceptibility to charismatic leadership. The presence of a charismatic leader in the environment gives a group someone to coalesce around. Because the group has a specific focal point, the speed at which the group forms should increase. The draw or influence of a charismatic leader, as a focal point for group formation, also should increase the number of individuals who join that leader’s group.
Illustrative of these hypotheses is Adolf Hitler, who inspired Nazi hate groups to form within Germany, where he had some direct influence (Goldhagen Reference Goldhagen1996; Gellately Reference Gellately2001; Kershaw Reference Kershaw2008). Even after his death, he still inspires groups both in the United States and abroad (Hamm Reference Hamm1994a,Reference Hamm and Hamm1994b; Ezekiel Reference Ezekiel2002; Fritzsche Reference Fritzsche2008; Kershaw Reference Kershaw2008). For example, California White Aryan Resistance formed around Tom Metzger, who was inspired by Hitler. His supporters in skinhead and neo-Nazi groups actively recruit new members across the country, distributing pamphlets and recordings of white power rock to potential recruits (Langer Reference Langer2003).
Hypothesis 1d (H1d) is: The greater the level of societal hate, the greater the number of groups that form around the charismatic leader.
Hypothesis 1e (H1e) is: The greater the level of societal hate, the greater the speed at which hate groups form around the charismatic leader.
Hypothesis 1f (H1f) is: The greater the level of societal hate, the greater the size of the hate groups that form around the charismatic leader.
Charismatic leaders exist within a larger society. A leader cannot lead if there is no one to follow him; his charisma is perpetuated by the existence of his loyal followers. A charismatic leader cannot rise to power or gain followers if his message is not favorably received. The charismatic leader’s presence has historically been a catalyst to group formation; given the right social and political climates, a charismatic leader’s rise to power can be very rapid. Even in situations where a charismatic leader is not seeking political power, this catalytic element of his presence does appear to result in the quick acquisition of supporters and followers. The charismatic leader’s presence and rhetoric often have some influence or sway over the beliefs of those around him. However, not everyone in the presence of a charismatic leader is immediately under that person’s thrall. Some individuals react negatively to the message of a charismatic leader.
Because of this, the level of societal hate is important to consider. In a society with low average hate, there would be fewer individuals who are likely to be influenced by the charismatic leader’s message. By contrast, if societal hate is higher, members of society would be more receptive to the leader’s message and he would acquire more supporters. Although a charismatic leader may draw together a small group of supporters when societal hate is low, he is more likely to draw a large group of followers when societal hate is higher. Levels of societal hate in the models are designed to mimic the societal and environmental factors. There was a high level of social uncertainty and unrest present when Adolf Hitler drew his followers together after World War I and when the leaders of the Ku Klux Klan drew record numbers of supporters during the 1920s and the Civil Rights Movement.
Adolph Hitler’s rise to power best illustrates these hypotheses. Hitler held a great deal of influence over the beliefs of his direct followers and the rest of his country regarding their racial superiority and how their supposed inferiors should be treated (Kershaw Reference Kershaw2008). Rallies, public appearances, and radio addresses expanded his sphere of influence until he became a pervasive force in Germany (Kershaw Reference Kershaw2008). However, not all Germans followed Hitler. German dissidents attempted to assassinate and sabotage Adolf Hitler, even at the height of his power (Kershaw Reference Kershaw2008).
SIMULATION MODELING BASICS
A simulation model distills a social or natural phenomenon down to its most basic working parts (Gilbert and Troitzsch Reference Gilbert and Troitzsch2005; Epstein Reference Epstein2007; Miller and Page Reference Miller and Page2007). It is a “bare-bones” representation of the real world (Gilbert and Troitzsch Reference Gilbert and Troitzsch2005; Epstein Reference Epstein2007; Miller and Page Reference Miller and Page2007). When modeling social phenomena, the model is a representation of a combination of location and people interacting within that location (Gilbert and Troitzsch Reference Gilbert and Troitzsch2005; Epstein Reference Epstein2007; Miller and Page Reference Miller and Page2007). The location is the environment; it stands for the general milieu of the model. It can be specified to mirror a city or a rural area, or it can be programmed to be very generic, simply simulating an open space in which people interact. The people interacting in the model are designated as agents. Agents are the representation of the “who” or “what” the modeler is investigating. In models of social events or behaviors, agents are digital representations of human beings (Gilbert and Troitzsch Reference Gilbert and Troitzsch2005; Epstein Reference Epstein2007; Miller and Page Reference Miller and Page2007).
Agents have characteristics and behavior rules. In the same model, there are a variety of agents that have randomly assigned start values for characteristics and a specified set of behavior rules to govern the actions and decisions emitted by the agents.
Characteristics are traits that differentiate one agent from another. Starting values for these characteristics usually are randomly assigned at the beginning of a model run. Characteristics can encompass a wide variety of traits and demographics found in the real world. For example, an agent can have a specific profile to mirror a type of person in the real world, such as a college student (Gilbert and Troitzsch Reference Gilbert and Troitzsch2005; Epstein Reference Epstein2007; Miller and Page Reference Miller and Page2007). However, similar to empirical observations, the more variables or traits added to the mix, the more complex the model and the more likely it will obscure the specific interactions that result in the event or behavior of interest (Gilbert and Troitzsch Reference Gilbert and Troitzsch2005; Epstein Reference Epstein2007; Miller and Page Reference Miller and Page2007).
Thus, it is considered in simulation modeling that less is more. Characteristics can be altered or even removed from the model in successive runs to determine whether there is a relationship between the characteristics and the behavior, or whether something else is involved (Gilbert and Troitzsch Reference Gilbert and Troitzsch2005; Epstein Reference Epstein2007; Miller and Page Reference Miller and Page2007). Behavior rules guide the agents’ activity (Gilbert and Troitzsch Reference Gilbert and Troitzsch2005; Miller and Page Reference Miller and Page2007). Behavior rules can be complex or simple (Epstein Reference Epstein2007). A simple rule would move an agent a fixed distance in a random direction. A complex rule would build on that action, asking the agent to take into account the agent’s perception of traffic density and personal energy level before adding in a random factor. Both rules require the agent to do something, but one is far more complicated than the other. Behavior rules are designed not to be predictive but rather to represent essential components of decisions (Gilbert and Troitzsch Reference Gilbert and Troitzsch2005; Epstein Reference Epstein2007; Miller and Page Reference Miller and Page2007). The decisions that agents make stem from their consideration of the behavior rule but add a randomly generated number, which represents information not included in the model that can change the decision to a different one. The goal of a simulation model is to identify the smallest number of characteristics and simple rules that result in the computerized agents mimicking the “real-world” behavior of interest (Gilbert and Troitzsch Reference Gilbert and Troitzsch2005; Epstein Reference Epstein2007; Miller and Page Reference Miller and Page2007).
Because some social phenomena take longer to occur than others, time becomes a factor. Behavior rules are sometimes designed to inform agents that they should ‘sleep” for a certain period during each representation of a day. In a simulation model, time also is controlled by the programmer. The modeler makes the decisions about how time will work in a model (Gilbert and Troitzsch Reference Gilbert and Troitzsch2005; Epstein Reference Epstein2007; Miller and Page Reference Miller and Page2007). A model runs through a set number of steps. When the model finishes its run, the “clock is up” for the agents in the model. A model can simulate what the agents do in a brief period, such as a few minutes or a more extended period, like years (Gilbert and Troitzsch Reference Gilbert and Troitzsch2005; Epstein Reference Epstein2007; Miller and Page Reference Miller and Page2007).
Each run of a simulation model produces data. Data are stored in a separate log file for each run (Gilbert and Troitzsch Reference Gilbert and Troitzsch2005; Epstein Reference Epstein2007; Miller and Page Reference Miller and Page2007). Data can be collected continuously through the model run or only at specific points, such as the beginning, middle, and end of the model run. Data are exported into any statistical program and analyzed (Epstein Reference Epstein2007).
In terms of model validation, a successful model is one that creates the behavior of interest (Gilbert and Troitzsch Reference Gilbert and Troitzsch2005; Epstein Reference Epstein2007; Miller and Page Reference Miller and Page2007). Multiple model runs using the same programming are used to ensure that the model run that resulted in the behavior of interest was the result of chance alone. Multiple model runs using the same programming are used to see whether these replicate the previous model. To make sure there is variability between model runs, random number generators assign different levels to variables of interest, as well as the starting location and movement of the individual agents. If the model repeatedly results in the same outcome, even across a range of sensitivity testing, it is robust to changes in the tested value.
In terms of model verification, the accuracy of the programming code and the logic of behavior rules are typically checked by other modelers in order to identify and correct mistakes in the programming (Manson Reference Manson, Parker, Berger, Manson and McConnell2001). Further, sensitivity testing (varying different parameters slightly over initial model runs and noting the changes in outcome to determine the limits of the model’s application) is used (Manson Reference Manson, Parker, Berger, Manson and McConnell2001). In order to verify the models used in this research, each process was programmed separately, and print statements used to verify that the processes were running. Further, in watching the model update over the course of the initial individual process runs, key elements of processes were given visual cues. These visual cues included agents and background patches changing color. This allowed for a visual assessment of how the model was running, what agent behaviors were in place, whether or not time was divided properly, and whether agent characteristics were remaining static or changing.
As the processes were created, they were verified by S. F., who checked the programming language against the visual cues designed to highlight the processes and the print statements. The individual processes were then combined, allowing them to cascade into the full model for theory testing. The model at this point was rechecked by S. F., and all errors in programming language documented and corrected. The full models in the three experimental conditions (control, collective hate, and charismatic leadership) were run 100 times, each separate from the model runs for data collection. This output verified that the log files were populating correctly, and that the data generated by the models were within the ranges set for the different agent characteristics and behaviors of interest.
Each model is an alternative representation of how hate groups might form under different conditions. The variations maintain the simplistic representation of the world inherent in simulation modeling. Each model variation builds on the previous variations in order to make it possible to clearly identify which parameters are being manipulated.
METHODOLOGY
ABM Modeling Platform
There are many different ABM modeling platforms available. Each platform was designed for different purposes, and this makes it important to be aware of the specialization of the modeling platform.
The program chosen here was NetLogo. NetLogo is a simulation modeling program designed for examining social and natural events and activities and is well suited to the simulation of “complex systems that develop over time” (Wilensky Reference Wilensky1999:1). Nikolai and Madey (Reference Nikolai and Madey2009) highlight NetLogo’s accessibility, ease of operation, and its primary specialization as one geared towards the general social sciences. Because of this specialization, NetLogo has seen extensive use in the social sciences. Notably, NetLogo has been used to examine political behaviors and situations (Lustick, Miodownik, and Eidelson Reference Lustick, Miodownik and Eidelson2004; Kuznar and Sedlmeyer Reference Kuznar and Sedlmeyer2005), as well as for developing an understanding on how communities form, collective identities develop and cooperation between individual and groups (Burnett Reference Burnett2000; Lustik Reference Lustick2000; Flache and Macy Reference Flache and Macy2002; Berman et al. Reference Berman, Nicolson, Kofinas, Tetlichi and Martin2004; Lansing and Miller Reference Lansing and Miller2005). NetLogo has also been used to model how stereotypes and norms develop among and between groups (Hastie and Stasser Reference Hastie, Stasser, Reis and Judd2000; Kohler Reference Kohler, Kohler and Gumerman2000; Brauer, Judd, and Jacquelin Reference Brauer, Judd and Jacquelin2001; Doreian Reference Doreian2001; Sun Reference Sun2001; Gotts, Polhill, and Law Reference Gotts, Polhill and Law2003; Gumerman, Swedlund, Dean, and Epstein Reference Gumerman, Swedlund, Dean and Epstein2003; Kenrick, Li, and Butner Reference Kenrick, Li and Butner2003; Lyons and Kashima Reference Lyons and Kashima2003; Sallach Reference Sallach2003; Adams and Markus Reference Adams, Markus, Schaller and Crandall2004; Agar Reference Agar2005; Aoki, Wakano, and Feldman Reference Aoki, Wakano and Feldman2005).
Programming
NetLogo is programmed using the computer programming language Java, but modelers use simplified language proprietary to NetLogo to program their models (Wilensky Reference Wilensky1999). Programming is kept rather simple. Programming is divided into procedures; the number of procedures varies depending on model complexity. Table 1 shows an example of a portion of the programing with explanation as it pertains to the models used herein.
Table 1. Procedures, Programming, and Explanation

Random Numbers
Because it is impossible to know or account for the interactions that make up every situation, a degree of randomness is necessary so that some other factor could come into play. Thus, an agent could evaluate an invitation based on the relative difference in hate levels and find it attractive, but once the error term is added, it could decide not to join. The distribution of the random number generator reflects the modeler’s best estimate about the probabilities involved. If there is no basis for preferring one over the other, a uniform distribution is used because there is an equal chance that any number in the range will be selected. If a low value is expected most of the time (i.e. that random factors are not important), a Poisson distribution is utilized so that more often, the number generated will be closer to 0. The random term is generated from a normal random number distribution and ranges from X to X. The reason for the random generation of a response is to simulate the interaction between people whose ideology or level of hate is the same but have different opinions on what should be done or how their beliefs are expressed.
In NetLogo there are eight different ways in which random numbers are used. These are: random-xcor/ycor or pxcor/pycor, random-seed number, random, random-float, random-exponential mean, random-gamma alpha lambda, random-normal mean standard-deviation, and random-Poisson mean. The first, random-xcor/ycor, or pxcor/pycor, places agents within the environment. Random-xcor/ycor places the agents at random x and y coordinates anywhere in the model landscape. Random pxcor/pycor places agents randomly to the center of patches within the model landscape.
The second, random-seed number, provides an integer for a pseudo-random number generator. The third, random, and fourth, random-float, report a number of 0 or greater to a point pre-set by the programmer. In this research, random-float was used for agreements and disagreements and error terms in group formation. Random was used to assign numbers within a range for extrinsic hate, motivation, and susceptibility. Random also assigned values after agreements or disagreements were made between agents to separate the agents and cause them to seek out other agents. In this second case, the command “random 360” was given, causing both agents to turn away from each other and move away at the random angle assigned by the program to seek out another agent. When the distribution of numbers is critical, NetLogo provides a series of options random-exponential mean, random-gamma alpha lambda, random-normal mean standard-deviation, and random-Poisson mean.
This research used random-Poisson mean, where mean was replaced with 2, 4, 6, or 8, depending on the level of societal hate for the model run. This means that intrinsic hate was randomly distributed according to a Poisson distribution centered on the level of societal hate in the model. When societal hate could change based on agent behavior, dramatic changes in levels of societal hate could happen in a short time frame. For example, if on day 100 half the agents had not made an agreement, they could all change their intrinsic hate at the same time and cause significant changes in the societal hate of the model. This sudden shift in societal hate is rare in the real world. It only occurs when there is a precipitating event, such as an act of extreme intergroup violence, i.e. the murder of Mary Phagan (Frey and Thompson Reference Frey and Thompson2002). Because of this, the fluctuation of societal hate in models where it has been allowed to vary due to agent behavior is noted in the log file, and the data collected for future analysis and research. In model runs that were absent of societal hate, where societal hate was not an included variable, intrinsic hate was treated like extrinsic hate and declared as random for the intrinsic hate range.
Model
The purpose of the model designed for this research was to test the influence of charismatic leadership on hate group formation. Hate group formation is examined through theory and retrospective. Although some histories exist for well-known hate groups, such as the origins of the Ku Klux Klan, the proliferation of hate groups in the United States and elsewhere over the past 10 years increases the need to understand how hate groups form. The structure of the model is simplistic. Individual agents in the model represent ordinary people. There is nothing extraordinary about the people who form or join hate groups. They are every-day, ordinary human beings.
Therefore, the agents in the model are the same. The agents are stripped-down versions of these ordinary human beings; they have an internal belief system (intrinsic hate), an external representation of their views (extrinsic hate), motivation, and susceptibility to charismatic leadership.
They do not have social status, education, or economic status, as these characteristics distract from the core problem. Hate group members have, historically, been drawn from all social and economic strata and a variety of educational backgrounds. The temporal scale of the model was a one-year period. This is a very brief period for hate group formation, or any type of group formation, but a manageable period, as the SPLC measures the number of active hate groups in the United States on a yearly schedule. For the agents in the model, this scale was subdivided into six-hour blocks, measured by one tick of the model’s run time. The agents’ motivation process was directly tied to these ticks.
Motivation is one of the critical processes in the model. When the model is programmed to motivate the agents, it is the start of all other processes. Motivation has three categories. The most motivated agents are active 18 hours a day. The agents in the second category are active 12 hours a day. The least motivated agents are active only six hours a day. When the motivation process begins, the agents who are motivated to be active during that time period begin the communication process. Those who are not motivated to be active during that period do not initiate the communication process.
The communication process governs the interaction between agents. The agents are programmed to look for other agents within their current patch who present themselves (extrinsic hate) as having similar beliefs (intrinsic hate). When an agent finds another agent who fits this qualification, the agent approaches that agent, and they discuss their beliefs. This process is within the communication process, where the agents compare their views (intrinsic hate to extrinsic hate). The agents are not mind readers, so they are comparing the external representation of each other’s beliefs (extrinsic hate) to their own internal beliefs (intrinsic hate). The next step of this process is the agreement/disagreement process.
The agreement/disagreement process takes place when the agents have made this comparison of beliefs and are determining whether they agree with each other. In some cases, the two agents will appear to agree on the surface (extrinsic hate of Agent 1 = extrinsic hate of Agent 2). However, this façade does not reveal their internal beliefs, and they immediately disagree and seek other connections. In other cases, the agents will agree on the surface and internally (extrinsic hate of Agent 1 = intrinsic hate of Agent 2). These agents are most likely to form a connection. However, everyone knows there is more to making a connection with another person than shared beliefs. Because of this, the process for agreements has a random chance associated with it. The program essentially “tosses a coin” to determine whether this connection exists. If there is a connection, both agents keep track of who it was they agreed with and move on to seek other connections. If there is not a connection, the same process as the immediate disagreement comes into play.
If an agent does not manage to make any connections in 100 days, a new process comes into play. The agent is allowed to change its mind (intrinsic hate). There are no core rules that govern how the agent changes its mind (intrinsic hate), but if the agent chooses to change, all internal characteristics of the agent change (intrinsic hate, motivation, susceptibility). Although most people change their mind more than three times a year, the idea here is that intrinsic hate is a long-held core belief, not a transient dislike that may change with time and experience.
Whether or not an agent is making connections after each agreement or disagreement, the agents can change their outward appearance (extrinsic hate). This process allows the agent to reset its extrinsic hate to any amount. This allows an agent to change its outward representation of its beliefs up or down, in turn giving itself an increased likelihood of forming connections. The agents want to make connections, because they are representations of human beings, which are social animals.
When an agent has tallied a total of five or more connections (agreements), the group formation process comes into play. The group formation process does not require that the agents be near each other when the tally reaches five. This is like a group of friends deciding to form a club and contacting each other by phone, text message, or via social media (e.g. Twitter, Facebook). The agents are alerted to their possibility of group formation. A group does not form instantly, just as with the agreement process, the group formation process also has a random component. The model once again “flips a coin” to determine whether the group forms. If the group does not form, the agents keep their agreements, but continue seeking further connections. If the group does form, the agents populate a group agent and new characteristics as group members; commitment and fear are assigned. These new characteristics, in combination with the agent’s intrinsic hate, give the agents the option of staying with the group or leaving the group. A group can gain members from this point as its members make new connections.
Though the group was developed based on a series of connections, it is not a social network model. A social network model establishes pre-existing links between agents and then uses the agents’ pre-existing connections to form new connections (Friedman and McAdam Reference Friedman, McAdam, Morris, Mueller and McClurg1992; Carroll and Ratner Reference Carroll and Ratner1996; Doreian Reference Doreian2001). These pre-existing connections run contrary to the basic tenets of Hamm’s (Reference Hamm2004) collective hate that people are drawn together by an intense collective hatred. This collective hatred is not a pre-existing network of friends or acquaintances, but the synchronistic coming together of people with similar views and beliefs. Therefore, in these models, while agents bring in their connections, these connections are established in a more free-flowing fashion than a structured social network model. No behavior rule governs how many groups the agents can join, as their real-world counterparts can undoubtably have more than one group affiliation.
The processes in place when the group is populated are the option of changing intrinsic hate and dropping out of the group. The option for group-affiliated agents changing their intrinsic hate occurs after a group has formed and existed for 10 days. The agents may then increase or decrease their intrinsic hate, mimicking the real-world phenomenon of group radicalization or member disenchantment. When the agents choose to increase or decrease their intrinsic hate, they also reset their internal characteristics (motivation and susceptibility).
The second process in place when a group has formed is the agents dropping out of the group. When these agents joined groups, two new characteristics, fear and commitment, were assigned. Commitment is randomly assigned. Each agent determines its own level of fear based on the difference between the highest level of hate possessed by a member of the group and its own level of commitment. So, if Agent 1 has a level of commitment of 4 and the most extreme member of the group has a hate level of 7, Agent 1’s level of fear is 3.
An agent decides to leave the hate group if the mean level of hate for the group becomes twice that agent’s level of fear. Therefore, if an agent has a fear level of 3 and the mean level of hate for the group is 6, the agent will leave the group. No matter how much an individual buys into a group’s belief system or viewpoint, there is a point at which the group may advocate a position beyond an individual member’s comfort zone.
For some agents, this can be instantaneous: the minute their levels of fear and commitment are assigned, they may assess the group and leave. Dropping out of the group is governed by a calculation of the agent’s characteristics and the group’s characteristics:
 $${\rm{\mu H}} = 2{\rm{f}},$$
where μH is the mean intrinsic hate or the group level of hate, and f is the individual agent’s level of fear. No matter how much an individual buys into a group’s belief system or viewpoint, there is a point at which the group may advocate a position beyond an individual member’s comfort zone. For example, a person may hate a particular segment of the population with a blinding passion but may not want to engage in acts of violence against those individuals.
When agents leaves a group, they do not retain the commitment or fear characteristics. They are no longer members of the group, so they are no longer committed to the group. They also have left the situation that was causing or influencing their fear, so they are no longer afraid. They can join another group or even the same group later, at which time they would be assigned a new commitment level and have a new level of fear calculated. If a group’s membership falls below three members, the group dissolves. The log file keeps track of all group members’ levels of fear and commitment throughout their time in the group for later analysis.
Agents
Within these experiments, there were two kinds of agents: individual people and groups. Each model contained 500 individual agents. The agents’ characteristics are listed in Table 2.
Table 2. Individual Characteristics

RP, random Poisson; R, random.
a Included in the model but not used as an independent variable.
As previously discussed, when an agent leaves a group, its levels of commitment and fear are not retained. The agent is assigned a drop-out ID that tracks which groups it has left. These agents can join another group or even the same group later. If they do so, they would be assigned a new commitment level and have a new level of fear calculated.
Group agents serve as placeholders for the groups that will be formed by the individual agents. Each model contained 100 of these group agents. The group agents’ characteristics are listed in Table 3.
Table 3. Group Agent Characteristicsa

a Group agent’s characteristics are populated when a group forms.
b Included in the model but not used as an independent or dependent variable.
c Used to determine dependent variables: number of groups that formed, level of hate.
d Used to determine dependent variables: number of groups that formed and size.
Environment
As previously stated, the environment in a simulation model is at the discretion of the programmer. It can be very complicated, simulating a bustling metropolis with streets and hubs or merely an open field. The environment design for this simulation model was kept simplistic. The open field landscape was determined to be the best option to prevent interference from environmental factors that could change agent behavior. Therefore, the landscape for the model was composed of patches. Each agent was randomly assigned to a section of a patch at the start of the model run. From that point the agents were able to move to any patch they wanted as they interacted with other agents. Random assignment prevented situations where the location at which the agents interacted had more influence over group formation than the individual agent characteristics.
Hate groups have historically existed in all 50 states, in both rural and urban areas. They have formed internationally in rural and urban environments. Increasingly, they have found ways to congregate in the nebulous environment of the Internet. To mimic this, agents are randomly distributed across the open patch landscape. Random distribution does affect their earliest conversations with other agents. However, as the model run progresses, they are free to move throughout the landscape and speak with whomever they encounter who “looks” like a good prospect based on their extrinsic hate.
Data
Simulation modeling, by its very nature, is data-rich. Based on what information the modeler decides to collect, each model run can produce thousands of data points. In the programming for a simulation model, the programmer sets up a log file with the variables of interest and how often data should be recorded. Data are usually of three varieties, the value of a characteristic (i.e. intrinsic hate), a count of some action or behavior (i.e. agreements) or a list (i.e. the agent IDs of a series of agents in a group). Most of the data collected for this research were of the first two varieties. In this research, at each tick of the model run, the log file recorded data for all variables. Each model run in these experiments produced a log file for individual agent data and a second for group data. The 15,000 iterations used to create distributions of results produced a total of 15,000 individual agent log files, and 15,000 group log files for a total of 30,000 individual log files.
All total, there were 500 agents in each model and 730,000 data points per model, yielding a total of 10,950,000,000 individual data points of agent data. These data points included information regarding each agent’s level of intrinsic and extrinsic hate at any given time, the group or groups they joined, and the group or groups they had left if they dropped out of a group. There were 100 possible hate groups that could be populated per model. There were 146,000 data points per model. This yielded a total of 2,190,000,000 data points of group data. These data points included the number of members, the mean intrinsic and extrinsic hate of each group, and a list of agents who had joined and a list of agents who had left the group at any given time.
Because these datasets together were large enough to be unwieldy, cases were created from the data within the log files for the analysis dataset. The log files for agent data and group data were matched for each model iteration. Then the data from each of these files were used to create a single dataset where each model iteration became a single case within the dataset.
The log files provided the variables of interest, and the unique identifier for each agent in the agent log files and the group identifier in the group log files were listed across the top of the spreadsheet. The left-hand side of the spreadsheet listed the tick number when the data were collected. Therefore, at each tick in the model, the agent log file recorded the individual agent’s value on all characteristics. It also recorded the number of agreements and disagreements the agent had made up to that point. It recorded whether it had joined a group, left a group or stayed in a group. The group log file recorded the group characteristics at each tick of the model, listing the identifiers of agents who had joined a group, left the group, as well as their averages on the individual agent characteristics. Log files can become very large depending on the length of time the model iteration is running, the number of characteristics or actions that the file is programmed to keep track of, and the number of agents included in the model. That was the case with the log files used to collect data from the model runs documented here.
Dependent Variables
The dependent variables of interest for all models were number of groups that form, the speed at which groups form, and the size of the groups that formed. A list of the dependent variables, with their conceptual and operational definitions, is provided in Table 4.
Table 4. Dependent Variables
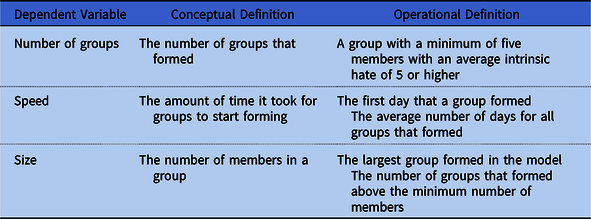
Number of groups is conceptualized as the number of groups that form over the course of a model run. Number of groups is operationalized as the number of groups of five or more agents that come together and form a group with an average intrinsic hate of 5 or higher.
Operationalizing these groups as needing an intrinsic hate of 5 or higher is based on the lowest level of societal hate used as an experimental condition in the models. The lowest level of societal hate used as an experimental condition in the models is 2; therefore, a group with an average intrinsic hate of 5 has a level of hate within their group of 2.5 times the level of societal hate. When societal hate is 4, these groups are those whose hate is 1.25 times the level of societal hate. When societal hate is 6 or 8, these groups with an average intrinsic hate of 5 have less intrinsic hate on average than the society. However, increasing the average hate required for a hate group to be counted in these situations would mean that the number of groups could not be compared across levels of societal hate. For this reason, the requirement of an average intrinsic hate of 5 or higher remains constant.
Speed is conceptualized as the amount of time it took for groups to start forming. This variable is operationalized in two different ways. The first is the first day the first group formed. This gives a snapshot of when groups started to form. The second is the average number of days, under the experiment conditions, it took for the groups to form. These two measures of speed give a good idea of what is happening regarding time in the model. Groups can start forming within the first day. If this happens, it may be due to a series of agents whose levels of hate are compatible being randomly assigned to the same patch within the model environment. This gives them an advantage towards group formation, like a group of potential skinheads all frequenting the same bar at the same time or similarly minded incels logging into the same chatroom. The average amount of time it took for all the groups to form gives a picture of all the activity in the model, offsetting this type of accident of circumstances.
Size is conceptualized as the number of members in a group. Just like speed, size is operationalized in two ways: the largest group that formed in the model and the number of groups larger than the minimum group size. The first measure gives an idea of how big the biggest group became over the course of the model run. The second measure looks at comparing how many of the groups that formed were larger than the minimum and endured for the model run. This second measure was preferable to a measure of the average number of members in all groups as the number of groups with only the requisite five founding members typically outnumbered the larger groups and would have skewed the mean. This second measure was taken at the end of the model run to account for changes in group membership over the course of the model run. Some groups may have had more than the requisite five members at one point during the model and lost members to drop-outs by the end of the model run. This also assured that no group was counted more than once.
Group Formation
A group is defined as having a minimum of five members. Fewer than five would be closer to the idea of a few friends who share a belief than an organized group. The number five was chosen to represent a hypothetical group with some internal structure, like a club with positions for a president, vice president, secretary, treasurer, and general membership. For the group to be counted as a hate group, the average intrinsic hate of the group must be 5 or higher. While groups may form at lower levels of average intrinsic hate, these groups are not counted in the analysis of hate group formation unless the average level of intrinsic hate in the group increases to the 5 or higher point during the model run.
As agents interact within the model, they make connections based on which agents share their views. Each agreement between agents begins a tally toward group formation. Once five agents are connected, the model randomly generates whether the group will form. If the chance generated a no response, the group did not form, though the connections remained intact. This represented those groups that may have had enough people in agreement, but for unknown reasons did not form. If the chance generated a yes response, everyone who connected through agreements was then populated into that group. An agent does not need to agree with every agent in the group. Once formed, groups are seeking new members and attempting to retain the members they already have. Within the group, as agents change their views based on interactions with one another and group membership, the relationships become more pronounced. However, should a group’s membership fall below three members, the group dissolved.
Independent Variables
The independent variables of interest are the characteristics of the individual agents. A list of these variables is shown in Table 5. The independent variables of interest for all models were intrinsic hate, extrinsic hate, the societal level of hate, and motivation. When a charismatic leader was present in experiments for testing the second set of hypotheses, the presence of the charismatic leader, as well as his level of charisma and the susceptibility of other agents to his message, become independent variables of interest as well. Each independent variable is examined for its individual effects. Combined effects are not examined in the analysis.
Table 5. Independent Variables

Random assignment for independent variables changed depending on which experiment was being used. In experiments where societal hate was part of the model, a Poisson distribution was used. When societal hate was not part of the model, random assignment was normally distributed. Due to the varying levels of societal hate, the Poisson distributions were skewed positively when societal hate was higher and negatively when societal hate was lower. Societal hate is both an experimental condition and an independent variable. The experiments were run at set levels of societal hate that were systematically changed between model runs, 1,000 each at societal hate 2, 4, 6, and 8, as well as 1,000 runs without societal hate included in the model for both the control and charismatic leadership experiments.
Intrinsic hate was conceptualized as the core personal belief of an agent, reflective of the extent to which agents had levels of hate commonly espoused by those adhering to a white supremacist ideology. Agents with lower levels of intrinsic hate have little-to-no core personal buy-in to the white supremacist ideology. Those with higher levels of intrinsic hate have an increasingly more substantial buy-in to the white supremacist ideology. They are “true believers,” individuals with an unshakeable belief in the tenets of the white supremacist ideology. Operationally, intrinsic hate was an interval-level variable with values ranging from 0 to 10. A zero reflects an absence of intrinsic hate, whereas a 10 reflects the highest amount of intrinsic hate possible.
Intrinsic hate is the level of hate that an agent has developed, presumably based on life experience or social or familial norms (or by prior exposure to others with similar levels of hate and/or a charismatic leader). Intrinsic hate is the type of hate that influences agents to either agree or disagree with others when contrasted with the other agent’s extrinsic hate. Agents are comparing the outward representation of other agents’ hate level (i.e. the other agents’ extrinsic hate level) to their own personal, core beliefs (i.e. their intrinsic hate level).
If the agent asking about the individual agent’s agreement has an extrinsic hate that is more than ±1 of the individual agent’s intrinsic hate, the agent immediately disagrees. The ±1 range was chosen in order to adhere closest to the ideas of the theory of collective hate; any range larger than ±1 would have created groups with members with widely disparate opinions and beliefs. If the membership has such widely varying opinions and beliefs, they would not be representative of the intense collective hatred theorized by Hamm (Reference Hamm2004). If the asking agent’s extrinsic hate falls within that range, the agent being asked “considers” what the asking agent is “saying.” The final decision is based on an equation that weighs the relative difference between the two agents and incorporates a random term representing unknown factors. In other words, two agents may come into contact, perceive each other to have similar views (±1 extrinsic hate), and begin a conversation. Throughout that conversation, the agents weigh what is being “said” against their internal views and beliefs (±1 intrinsic hate). This conversation is based on geographic proximity; that is, the agents must encounter one another. This contact occurs when the two agents are standing next to each other in the same unit of the model environment.
For example, two potential Klan members meet on the street. They are both wearing T-shirts with a logo from a popular white power rock group and have similar tattoos. They strike up a conversation based on this perceived common ground. During their conversation, one of the potential Klan members decides that the person he is conversing with is a little more extreme than fits his internal belief system, perhaps he hates minorities and has done a little vandalism, but the person he is talking with is discussing his desire to attack minority children at a local YMCA and kill as many as possible. This discussion has extended beyond the one potential Klan member’s internal views, his core beliefs, his intrinsic hate. If this violent Klan member approached him about a new group that was forming, the non-violent potential Klan member would be disinclined to join it.
In the model, the programmer tells the agents to look at the other agents nearby and seek out those agents whose extrinsic hate (their outward appearance or profession of hate) is within ±1 of their intrinsic hate (their internal core beliefs). When the agent spots another agent that fits this criterion, the agent is instructed to communicate with that agent. The agents communicate by exchanging information about their extrinsic hate; in other words, they size each other up as to whether they agree on their hate ideology on the surface. If they agree on the surface, the approached agent considers the approaching agent’s views internally. That is, they compare what this agent is presenting to them through their extrinsic hate with their internal views, their intrinsic hate. If the extrinsic hate falls within ±1 of the agent’s intrinsic hate, the agent decides whether they agree. This agreement is contingent on a random chance, an error term that is presented by the model. The application of the error term allows for two agents who have the right values on their characteristics, intrinsic v. extrinsic hate to disagree, based on some non-programmed factors, such as poor hygiene or a repulsive habit. While Hitler was a great orator and passionate in his message, his personal habits and mannerisms made him someone that most people would not be comfortable with should they meet him on the street (Gellately Reference Gellately2001; Fritzsche Reference Fritzsche2008; Kershaw Reference Kershaw2008).
Intrinsic hate is not something that an agent can vary at random, but it can change based on situation or experience when the conditions listed in Table 6 are met. There is not a set limit on how much agents can change their levels of hate when they comply with the time limits set by the behavior rules. Each model runs for the equivalent of one year, 365 days, so the decision to allow intrinsic hate to change (when not in the control model) after 100 days without an agreement was made based on the idea that this is someone’s core internal belief system feeding their intrinsic hate, and it would take a long time for them to change this internal system, nearly one-third of the model run. The change in intrinsic hate is left up to the agent; it has the option of resetting its internal variables (intrinsic hate, motivation, and susceptibility) at these time points.
Table 6. Conditions for Changing Perceived and Intrinsic Hate

After 100 days without making any agreements, agent may increase their intrinsic hate to replicate someone who finds this lack of agreement bolstering to their beliefs – as though they are saying, “no one agrees with me because they are all delusional or supporters of the thing I hate.” Agents may decrease their hate, replicating someone who finds this lack of agreement as a sign that there might be something amiss with their beliefs – similar to the experience of someone who developed an intense hatred for a racial or ethnic group that they had never encountered and changed their mind after learning more about that group.
Groups are prone to radicalization from within and strengthening of belief systems (Simmel Reference Simmel1955). Therefore, for group members, this decision to change intrinsic hate is one-tenth of the time as compared to when they do not have any agreements. For those who increase their intrinsic hate, these are those members who become increasingly radical; those who decrease their intrinsic hate are those who are made uncomfortable by the group’s viewpoint and distance themselves from the group. In the case of the agents following the charismatic leader, those who increase intrinsic hate are those who are riled up by the leader’s message and those who decrease their intrinsic hate are those who are being put off by the leader’s message.
If an agent changes its level of intrinsic hate, the new level of intrinsic hate is maintained until the agent enters a situation where one of the conditions in Table 6 is satisfied. This change is triggered by either the number of days that an agent does not register an agreement with another agent or the number of days it has been a member of a hate group. The agent has the option to reset its intrinsic hate; therefore, the level of intrinsic hate can increase or decrease any amount.
It should be noted that nothing in the programming code for the models biases an agent towards group membership. Group membership is based on agreements. The only influence that may affect an agent’s potential for group membership is the agent’s motivation. How motivated an agent is will affect how many opportunities the agent has to make agreements.
Extrinsic hate was conceptualized as how the individual agents present themselves to others. Extrinsic hate represents the extent to which they outwardly show support for a white supremacist ideology. Other agents would perceive agents with lower levels of extrinsic hate as having little or no interest in a white supremacist ideology. Likewise, other agents would perceive agents’ higher levels of extrinsic hate as having more interest and support for a white supremacist ideology. Operationally, extrinsic hate is an interval-level variable with values ranging from 0 to 10, where 0 reflects no extrinsic hate, and 10 reflects the greatest level of extrinsic hate possible. Extrinsic hate is randomly distributed; this is not a uniform normal distribution.
Extrinsic hate can vary at any time in all experiments except the control experiments. In the control experiments, extrinsic hate, just like all other characteristics, remains static. The reasoning behind this is that extrinsic hate is how the agent presents itself to its surroundings. This simulates the human behavior of changing clothes, showing a tattoo, or carrying a sign. It is the same as choosing different vocabulary or a different story when talking to another person. Because of this typical human behavior, the agents can change their extrinsic hate after each evaluation of the agents that are in closest proximity. The agents are asked if they see any other agents in their surroundings that have extrinsic hate that is ±1 of their intrinsic hate and are asked to pick one and communicate with that agent. If an agent finds someone or more than one person, that agent may not choose to change its extrinsic hate. If it does not find someone the agent may change its extrinsic hate. This choice is completely under the agents’ control in both the collective hate and charismatic leadership experiments.
In the charismatic leadership experiments, the leader agent possesses randomly assigned levels of intrinsic and external hate, as well as a level of charisma. The leader process is based first on the leader agent being assigned a level of charisma above 0. The charismatic leader agent then begins the same agreement/disagreement process as all other agents. The difference here is that the agents’ susceptibility comes into the decision process as to whether they agree with the charismatic leader. An agent makes the same intrinsic hate v. extrinsic hate assessment, but if their intrinsic hate matches up to the leader’s extrinsic hate (±1) it is their level of susceptibility that first determines their agreement rather than a random coin toss.
If they possess the highest level of susceptibility, they immediately agree. If they possess no susceptibility, they immediately disagree. The same random coin toss as the agreements and disagreements between regular agents is used for those with middle levels of susceptibility. When an agent disagrees with the charismatic leader, the leader tallies those disagreements, and they become a measure of the charismatic leader’s lack of support in the society. When agents agree with the charismatic leader, they identify themselves as followers of the leader, and the leader tallies their agreements and keeps a list of their identification numbers. The charismatic leader uses the agreement tally as a measure of his popularity in the society.
When a leader is active in society, his followers are given an extra benefit. They can change their internal belief system more often. Those agents can reset their internal characteristics (intrinsic hate, susceptibility, motivation) any amount at 10-day intervals after declaring themselves followers of the charismatic leader. If an agent decides to change its intrinsic hate to a value below the charismatic leader’s extrinsic hate, the agent can also take the opportunity to leave the charismatic leader’s fold. If it chooses to do so, it is removed from the charismatic leader’s list of followers and is no longer self-identified as a follower.
Societal hate was conceptualized as the degree to which the society in which the agents are interacting accepts white supremacists and their ideology. Lower values of societal hate are representative of less support for white supremacists and their ideology. Higher levels of societal hate are representative of a society that is more accepting of white supremacists and their ideology. Operationally, societal hate is an interval variable with values ranging from 0 to 10. It was calculated as the mean of the intrinsic hate possessed by all 500 agents present in that specific model.
Societal hate during the control experiments was held at fixed values of exactly 2, 4, 6, and 8 for the entire experiment. Any societal hate lower than 2 would be indicative of nearly Utopian societies; at level 0, the average hate for the society would be 0; at level 1, the average hate would be 1; this would result in hate being too rare a phenomenon in the society to measure. Likewise, societal hate higher than 8 results in societies so saturated with hate that it becomes increasingly difficult to separate the formation of hate groups. The society itself would be an informal hate group. Utopian societies and societies completely saturated with a hate ideology with no resistance are non-existent in the real-world, and as simulation models attempt to recreate real-world phenomena, these extremes would be outside the model scope. In all other experiments, the level of societal hate could increase and decrease, reflecting aggregate changes in the individual agents’ levels of intrinsic hate. In all models, when societal hate was allowed to vary and reflect aggregate changes in the individual agents’ levels of intrinsic hate, no matter what the starting point was, societal hate increased and decreased throughout the model run.
The log file recorded these changes in societal hate. Societal hate did not always increase, and it did not always decrease over time. When societal hate started lower, it tended to increase over the model run rather than decrease; when it started higher, it tended to decrease rather than increase. The log file recorded all variation in societal hate for all experimental models. In the analysis, societal hate at the starting point, the set societal hate at the beginning of the model, is used to differentiate between the model runs. While the changes in societal hate and the ending societal hate are recorded, for comparison purposes, the models are analyzed based on the level of societal hate with which they started.
Beginning societal hate was used in the analysis because it was the common starting point; this allowed for the direct comparison of the control condition and the two experimental conditions. Because societal hate could vary substantially within the same model run under the experimental conditions, this choice was made to maintain uniformity in the dataset. Time series analysis can be used in future examination of the data to make a more nuanced examination of the effect of changing societal hate on hate group formation in individual model runs. The levels of societal hate used in the control models are loosely defined and presented in Table 7. The literature on societal hate is limited to explanations of Nazi Germany, and levels of societal hate have not been presented in previous research. These levels are not concrete representations but provided to give the reader a point of comparison between the real world and the simulations.
Table 7. Societal Hate

Covariate of Interest
Motivation was conceptualized as the level to which an agent actively sought out relationships with other agents, how motivated the agent was to seek out individuals who might agree with his hateful beliefs. Operationally, motivation is an interval-level variable with values of 1 (equivalent to six hours of inactivity), 2 (equivalent to 12 hours of inactivity), and 3 (equivalent to 18 hours of inactivity). Each agent was inactive for at least six hours and as many as 18 hours. The decision to provide agents with at least six hours of inactivity was that this would account for at least a minimum amount of time that a person in the real world would spend asleep. An agent that is inactive only six hours is highly motivated because they are active for 18 hours. This is equivalent to someone who interacts with others for most of the time they are awake. Motivation is not static throughout the model run. If an agent chooses to change its level of intrinsic hate, the model also randomly reassigns a level of motivation. The motivation may be the same as before, or it may increase or decrease. An agent may increase its level of intrinsic hate, but the model may decrease its motivation. At the beginning of the run, the model randomly assigned a third of the agents to each level of motivation. See Table 8 for explanations of the different levels of motivation. These explanations are provided solely as a reference that explains individual agent behavior in real-world terms.
Table 8. Levels of Motivation

Control Condition
In the control condition, the agents were unable to alter their extrinsic or intrinsic levels of hate. Also, unlike subsequent experiments, agents in this condition were randomly assigned values for their levels of extrinsic and intrinsic hate that they were not able to alter. Societal hate was systematically assigned, and because intrinsic and extrinsic hate were not allowed to vary over the year modeled, this means that societal hate remained constant during each model. Intrinsic hate, which is the basis for societal hate, was randomly assigned using a Poisson distribution centered on the level of societal hate as the mean. See Table 9 for the conditions present in the control model concerning societal hate and agent characteristics. When societal hate was low, the intrinsic hate of all agents skewed to the low end. When societal hate was high, the intrinsic hate of all agents skewed to the high end. The dependent variables measured included number of groups that form, speed of group formation, and group size. The control condition (which represented what would happen in the absence of the ability to vary hate and form a collective identity (i.e. collective hate) and in the absence of a charismatic leader) across different levels of societal hate provided data for comparison to the experiments described next.
Table 9. Control Model and Conditions

Analytic Plan
All data generated by the log files of the experiments were analyzed using the statistical analysis program SPSS. The data were analyzed using a series of one-way, 2x4, and 3x4 analyses of covariance (ANCOVAs). ANCOVA was designed to expand upon the ideas of the analysis of variance. The analysis compares means of multiple groups as well as the interaction effects within those groups through the analysis of their variance (Harlow 2005). ANCOVA expands on this type of analysis by allowing for the inclusion of covariates, factors that may influence or predict the outcome, but are not part of the main experiment. In the analysis of the data produced by the collective hate experiments, the covariate of interest is motivation, how much time the agents spend seeking connections.
The model is programmed to keep track of all agent characteristics at every tick of the model. A log file is created at the start of the model run. All information for all individual and group agents is collected from that point until the end of the model run. Group agents that do not populate report zeros in all columns throughout the model run. The model runs through a series of iterations. In each interaction the society is perceived as accepting of a hate ideology from no societal hate to levels of 2, 4, 6, and 8, respectively, the level of societal acceptance of a hate ideology increasing at each level. All data generated by the log files of the experiments were analyzed using the statistical analysis program SPSS. The data were analyzed using a series of one way, 2x4 and 3x4 ANCOVAs.
RESULTS
Hypotheses H1a–H1c
These sections provide the results of the ANCOVAs examining the role that societal hate and charismatic leadership played in the variations observed in each of the three dependent variables: number of groups, group size, and speed of group formations. Table 10 provides a list of effects and representations for the ANCOVA results tables that follow.
Table 10. Effects and their Representations in Analyses of Covariance for Hypotheses H1a–H1f Results Tables

The results of the analyses related specifically to hypotheses H1a–H1c are presented in Table 11. For the first hypothesis, H1a, that examined the number of hate groups formed when a charismatic leader was included in the model, there was a significant effect for the experimental condition (F (1, 1,994) = 13.3, p<.001), and a marginally significant effect for motivation as a covariate (F (1, 1,994) = 2.8, p<.1). The charismatic leader model produced more groups than the control model.
Table 11. Analyses of Covariance for Control v. Charismatic Leadership (Hypotheses H1a–H1c)

Note: Means are given with standard deviations in parentheses.
a See Table 10.
For the second hypothesis, H1b, examining group size (first based on the largest group formed), there was a significant effect for the experimental condition (F (1, 1,994) = 20.7, p<.001). None of the covariates was statistically significant. The control model produced the largest groups. An examination of the log files showed that agents who agreed with the charismatic leader avoided agreements with agents who disagreed with the charismatic leader. This decreased the number of agents with whom the charismatic leader’s followers could form groups. This was an emergent property of the model because the agents were not given any specific behavior rules to influence their interaction with other agents based on the extent to which the agents supported or disapproved of the charismatic leader. When examining group size based on the number of larger groups formed, nothing was significant. The control model produced more larger groups, but the difference was not statistically significant.
In the last analysis in this series, the ANCOVA tested the third hypothesis, H1c, regarding how quickly the groups formed. The first of these analyses examined how long it took for the first hate group to form. In this analysis, there was a marginally significant effect for the experimental condition (F (1, 1,994) = 3.1, p<.1). On average, the first group that formed in the control model and the experimental condition was formed on the 12th day, with the groups forming in the charismatic leader models slightly earlier.
When looking at the mean formation time for all groups in days, there was a marginally significant effect for the experimental condition (F (1, 1,994) = 2.7, p<.1). On average, when looking at all the groups that formed, the average time for group formation was faster in the charismatic leader model, but only slightly.
Hypotheses H1d–H1f
This final section provides the results of the ANCOVAs comparing the control conditions to the experimental charismatic leadership condition in the models while taking into account the effect of societal hate, as outlined in the second set of hypotheses, H1d–H1f. The results of the analyses are presented in Table 12. The means and standard deviations are listed in sequence, beginning with the condition where societal hate was equal to 2, 4, 6, and 8, respectively.
Table 12. Analyses of Covariance for Control v. Charismatic Leadership (Hypotheses H1d–H1f, Effects of Societal Hate)

Note: Means are given with standard deviations in parentheses.
a See Table 10.
The first hypothesis in this set, H1d, examined the effect of societal hate on the number of hate groups formed. There was a significant effect for the experimental condition (F (1, 7,989) = 25.0, p<.001). The changing levels of intrinsic hate in the experimental condition had an impact on societal hate, which in turn impacts how the groups form in that model. Among the covariates, nothing was significant. In this situation, the control model produced more hate groups when societal hate was included, as compared to the scenario where societal hate was not included. This finding was unexpected, and examination of the log files showed that in some of the model runs where the charismatic leader was included, the charismatic leader started out acquiring detractors before supporters. In these situations, the number of supporters eventually acquired by the charismatic leader were outnumbered by the detractors. This decreased the number of hate groups that formed in those model runs, as the detractors often decreased their intrinsic hate at the first opportunity after meeting the charismatic leader. This was an emergent property of the model because agents were not given a behavior rule that would have caused them to decrease their intrinsic hate if they disagreed with the charismatic leader.
For the second hypothesis, H1e, examining group size (first based on the largest group that formed), there was a significant effect for the experimental condition (F (1, 7,989) = 47.2, p<.001). Of the covariates, there was a significant effect for motivation (F (1, 7,989) = 11.1, p<.001). The other covariates were not statistically significant. The control model produced the largest group in all situations. The log files showed a tendency by the charismatic leader’s supporters to avoid agents who did not agree with the charismatic leader and to drop their intrinsic hate and leave a group if the detractors of the charismatic leader joined that group. This resulted in groups having too much flux in membership to develop into the largest possible groups. The agents were not given any behavior rules regarding interaction based on support of the charismatic leader; therefore, these behaviors are emergent properties.
When examining group size based on the number of larger groups formed, there was a significant effect for the experimental condition (F (1, 7,989) = 227.9, p<.001). None of the covariates was statistically significant. In this situation, the charismatic leader model did produce a larger number of large groups, regardless of the level of societal hate. Another explanation from the log files shows there was a trend for groups that formed with more than one supporter of the charismatic leader in the initial five members to draw more of the charismatic leader’s supporters into the group throughout the model run. There is no programming that explains this behavior; it is an emergent property that helps explain why larger groups formed in the charismatic leader model scenarios.
In the last set of analyses, the ANCOVA tested the third hypothesis, H1f, regarding how quickly groups formed. The first of these analyses examined how quickly groups began to form based on when the first group formed. In this analysis, the only significant main effect was the experimental condition, and this was only marginally significant (F (4, 7,989) = 2.2, p<.1); motivation was also marginally significant as a covariate (F (4, 7,989) = 2.1, p<.1). The presence of the charismatic leader was expected to speed up group formation, no matter what level of societal hate was evident in the model. This was not the case. When societal hate was added to the models, the experimental condition resulted in the first group forming slightly after the control model’s groups. The log files showed that the agent behavior first identified in the explanation for H1e held true at all levels of societal hate. That is, agents who followed the charismatic leader were “disinclined” to agree with agents who disagreed with the charismatic leader. No matter what the level of societal hate, this not only affected group size when societal hate was included in the models but also increased the amount of time it took for some groups to form because this increased the amount of time between agreements for the charismatic leader’s followers.
When looking at the mean formation time for all groups, there was a significant effect for the experimental charismatic leadership condition (F (1, 7,989) = 155.6, p<.001). None of the covariates was significant. In all instances, the control model produced a faster average time of formation than the charismatic leader model. This is counterintuitive as the charismatic leader’s presence was expected to increase the speed of group formation. The log files showed that the agent behavior first identified in the explanation for H1e and identified as a factor in the formation of the first group held at all levels of societal hate. That is, agents who followed the charismatic leader were “disinclined” to agree with agents who disagreed with the charismatic leader. No matter what the level of societal hate, this increased the amount of time it took for some groups to form because this increased the amount of time between agreements for the charismatic leader’s followers.
DISCUSSION
The presence or absence of a charismatic leader has some influence on hate group formation. The models presented provided some emergent behaviors that seem to mimic a real-world phenomenon, when a charismatic leader is present, the followers of that leader focus more on the leader than on any internally held beliefs. In the charismatic leader models, the leader’s supporters avoided agreements with anyone who did not agree with the charismatic leader. In some cases, this greatly decreased their potential pool of agreements towards group formation. The charismatic leadership model increased the number of opportunities for the agents to change their internal characteristics; this ability also impacted the likelihood that groups dissolved. Another potential explanation from examining the log files is that the agents that agreed with the leader would not agree with agents who disagreed with the leader, despite having similar levels of intrinsic and extrinsic hate; this is an emergent property that was not programmed into the charismatic leader model. All emergent behaviors in agent-based modeling are interesting, especially when they provide a potential glimpse of what real humans do in these situations. This behavior would be like those white supremacists who did not like David Duke as head of the Klan or anti-Semites who did not like Hitler. Those who did follow these leaders avoided anyone who would belittle their leader, despite having similar ideology or beliefs.
While this behavior decreased the number of agreements between certain agents, thereby decreasing the likelihood that they would gain enough agreements to form a group it does illustrate balance theory. Balance theory, identified by Heider (Reference Heider1958), argues that individuals make decisions regarding interpersonal relationships to achieve a balanced state. In this balanced state, individuals seek relationships that will maintain a positive agreement on a personal belief or viewpoint, as it relates to a third person or mutual interest (Heider Reference Heider1958). Individuals are uncomfortable or experience tension in situations where the views of the members of a group regarding the mutual interest are not in balance, which can result in the dissolution of partnerships or relationships (Heider Reference Heider1958).
In the charismatic leader model, agents that left a group usually sought out a group that had already formed that was more in line with their characteristics, making these groups larger. In both the control hate and the charismatic leader models, this seemed to indicate that once an agent decided to be a member of a group, even if it left that group, it appeared to seek out group membership in an already formed group than begin the process to make new connections to form new groups. This is another emergent property, not programmed into the models. This means that the behavior is not programmed, but that agents who have previously been members of a group appear to be drawn to established groups. Because some agents were more “picky” about which agreements they sought out, particularly those agents who agreed with the charismatic leader to avoid agents who disagreed with the leader, this resulted in a longer period before those agents made enough agreements to form a group.
Implications for Methodology
This study used simulation modeling to study hate group formation. Simulation models are considered viable if they recreate real-world phenomena in ways that “match up” to history and experience. The models in the study, thus, were successful in that they recreated hate groups using a small number of theoretical parameters. They have recreated situations that have been seen, historically, in the real world. Hate groups formed around a charismatic leader, something that has been seen throughout American history with white supremacist groups like the Ku Klux Klan, the Order, and neo-Nazis. Hate groups formed at all levels of societal hate, just like they have in the United States throughout history. Regardless of how accepting society has become of ethnic, cultural, and social diversity, hate groups have formed if enough people accept a hate ideology.
Collectively, the results of these models provide support for the continued and expanded use of this methodology in the field of criminal justice, especially when the phenomena of interest are inaccessible. Concerning Weber’s (Reference Weber1947) theory of charismatic leadership, the influence of a single individual as a catalyst for group formation encouraged those with the same level of hate to form hate groups. Although the number of hate groups, how large they were and how quickly they formed did not surpass the control model, they still formed. This could be representative of a simulation of the distance between the charismatic leader and society. A charismatic leader on the fringes of society will have less influence than one in the White House. It could also be a simulation of the charismatic leader’s reach. A charismatic leader with a single website or an amateur radio program has a smaller reach and less influence than one with a nationally syndicated program on a mainstream media outlet.
The unexamined data produced by this study’s models may provide a wealth of further information that can be matched to historically known scenarios and situations. All in all, the models are a viable starting point for examining hate groups, as well as other extremist or criminal groups, such as terrorist organizations, violent Mexican drug cartels, and street or prison gangs.
Limitations of the Models
The models used in this study have identified hate as a primary characteristic of interest and tested the theory of charismatic leadership to recreate the dynamics of hate group formation in simulation.
Human beings are incredibly complex in their thoughts, interactions, and responses to the situations in which they find themselves. Though hate groups formed under these conditions, it is still probable that something has been overlooked. Although many human characteristics that are typically considered important were not included (i.e. education level, socio-economic status), this limitation was partially offset by the fact that hate groups form at every level of these characteristics in the real world.
Nevertheless, these models did not include one characteristic that is considered especially important to hate groups, and that is race. Race was not included as it is an assumed characteristic in Weber’s (Reference Weber1947) theories. The theory was designed to explain behaviors and phenomena seen in racially or ethnically homogeneous settings. Therefore, all agents were the same race and racial pride was not a characteristic given to the agents. In future research examining hate group behavior and hate crime, this is a characteristic that will likely need to be included. There have been hate groups formed around a wide range of ethnic, racial and religious groups, not only among white supremacists. In the United States, in 2018, the Southern Poverty Law Center tracked 264 Black Nationalist hate groups (SPLC 2019). Also, these models were not designed to examine even simulated responses to a specific “trigger” event that could increase hate group formation, such as a heinous crime, as in the case of the Knights of Mary Phagan or an event highlighting systemic behavior such as the deaths of Trayvon Martin or George Floyd.
It can be argued that these models could be used to form groups for a variety of purposes by switching intrinsic and extrinsic hate with other characteristics, such as “love of chess.” Due to the lack of a means for externally validating the hate group formation models, this can be seen as a limitation. The same argument can be made for any simulation model, that any characteristic is only a label provided by the modeler and embodies only as much meaning as that label. While this is a limitation of these and other simulation models, the models generated groups that are listed as hate groups, under the conditions provided in the model programming.
The distribution of both intrinsic and extrinsic hate and whether they are correlated with one another may be another limitation to this study. There simply have been no real-world surveys of hate to enable a determination of how close real-world estimations would match those of the simulation.
CONCLUSION
The most striking results were those found in relation to the charismatic leader hypotheses. When societal hate was included, the charismatic leader model produced the fewest hate groups, primarily since charismatic leaders were theorized to be a product of the society in which they come to power. This may be due in part to an over-simplified representation of charismatic leadership in the model, or this result may be echoing history. Historically, charismatic leaders have not risen to power from the ether, and their group dominates the landscape, limiting the proliferation of other groups. Sometimes groups tied to a charismatic leader have actively sought to destroy or discredit other groups.
Historians and archivists who focus on Nazi Germany highlight a series of events that came into alignment that allowed for the rise of Hitler (Kershaw Reference Kershaw2008). Among these events were Germany’s loss of World War I, the shame and degradation of the German people due to heavy reparations and massive unemployment (Kershaw Reference Kershaw2008); increases in crime and immorality, especially in Berlin, the rise of the mysticism movement, the Great Depression in the United States, the rising popularity of the Communist Party, civil unrest, weak centralized government, and the Reichstag Fire; all contributed to Hitler’s rise (Kershaw Reference Kershaw2008).
The history of the Ku Klux Klan also shows a variety of outside events and influences that inspired its waves of membership and resurgence. These included the rise of popular and political support for the passage of the Civil Rights Act and 18 U.S.C.A. § 245 (Wade Reference Wade1987), the increased demonstrations and rallies by minorities in the 1950s and 1960s which the Klan met with the bombing of the 16th Street Baptist Church, or the 1954 Supreme Court Decision in Brown v. Board of Education that resulted in extensive Klan demonstrations and a boost in membership (Chalmers Reference Chalmers1987; Wade Reference Wade1987). In the case of the Klan, even popular media provided a catalyst for membership and support, with the adaptation of the book, The Klansman, into the film Birth of a Nation (Chalmers Reference Chalmers1987).
Weber’s (Reference Weber1947) original examination of charismatic leadership was designed to explain the rise and influence of charismatic leaders. The small number of hate groups formed in the charismatic leader models likely highlights the importance of these other factors when studying charismatic leadership, and separate modeling that would allow for thresholds of unrest, unemployment and catastrophic incidents likely is needed. Another explanation from history is that charismatic leaders have sometimes been associated with several different groups. However, too many competing groups are detrimental to the leader’s sway over his followers, as too many opportunities for in-fighting distract from the leader’s message. Weber himself expanded on his original views of charismatic leadership throughout his writings, and these variations of charisma idea developed later than the original theory can guide future variations of the charismatic leader model. Charismatic leaders come to the forefront in a wide variety of organizations, not just hate groups. Charismatic leaders have a place in legitimate society and organizations; however, their sway is also seen among more dangerous groups or can be employed in subversive ways.
Charismatic leaders continue to be of concern in terrorist organizations, as well as hate groups. Osama Bin Laden, Abu Bakr al-Baghdadi, and Anwar al-Awlaki, to name only a few, have raised the issue of the effect of charismatic leadership on group formation and recruitment both in life and after death. See Schleby Reference Schbley2003, Oberschall Reference Oberschall2004, Ingram Reference Ingram, Hopkinson and Hall2006, and Hoffman Reference Hofmann2015 for consideration of the connections between terrorism and charismatic leadership. Wherever a charismatic leader holds sway over potential followers, if their message is one of hate and hostility, crime and violence will likely follow. Hate has become part of the human condition. Anyone can form or join an extremist group that professes hate against their fellow human beings based on any defining and perceived or observable characteristic. The Internet has increased the ability of individuals to find others who share their hatred.
The groups that formed in this model included the followers of the leader. The leader’s followers were given an extra option for changing their intrinsic hate and other internal characteristics. If these agents increased their intrinsic hate, radicalizing in support of the leader’s views, they would surpass the intrinsic hate of their fellow agents within a group, resulting in more frequent model calculations of the group’s mean intrinsic hate and more opportunities for drop-outs to choose to leave the group. If enough members left, the group dissolved. More experimentation with charisma and susceptibility may help model a group member’s acquiescence in instances of genocide, war crimes, and less violent crimes, such as voluntary participation in Ponzi schemes or fraud.
Clairissa D. Breen is an assistant professor at Buffalo State College where she teaches in the Criminal Justice Department. She specializes in catastrophic criminology.
Steven T. Frezza is a professor of Software Engineering at Gannon University where he serves as Director, SEID Programs Software Engineering and Chairperson of Computer & Information Science.


