


Evaluating quality of care has become increasingly important over the past years and mandatory public reporting and nonpayment programs for medical complications have strengthened the need for reliable and comparable measures of performance.Reference Panzer, Gitomer, Greene, Webster, Landry and Riccobono 1 , Reference Rosenthal 2 Reporting mandates have been introduced for healthcare-associated infections in a majority of the United States as well as other countries, and nonpayment regulations are expanding. 3 – Reference Haustein, Gastmeier and Holmes 5 The emphasis on measuring quality of care by patient outcomes requires not only reliable ascertainment of clinical outcomes but also accurate and practical methods of adjustment for underlying disease severity so as to allow for valid comparisons between healthcare facilities.Reference Panzer, Gitomer, Greene, Webster, Landry and Riccobono 1 , Reference Mu, Edwards, Horan, Berrios-Torres and Fridkin 6 – Reference Kritsotakis, Dimitriadis and Roumbelaki 10
The ventilator-associated event (VAE) paradigm for surveillance of complications of mechanical ventilation (MV) was introduced as an alternative to traditional assessment of ventilator-associated pneumonia.Reference Magill, Klompas and Balk 11 Two tiers of the new framework—ventilator-associated condition (VAC) and infection-related VAC (IVAC)—are being considered for future use in benchmarking and pay-for-performance programs and are reportable to the Centers for Disease Control and Prevention’s National Healthcare Safety Network (NHSN).Reference Magill, Klompas and Balk 11 However, case-mix adjustment in NHSN is currently limited to stratification by type of intensive care unit (ICU) and better methods of incorporating disease severity are needed to facilitate more meaningful comparison of rates. 12 , Reference Dudeck, Weiner and len-Bridson 13
Several ICU mortality risk scoring systems, such as the Acute Physiology and Chronic Health Evaluation (APACHE) and Simplified Acute Physiology Score, have been in use for numerous years to measure disease severity in research and outcome evaluations.Reference Breslow and Badawi 8 , Reference Moreno, Metnitz and Almeida 14 – Reference Higgins, Teres, Copes, Nathanson, Stark and Kramer 16 Although these models have good predictive accuracy for in-hospital mortality, their universal adoption is hampered by their inclusion of many clinical parameters that are labor-intensive to gather and infrequently available in a structured electronic format.Reference Jha, DesRoches and Campbell 17 , Reference Kuzniewicz, Vasilevskis and Lane 18 Increasing use of electronic health records (EHRs) has fueled interest in the possibility of using routine care electronic data as a reliable alternative to time-consuming manual data collection. Although some risk scoring systems have been adapted to electronic data, their generalizability is questionable since they use diagnosis codes from administrative data, include clinical variables that are available in only a fraction of EHRs, and incorporate some variables that are not routinely measured in all patients.Reference Johnson, Kramer and Clifford 19 – Reference Liu, Turk, Ragins, Kipnis and Escobar 21 Furthermore, existing disease severity models may not be optimal for VAE risk-adjustment since they were derived from both ventilated and nonventilated patients and in some cases excluded cardiovascular surgery patients.Reference Moreno, Metnitz and Almeida 14 – Reference Higgins, Teres, Copes, Nathanson, Stark and Kramer 16 , Reference Render, Deddens and Freyberg 20
In this study, we aimed to develop a disease severity prediction model targeted specifically at mechanically ventilated patients using routinely collected, electronically stored data. We strove to optimize the balance between model precision, complexity, and generalizability. In addition, we assessed the relation between estimated disease severity and the risk of VAEs.
METHODS
Study Population
All patients initiated on MV, through an endotracheal tube or tracheostomy, and requiring ICU care in the Brigham and Women’s Hospital (Boston, MA) from January 1, 2006, through December 31, 2012, were eligible for study inclusion. An interruption of MV of more than 1 calendar day defined the start of a new ventilation episode. If multiple hospital admissions or MV episodes occurred for a patient within the study period, a random hospitalization was chosen and the first episode within the hospital admission was selected. Patients younger than 18 years, those who could not be successfully linked to electronic data repositories, and those who were not admitted to an ICU were excluded. This study was reviewed by the institutional review board of Brigham and Women’s Hospital and the requirement for individual patient consent was waived (protocol number: 2012P002052).
Outcomes
The primary outcome in developing a severity of disease prediction model was in-hospital mortality. As a sensitivity analysis, models were also developed for mortality within 30 days of initiation of MV as determined from hospital vital statistics records.Reference Graham and Cook 22 – Reference Pouw, Peelen, Moons, Kalkman and Lingsma 24
VACs and IVACs were selected as targets for risk-adjustment. A VAC reflects a sustained period of worsening oxygenation requiring increased ventilator settings whereas an IVAC is defined as a VAC with concurrent initiation of new antimicrobial therapy in combination with signs of infection (abnormal temperature, white blood cell count). Both were operationalized electronically in accordance with January 2013 NHSN specifications using ventilator settings derived from the respiratory therapy department. 12
Predictors
Potential predictors were collected from the hospital’s electronic Research Patient Data Registry. 25 This database compiles a broad variety of structured electronic data elements recorded during routine clinical care. We extracted data on patient demographic characteristics, laboratory tests, microbiology results, procedure codes, diagnosis codes, billing information, and medication use. ICU admission and discharge dates, however, were not available. Variables were selected for extraction on the basis of clinical associations with severity of disease and previously published models.Reference Moreno, Metnitz and Almeida 14 , Reference Zimmerman, Kramer, McNair and Malila 15 , Reference Render, Deddens and Freyberg 20 , Reference Higgins, Kramer, Nathanson, Copes, Stark and Teres 26
Subsequently, all candidate variables were assessed for potential inclusion. A qualitative estimate of feasibility was based on the extent of missing data and the expected likelihood that similar data will be available in electronic form in other hospitals. We also evaluated candidate variables for generalizability based on the probability that predictors would have similar interpretation when applied in other settings or across time (Table 1). When applicable, predictors were classified in broad groups that are expected to translate to other settings. ICU types were grouped into medical, surgical, neuroscience, and cardiovascular surgery categories, and procedure types were classified by anatomic or functional location (eg, musculoskeletal, cranial, digestive tract).
TABLE 1 Overview of Electronic Data Sources

NOTE. Data were collected during the process of routine care on the first calendar day of mechanical ventilation (MV) or the day prior when available. All groups of predictors are classified by anticipated feasibility and generalizability of electronic data collection. For details on variable definitions please refer to supplementary material (section 1). ALT, alanine transaminase; CABG, coronary artery bypass graft; DRG, diagnosis-related group; ICD9, International Classification of Disease, Ninth Edition; INR, international normalized ratio.
a Feasibility was estimated on the basis of the amount of missing data in our sample and the expected availability from electronic health records in other settings.
b Generalizability was defined as the anticipated consistency of predictor interpretation in other settings. +: good anticipated feasibility/generalizability, +/−: some concerns, −: limited anticipated feasibility/generalizability.
c Surgical intensive care unit (ICU): all surgical ICU types (eg, general, trauma, thoracic); Neuroscience ICU: neurology and neurosurgery.
We collected values for predictors from the calendar day of MV onset and the day prior when available. Data were cleaned and processed as specified in sections 1A–1C of the online-only material. For each predictor, the observation reflecting the worst prognosis was taken (eg, lowest hematocrit, highest creatinine). Comorbid conditions were assessed based on administrative data using the Elixhauser method. 27 , Reference Elixhauser, Steiner, Harris and Coffey 28
Model Development and Statistical Methods
Patterns of missing data were explored and multiple imputation was performed (mice package, version 10, R).Reference van Buuren and Groothuis-Oudshoorn 29 Exploratory univariable analysis of the association between predictors and in-hospital mortality was performed and restricted cubic splines were used for continuous variables that did not have a linear association with the log-odds of mortality (online-only material, section 1B).Reference Harrell 30
Regression models of incremental complexity were built, first including groups of candidate predictors with the best expected feasibility and generalizability (defined in Table 1). All variables within each group of predictors were added to the model irrespective of their individual significance. Interactions detected by backward elimination were judged relevant if P<.0001; very rare combinations of predictors were excluded. If a group of predictors no longer contributed to model performance, measured by the Akaike information criterion, it was eliminated in its entirety. To limit overfitting and to obtain bias-corrected estimates of model performance, internal validation and uniform shrinkage were performed using bootstrap samples (100 samples per imputation). This method generates more accurate estimates of performance than split-sample or cross-validation approaches.Reference Steyerberg, Harrell, Borsboom, Eijkemans, Vergouwe and Habbema 31 Parameter estimates from the imputation sets were pooled by Rubin’s rule.Reference Rubin 32
Model discrimination and calibration were assessed using the area under the receiver operating characteristic curve (AUROC), the Brier score, the Hosmer-Lemeshow test, and examination of calibration plots. Given the large heterogeneity in mortality across ICU types, the model with the most favorable balance of complexity to performance was developed stratified by ICU type.
Finally, the possibility of VAE risk-adjustment using the severity of underlying disease estimates was assessed by examining the relation between predicted risk of mortality and observed incidence of VAEs. For the overall population and for each type of ICU separately, patients were classified by decile of predicted mortality risk and the incidence of VACs and IVACs was determined within each decile. In addition, attention was paid to the relation between disease severity and the competing outcomes for VAEs. Because patients must by definition have received at least 4 days of MV—2 days of stability or improvement followed by 2 days of deterioration—in order to be at risk of VAE, early death or early discharge within 4 days can be considered competing outcomes. 33
All analyses were performed using SAS, version 9.2 (SAS Institute), and R (www.r-project.org).
RESULTS
During the study period, 24,366 episodes of MV were recorded in 20,581 unique patients. Of these patients, 59 were younger than 18 years; 350 did not have a successful medical record match; and 144 were not admitted to an ICU, thus leaving 20,028 patients for analysis. Median age was 64 years, 60.3% were male, and 40.7% were admitted to the cardiovascular surgery unit (Table 2). Average in-hospital mortality was 15.1%, ranging from 3.3% for cardiovascular surgery to 38% for the medical ICUs.
TABLE 2 Selected Patient Characteristics in Comparison Study of Outcomes in Mechanically Ventilated Patients Using Electronic Routine Care Data, 2006–2012

NOTE. Data are no. (%) unless otherwise indicated. IQR, interquartile range; MV, mechanical ventilation.
a On day of MV onset or day prior.
As expected, models using larger numbers of predictors had improved performance characteristics, although the gains with incrementally more complicated models became smaller (Table 3). Model 2, using only demographic information, unit type, microbiology data, procedure codes, and commonly performed laboratory tests, achieved an optimism-corrected AUROC of 0.870 (95% CI, 0.864–0.876) (parameter estimates in the online-only material Tables S1, S2). On internal validation, overoptimism was very limited (0.003–0.006 decrease in AUROC). Calibration was adequate with slight overprediction for high-risk patients (online-only material, Figure S1); this is also reflected by the Hosmer-Lemeshow test statistics (χ2 test, 49.9 to 59.5 on 10 degrees of freedom). A sensitivity analysis for 30-day mortality demonstrated similar performance of all models (online-only material, Table S3).
TABLE 3 Results of Model Development and Internal Validation for In-Hospital Mortality
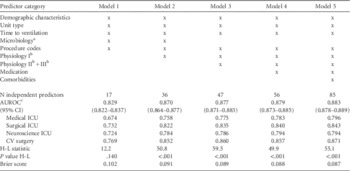
NOTE. Models are ordered by increasing complexity as classified by feasibility and generalizability of data collection. AUROC, area under the receiver operating characteristic curve; CV, cardiovascular; H-L, Hosmer-Lemeshow; ICU, intensive care unit.
a Microbiology (blood culture performed) did not contribute to model performance in models 3 and up and was therefore removed.
b Physiology I-III, please refer to Table 1 and supplementary data for definitions.
c Bias-corrected.
Model 2 also had reasonable performance when applied within ICU types (AUROC, 0.758 to 0.852); as can be expected, the observed performance was somewhat lower because differences between patients within each of the unit types were smaller than across units. Given the large heterogeneity in mortality rates between types of ICUs and the intended application of achieving adequate estimation of disease severity within ICU types, the model was refit stratified by ICU type (Table 4, Table S4), resulting in similar performance yet less complex models because interaction terms were no longer necessary. In addition, the performance of this model was compared with APACHE II scores of a subset of 144 patients included in the hospital’s Registry of Critical Illness who were mechanically ventilated on admission to the ICU.Reference Dolinay, Kim and Howrylak 34 This revealed an AUROC of 0.66 for APACHE II versus 0.80 for the final model.
TABLE 4 Model Development for In-Hospital Mortality Stratified by Unit Type for Model 2

NOTE. AUROC, area under the receiver operating characteristic curve; H-L, Hosmer-Lemeshow; IVAC, infection-related ventilator-associated condition; MV, mechanical ventilation; VAC, ventilator-associated condition.
a For mortality, after correction for overoptimism. Models were developed by unit type; procedure types that did not occur within the unit types were excluded. There were no significant interactions in all models.
Depending on the type of ICU, the overall risk of VAC ranged from 0.9% to 9.1% and of IVAC from 0.4% to 3.2% (Table 4). Overall, there was a positive association between the estimated severity of disease (predicted mortality from model 2 stratified by ICU type) and the occurrence of VAC and IVAC (Figure 1). Specifically, for surgical and cardiovascular surgery units there was a positive association between estimated disease severity and VAE incidence, whereas for medical and neurological ICUs the picture was less clear. As can be seen in the bar charts, the association between observed risk of VAE and estimated disease severity is largely explained by the proportion of patients who remain on MV 4 days or longer and are thus at risk of developing a VAE. In particular for medical units, the decline in VAC incidence in higher mortality risk groups is caused by an increasing proportion of patients experiencing the competing event of dying within 4 days of MV onset.

FIGURE 1 Association between estimated disease severity (predicted risk of in-hospital mortality) and the occurrence of ventilator-associated events (VAEs). Predicted risk of in-hospital mortality was derived from the final model stratified by unit type and incidence of ventilator-associated condition (VAC, left column) and infection-related VAC (IVAC, middle column). Horizontal lines represent the overall event incidence. The bar charts (right column) depict the proportion of patients at risk of developing a VAC or IVAC and those either discharged alive off the ventilator within 4 days of ventilator onset (early discharge) or deceased within 4 days of ventilator onset (early death). Top row: deciles of predicted mortality risk calculated for the overall population; bottom 4 rows: patients are stratified by decile of mortality risk within each intensive care unit type. MV, mechanical ventilation.
DISCUSSION
Adjustment for severity of underlying disease is a necessary requirement to achieve valid comparisons of patient outcomes across healthcare providers. This study is meant as a proof-of-concept that estimating underlying disease severity in mechanically ventilated patients is feasible using fairly simple models applied to electronic routine care data. The performance characteristics obtained were in the same range as those observed in the derivation studies of more labor-intensive methods such as APACHE and Simplified Acute Physiology Score.Reference Breslow and Badawi 8 Models of increasing complexity showed marginally better performance but at the cost of more extensive data collection and rising concerns with generalizability to different settings.
In addition, this study found an intricate relation between estimated disease severity and the incidence of VAEs, thus providing a starting point towards improved correction for differences in patient populations when these outcomes are used for assessment of quality of care. Currently, event rates reported to NHSN are stratified by unit type for comparison.Reference Dudeck, Weiner and len-Bridson 13 Although unit type does explain an important fraction of the observed variation in VAE incidence, this can be further refined by stratifying on underlying disease severity within ICU types. This association between estimated disease severity and VAE risk seems to be mediated by identifying the proportion of patients who remain on MV long enough to be eligible for developing a VAE (MV≥4 days). We purposely included all patients initiated on MV regardless of whether they achieved 4 days of MV because all MV days are counted in the denominator of VAE rates and the duration of MV is also unknown at the time of ventilation onset (the moment of prediction). Future research is needed to determine how to assess the exact relationship between severity of underlying disease and the likelihood of developing VAE and how to account for the competing outcomes of early death and early discharge. Because the models were developed in a single tertiary care US hospital, further validation studies are needed to determine their performance and utility in different hospitals and types of ICU. These studies will also provide an opportunity to refine estimates for a broader range of (specialized) ICU types, including mixed medical-surgical units and units affiliated with smaller community hospitals, ideally in alignment with the ICU classifications currently employed by NHSN.
Although numerous models have previously been developed to predict in-hospital mortality, these were not developed for the purpose of comparing patient outcomes in the specific domain of mechanically ventilated patients, and several concerns limit their application in risk-adjustment for VAEs, including the highly divergent degrees of sophistication in EHR contents across hospitals.Reference Moreno, Metnitz and Almeida 14 , Reference Zimmerman, Kramer, McNair and Malila 15 , Reference Higgins, Kramer, Nathanson, Copes, Stark and Teres 26 Existing models, such as the APACHE, require extensive amounts of manual data collection, including physiologic variables that are not routinely documented in EHRs (eg, Glasgow coma scale, blood pressure, urine output) and reason for admission, which is subject to considerable interrater variability.Reference Kuzniewicz, Vasilevskis and Lane 18 , Reference Polderman, Thijs and Girbes 35 Strikingly, models in some cases included administrative data collected after the first 2 days of admission, which may better reflect the evolution of disease within hospitals rather than patients’ presenting conditions.Reference Render, Deddens and Freyberg 20 , Reference Liu, Turk, Ragins, Kipnis and Escobar 21 Moreover, translating a model directly to an electronic environment may introduce unanticipated loss of comparability.Reference Liu, Turk, Ragins, Kipnis and Escobar 21 , Reference Bosman, Oudemane van Straaten and Zandstra 36 The models developed in this study aim to address these concerns and do have similarities with existing risk-adjustment models, in particular the model developed within the Veteran’s Affairs system.Reference Render, Deddens and Freyberg 20 However, that model makes extensive use of admission diagnoses and procedure codes and includes more laboratory variables than the simpler models developed in our study.
The process of model development in this study was targeted specifically for use with electronic data and an important component was the a priori assessment of the feasibility and generalizability of data collection through EHRs. Preference was given to measuring information “close to the patient” as opposed to proxies such as administrative coding data. We found that simple models without admission diagnoses, disease codes, or medication use—variables for which the use and classification are more likely to differ across settings—were still able to perform robustly. We further incorporated methods for handling of outliers and approaches to handling of missing observations other than imputing a normal value since the latter weakens the reliability of risk-adjustment.Reference Afessa, Keegan, Gajic, Hubmayr and Peters 37
Several important additional limitations need to be addressed. Firstly, this study was developed in a single tertiary medical center using data from a 6-year period and did not include a separate validation sample; use of a random split-sample for validation was judged not to provide sufficient new insights in comparison with the internal validation strategy used.Reference Steyerberg, Harrell, Borsboom, Eijkemans, Vergouwe and Habbema 31 As described above, validation studies will be needed before large-scale adoption. Nevertheless, the results of this study will inform the design and data collection of such studies. The Hosmer-Lemeshow statistics for our models suggested significant miscalibration but this test is known to be unreliable with large sample sizes and assessment of calibration plots showed adequate calibration.Reference Kramer and Zimmerman 38 Finally, examination of yearly observed-to-expected ratios by unit type did not reveal any secular decreases in model performance (online supplementary data).
We could perform only a very limited head-to-head comparison of our models with other, existing, methods (eg, APACHE or Simplified Acute Physiology Score) since these severity-of-disease estimators are not routinely collected in our setting; their absence was the driving force behind the current study. It has been argued that using 30-day mortality is more reliable than in-hospital mortality for the purpose of outcome comparison; however, data on in-hospital mortality is often collected more consistently than 30-day mortality.Reference Drye, Normand and Wang 23 , Reference Pouw, Peelen, Moons, Kalkman and Lingsma 24 In this study, model performance characteristics were similar for both. Prior studies have identified several possible predictors that could not be collected from our EHRs but that may be of predictive value in future studies, including (hospital) location prior to ventilator onset, time to ICU admission, transfer status, urgency of admission and/or surgery, and the presence of do-not-resuscitate orders.Reference Moreno, Metnitz and Almeida 14 , Reference Zimmerman, Kramer, McNair and Malila 15 , Reference Render, Deddens and Freyberg 20 , Reference Keegan, Gajic and Afessa 39 In addition, inclusion of ICU type as a predictor requires assumptions to be made regarding similarity of patient characteristics across ICU types in different hospitals. Future validation studies will need to assess robustness to differences in admission policies and define methods to handle specialty ICUs. The use of more sophisticated modeling strategies such as supervised machine learning have been suggested in the recent literature as efficient methods of model development, and focusing on using parameters that can be collected reliably and efficiently would be of added value.Reference Johnson, Kramer and Clifford 19
Valid comparison of patient outcomes and occurrence of VAEs requires adequate methods of correction for severity of underlying disease. This study demonstrates the feasibility of estimating disease severity in ventilated patients using electronic routine care data and provides insight into the balance between complexity of data collection and model performance. The estimates of underlying disease severity obtained from these models show utility in future adjustment of VAE rates, although further research is necessary to validate and refine the proposed models and develop practical and robust methods of benchmarking.
Acknowledgments
We thank the Brigham and Women’s Hospital Registry of Critical Illness investigators for contributing APACHE II scores for our comparative analysis: Carolina Quintana, MD, Rebecca M. Baron, MD, Laura E. Fredenburgh, MD, Joshua A. Englert, MD, Lee Gazourian, MD, Anthony F. Massaro, MD, Anna Trtchounian, Tamas Dolinay, MD, PhD, and Augustine M. K. Choi, MD. In addition, we thank N.P.A. Zuithoff, PhD, for his statistical advice.
Financial support. Netherlands Organization for Scientific Research (project 9120.8004 and 918.10.615 to K.G.M.M.); Centers for Disease Control and Prevention (grant 1U54CK000172 to M.K.).
Potential conflicts of interest. All authors report no conflicts of interest relevant to this article.
Supplementary material
To view supplementary material for this article, please visit http://dx.doi.org/10.1017/ice.2015.75


