Healthcare-associated infections (HAIs) are well-described major adverse events in hospitals, threatening patient safety and challenging public health.Reference Allegranzi, Bagheri Nejad and Combescure 1 – Reference Burke 5 Reliable estimates of the global HAI prevalence using standardized surveillance measures are needed.
Healthcare-associated infections also affect hospitals in mainland China. The social and financial HAI burden will be a challenge in the next decades for a number of reasons.Reference Sun 6 China currently has a population of 1.34 billion, which is increasing and at the same time rapidly aging. 7 The medical system is complex, with imbalances among the regions and between rural and urban areas.Reference Xu, Sun and Gu 8 The average length of stay (LOS) in an acute-care facility in mainland China was 10.0 days in 2012, which is significantly longer than the average LOS in high-income countries (eg, United States, 4.5 days, and European countries, 5.1 days).Reference Wang, Zhang, Li, Guo, Liu and Wang 9 – 11 The average inpatient hospitalization cost in China is ~US$1,738.Reference Jia, Hou and Li 12 According to the World Health Organization (WHO) Global Health Expenditure database, only 5.5% of the gross domestic product (GDP) in China was spent on health in 2014, 13 which equates to ~US$420 per capita per year. 14 In 2013, the rates of doctors and nurses per 1,000 population in mainland China were 1.7 and 2.0, respectively. 7 , Reference Anand, Fan and Zhang 15
National and international networks have been created to encourage HAI surveillance, such as the Centre for Disease Prevention and Control (CDC) National Healthcare Safety Network (NHSN), the European Centre for Disease Prevention and Control (ECDC) Healthcare-Associated Infection Surveillance Network (HAI-Net), and the International Nosocomial Infection Control Consortium (INICC).Reference Allegranzi, Bagheri Nejad and Combescure 1 , 11 , Reference Magill, Edwards and Bamberg 16 In addition to offering modules for prospective HAI outcome surveillance, predominantly in intensive care, the CDC and the ECDC have performed point-prevalence surveys (PPSs) on national and European levels, respectively. The Chinese National Healthcare-Associated Infection Surveillance System (NHAISS) has conducted regular HAI PPSs since 2001 using standardized national HAI definitions to allow geographical and prospective comparisons.Reference Wang, Hu, Harbarth, Pittet, Zhou and Zingg 17 The paucity of reports published in English peer-reviewed journalsReference Wang, Hu, Harbarth, Pittet, Zhou and Zingg 17 – Reference Chen, Zhao and Shan 23 makes data comparison with geographical regions other than China difficult.
The aim of this systematic review and meta-analysis was to assess the prevalence of HAI in mainland China by collating results from reports in English or Chinese published between January 2006 and August 2016.
METHODS
Search Strategy
In this systematic review and meta-analysis, we followed the Preferred Reporting Items for Systematic Reviews and Meta-Analysis (PRISMA) guidelines.Reference Moher, Liberati, Tetzlaff, Altman and The 24 We searched PubMed, the China National Knowledge Infrastructure (CNKI), and the Chinese Wan Fang digital database. The following medical subject heading (MeSH) terms and key words for PubMed were used: “cross infection” (MeSH term), “nosocomial infection,” “hospital acquired infection,” “hospital-acquired infection,” “health care associated infection,” “healthcare associated infection,” “healthcare-associated infection,” “infection control” (MeSH term), “prevalence” (MeSH term), “point prevalence survey,” “cross-sectional studies” (MeSH term), “surveillance,” “epidemiological monitoring” (MeSH term), “epidemiology” (MeSH term), “population surveillance” (MeSH term), and “China” (MeSH term). The following search terms for the CNKI and Wan Fang digital database were used: “healthcare-associated infection,” “nosocomial infection,” “prevalence,” and “cross-sectional study.” Similar terms in Chinese were used to search the Chinese databases.
Inclusion/Exclusion Criteria
The following inclusion criteria were applied: (1) any PPS report performed and published in acute-care hospitals in mainland China between January 2006 and August 2016; (2) publications reporting on ≥2 hospitals; and (3) study language being either English or Chinese. The following exclusion criteria were applied: (1) conference papers, editorials/letters, case-control studies, or review articles; (2) duplicate studies; (3) publications reporting on antimicrobials only; and (4) national reports (duplicate data). In case studies published in both Chinese and English, the English publication was selected. If >1 report was published using (partially) the same database, the publication with higher representation of the geographical region was selected.
Data Abstraction
Title, abstract, and full-text reviews, as well as data extraction, were performed independently by 2 individual researchers (J.W. and F.L.). Disagreements were discussed and resolved by a third researcher (W.Z.). The following data were extracted systematically from eligible full-text articles: title, authors, publication year, geographical region, healthcare setting, number of hospitals, sample sizes, patients with HAIs, number and type of HAI, infection sites, pathogens, and proportion of multidrug-resistant organisms. Data were verified by cross checking (J.W., F.L., and J.H.). All studies were assessed for quality using the Strengthening the Reporting of Observational Studies in Epidemiology (STROBE) checklist (Supplementary Table 1A).Reference von Elm, Altman, Egger, Pocock, Gøtzsche and Vandenbroucke 25 We stratified study quality into 3 levels: high quality (>75% criteria met), moderate quality (50%–75% criteria met), and low quality (≤50% criteria met) (Supplementary Table 1B).
Statistical Analysis
Meta-analysis was performed using the Stata software Metaprop command in a random-effects model to calculate weighted HAI prevalence (with the corresponding 95% confidence intervals) and to produce forest plots. Results were stratified by type of healthcare setting (general hospitals, children’s hospitals, maternal and child health hospitals, and oncology hospitals) and by provinces and municipalities. Association of HAI prevalence with GDP per capita was tested using linear regression analysis. Statistical analysis was performed using Stata version 14.0 software (StataCorp, College Station, TX).
RESULTS
Figure 1 summarizes the systematic review profile. The search identified a total of 3,021 titles and abstracts, of which 115 studies were eligible for quality assessment and data extraction: 42 reports from general hospitals, 19 from children’s hospitals, 27 from maternal and child health hospitals, and 27 from oncology hospitals. Moreover, 17 (14.78%), 84 (73.04%), and 14 (12.17%) reports were of high, moderate, and low quality, respectively (Supplementary Tables 2A and 2B). Table 1 summarizes the patient populations as well as pooled and weighted HAI point prevalences.

FIGURE 1 Systematic review profile. Systematic review on healthcare-associated infections in mainland China, 2006–2016.
TABLE 1 Pooled and Weighted Prevalence of Healthcare-Associated Infections (HAIs) in General Hospitals, Children’s Hospitals, Maternal and Child Health Hospitals, and Oncology Hospitals in Mainland China, 2006–2016

NOTE. CI, confidence interval.
Healthcare-Associated Infections in Different Healthcare Settings
In total, 53,642 patients had 57,479 HAIs. Pooled and weighted prevalences were 2.98% (95% CI, 2.96%–3.01%) and 3.12% (95% CI, 2.94%–3.29%), respectively (Table 1). Children’s hospitals had the highest prevalence (4.43%; 95% CI, 3.39%–5.47%), followed by oncology hospitals (3.96%; 95% CI, 3.12%–4.79%), general hospitals (3.02%; 95% CI, 2.79%–3.26%), and maternal and child health hospitals (1.88%; 95% CI, 1.47%–2.29%) (Figure 2).

FIGURE 2 Weighted point prevalence of healthcare-associated infections, stratified by hospital type. Systematic review on healthcare-associated infections in mainland China, 2006–2016.
The weighted HAI prevalence in pediatric departments of general hospitals was lower (2.09%; 95% CI, 1.76%–2.43%) than the prevalence in pediatric hospitals (4.43%; 95% CI, 3.39%–5.47%). Similarly, the weighted prevalence in gynecology and obstetrics departments of general hospitals was lower (0.97%; 95% CI, 0.84%–1.11%) than the prevalence in maternal and child health hospitals (1.88%; 95% CI, 1.47%–2.29%). In general hospitals, the highest weighted prevalence was reported in intensive care (26.07%; 95% CI, 23.03%–29.12%), followed by surgery (3.26%; 95% CI, 2.96%–3.57%) and internal medicine (3.06%; 95% CI, 2.67%–3.46%) (Supplementary Figure 2).
Types of Healthcare-Associated Infections
Lower respiratory tract infection (LRTI) was the most frequent type of HAI (24,185 infections, 47.28%), followed by urinary tract infection (UTI) (5,773 infections, 11.29%), upper respiratory tract infection (URTI) (5,194 infections, 10.15%), and surgical site infection (SSI) (5,044 infections, 9.86%) (Table 2). Also, LRTI, UTI, SSI, and bloodstream infection (BSI) accounted for 71.33% of all HAIs. The 3 most frequent HAIs in general hospitals were LRTI (22,784 infections, 47.96%), UTI (5,532 infections, 11.65%), and SSI (4,692, 9.88%). The 3 most frequent HAIs in children’s hospitals were LRTI (400 infections, 45.45%), URTI (200 infections, 22.73%), and gastrointestinal infection (GI) (113 infections, 12.84%). The 3 most frequent HAIs in hospitals for maternal and child health were URTI (121 infections, 32.35%), LRTI (74 infections, 19.79%), and SSI (37 infections, 9.89%). The 3 most frequent HAIs in oncology hospitals were LRTI (927 infections, 38.66%), SSI (294 infections, 12.26%), and URTI (283 infections, 11.80%).
TABLE 2 Types of Healthcare-Associated Infections (HAIs) in Mainland China, 2006–2016

a 39/42 publications reporting on HAI types.
b 26/27 publications reporting on HAI types.
Healthcare-Associated Infections in Different Provinces of China
We observed remarkable variation in HAI prevalence among the provinces of China (Supplementary Figure 1). The range of weighted prevalence in different provinces and municipalities in China was 1.73% to 5.45% (Supplementary Table 3). Moreover, 5 provinces and municipalities had a weighted prevalence above the upper limit of the 95% CI for HAI, and 5 provinces and municipalities had a weighted prevalence below the lower limit of the 95% CI for HAI.
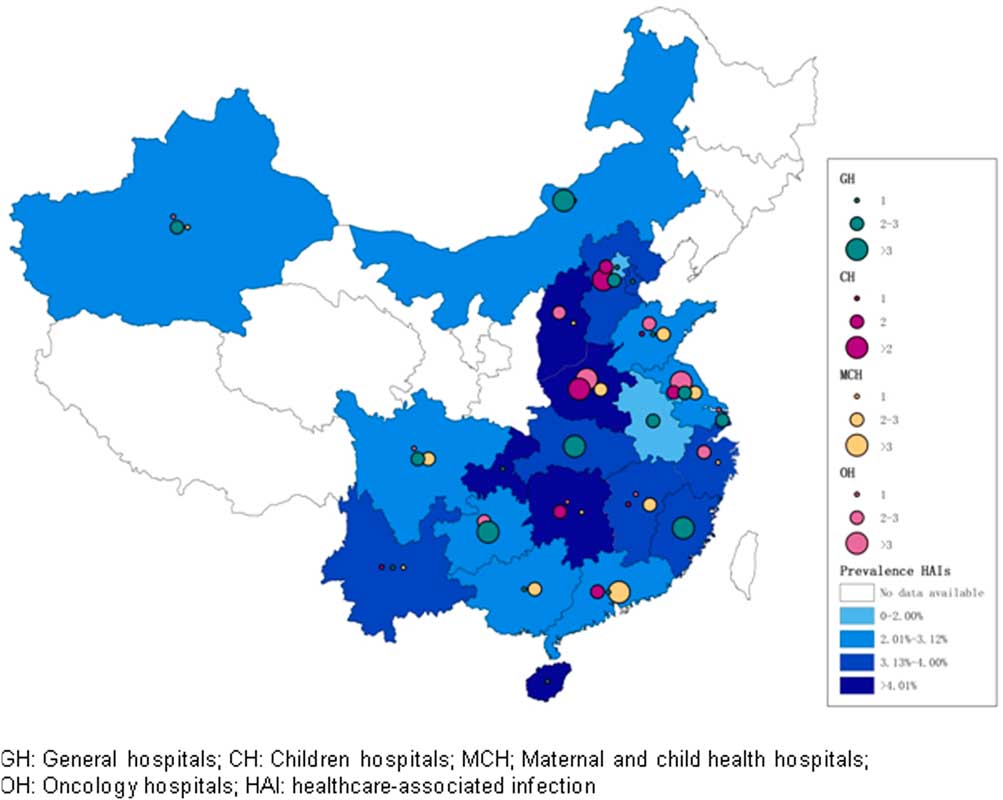
Figure 3 shows the distribution of HAI prevalence and the number of reports across provinces and municipalities in mainland China for 2006–2016. No identified survey had been performed in >1 province. The GDP of the different provinces and municipalities (Supplementary Table 3) was significantly associated with the weighted HAI prevalence (coefficient=−0.022; P<.001; 95% CI, −.035 to −.008); this difference represents an HAI reduction of 2.2% per 1,000 CNY increase of GDP (Supplementary Figure 3). 26

FIGURE 3 Prevalence of healthcare-associated infections and number of reports in the different provinces of mainland China, 2006–2016. NOTE. The size of circles represents the number of publications; the shade of color represents the prevalence of healthcare-associated infection. Provinces without color did not contribute to this systematic review either because there were no reports or because publications did not fulfill the inclusion criteria.
Distribution of Pathogens
Table 3 summarizes the 23,991 reported microorganisms. The 2 most common pathogens in general hospitals were Pseudomonas aeruginosa (3,395 14.91%) and Escherichia coli (2,918 12.82%). Klebsiella pneumonia (66 19.08%) and E. coli (34 9.83%) were the 2 most common microorganisms in children’s hospitals. K. pneumonia (22 23.66%) and E. coli (17 18.28%) were also the 2 most common microorganisms in maternal and child health hospitals. In oncology hospitals, E. coli (150 19.04%) and K. pneumonia (119 15.10%) were the most common 2 pathogens. Only a small number of studies reported on antimicrobial resistance.
TABLE 3 Distribution of Reported Pathogens Causing Healthcare-Associated Infections (HAIs) in Mainland China, 2006–2016

a 30/42 publications reporting on pathogens.
b 16/19 publications reporting on pathogens.
c 12/27 publications reporting on pathogens.
d 19/27 publications reporting on pathogens.
DISCUSSION
No other systematic review and meta-analysis on HAI in mainland China has been published in a peer-reviewed journal. One conference paper reported PPS data from mainland China between 1990 and 2011.Reference Li, Huai, Varma and Rao 27 In a total of 127 hospitals, the pooled point prevalence was 5.2% (95% CI, 0.6%−16.4%). This review fills the research gap on HAI prevalence in mainland China.Reference Allegranzi, Bagheri Nejad and Combescure 1 – Reference Ling, Apisarnthanarak and Madriaga 3 , 11 , Reference Magill, Edwards and Bamberg 16 The weighted HAI prevalence of 3.12% was higher than the frequency reported by the 2014 Chinese National PPS report (2.7%)Reference Ren, Wen and Wu 28 but lower than the 2011/2012 ECDC PPS (5.7%; 95% CI, 4.5%–7.4%) 11 and the recent US PPS (4.0%; 95% CI, 3.7%−4.4%).Reference Magill, Edwards and Bamberg 16
Compared to systematic reviews from developing countries (10.1%; 95% CI, 8.4%−12.2%),Reference Allegranzi, Bagheri Nejad and Combescure 1 Southeast Asia (9.0%; 95% CI, 7.2%–10.8%),Reference Ling, Apisarnthanarak and Madriaga 3 , Reference Cai, Venkatachalam and Tee 29 and East Asia (Table 4),Reference Morioka, Hirabayashi and Iguchi 30 the summarized HAI prevalence in Chinese reports was quite low, particularly because the data were almost exclusively from tertiary-care or specialty hospitals.
TABLE 4 The Prevalence of Healthcare-Associated Infections (HAIs) in Asian Pacific Countries, 2006–2016

NOTE. N/A, not reported; PPS, point prevalence survey.
a Southeast Asian countries: Philippines, Vietnam, Thailand, Malaysia, Singapore, and Indonesia.
b 95% CI not reported.
This low prevalence may be explained in several ways. First, in the Chinese HAI definitions differ from CDC and ECDC definitions,Reference Wang, Hu, Harbarth, Pittet, Zhou and Zingg 17 and they have not been updated since their publication by the Ministry of Health in 2001.Reference Wang, Hu, Harbarth, Pittet, Zhou and Zingg 17 – Reference Liu, Wu, Cai and Zhou 21 , Reference Ren, Wen and Wu 28 Furthermore, a recent multicenter PPS from China suggested that microbiological confirmation may be overvalued (ie, >80% of LRTI were microbiologically confirmed).Reference Wang, Hu, Harbarth, Pittet, Zhou and Zingg 17 Second, the unsurprisingly low prevalence from maternal and child health hospitals (1.88%) contributes to the overall prevalence in both the systematic review and the national reports. By excluding these data, the overall prevalence was 4.0%, which is similar to the recent US data.Reference Magill, Edwards and Bamberg 16 Third, there is no validation of surveillance. In most hospitals, data collection is done by physicians, who have an interest in reporting as few HAIs as possible.Reference Wang, Hu, Harbarth, Pittet, Zhou and Zingg 17 Fourth, antibiotic prescription in Chinese hospitals is disturbingly high. Up to 70% of inpatients receive antimicrobials, as estimated in an evaluation of more than 230,000 prescriptions between 2007 and 2009 by 784 community health institutions.Reference Li, Xu and Wang 31 , Reference Wang, Zhang, Han, Xing, Wu and Yang 32 Antibiotic use reported by the publications of this systematic review revealed a prevalence of 39.47%, with the highest prevalence of 66.47% in children’s hospitals (Supplementary Table 4). This proportion is higher than in Europe (35.0%) 11 but lower than in the United States (51.9%).Reference Magill, Edwards and Bamberg 16 High antimicrobial use, together with overvaluing microbiology for case definition, can result in underreporting, particularly for BSI, which is defined by the presence of microorganisms in blood. Indeed, BSI among children in our review was unexpectedly low (50 of 880; 5.68%) compared to the past ECDC-PPSs, in which the proportion of BSI among HAI in children was 45%.Reference Zingg, Hopkins, Gayet-Ageron, Holmes, Sharland and Suetens 33 Fifth, hospital managers do not invest sufficient resources to infection prevention and control.Reference Sun 6 Furthermore, knowledge about infection prevention and control outside hand hygiene is low among both doctors and nurses.Reference Zhou, Zhang and Chen 34 Together, this results in a lack of expertise in performing HAI surveillance.
The HAI prevalence in children’s hospitals (4.43%) was similar to the past ECDC PPS report (4.2%) for neonates, children, and adolescents.Reference Zingg, Hopkins, Gayet-Ageron, Holmes, Sharland and Suetens 33 The low numbers in pediatric wards of general hospitals (2.09%) is most likely due to case-mix variation. Pediatric clinics in tertiary-care general hospitals usually are small and offer primary and secondary pediatric care. Only 1 publication reported on HAI prevalence for the NICU and PICU in a children’s hospital: 16.43% (95% CI, 12.29%–21.30%) and 12.76% (95% CI, 8.43%–18.25%), respectively.Reference Yin, Ma, Deng, Chen and Tang 35
In this study, LRTI was the most frequent HAI, which is consistent with the 2014 Chinese National PPS report, as well as the 2011/2012 ECDC PPS and the 2011 US PPS. 11 , Reference Magill, Edwards and Bamberg 16 , Reference Ren, Wen and Wu 28 Interestingly, SSIs were equally distributed among hospital settings but were low in children’s hospitals, which may be due to low surgical activity, the type of surgical intervention, and/or short LOS. Furthermore, GI was the most frequent HAI in children’s hospitals and maternal and child health hospitals, most likely due to viral gastroenteritis. Maternal and child health hospitals had a very high proportion of URTI (121 infections, 32.35%), a finding that has not yet been described.
The HAI prevalences varied among geographical regions and among provinces and municipalities. Some of the variation can be explained by differences of GDP per capita. High-income areas (eg, Beijing) with more medical resources had a lower HAI prevalence.Reference Liu, Wu, Cai and Zhou 21 Most reports from general hospitals (40 of 42) were published in 2010 or later, following the introduction of mandatory surveillance activities in mainland China in 2009.
The most frequent microorganism in general hospitals was P. aeruginosa (3,395, 14.91%), which is similar to findings of the national PPS report in 2014 (2,140, 15.53%). K. pneumonia (66, 19.08%) was the most common microorganism isolated in the children’s hospitals, whereas, in Europe and the United States, the most common pathogen in children were coagulase-negative staphylococci (CoNS) (21% and 31.6%, respectively).Reference Zingg, Hopkins, Gayet-Ageron, Holmes, Sharland and Suetens 33 , Reference Sohn, Garrett and Sinkowitz-Cochran 36 Only in maternal and child health hospitals, CoNS ranked among the 5 most common microorganisms, with only 6.45%. The CHINET surveillance program reported CoNS as the most common microorganism isolated from blood cultures.Reference Li, Zhu and Wang 37 Given that BSI accounted for a lower proportion of HAI in the child population in China, it is not surprising that CoNS did not emerge as the most common pathogen. The finding that gram-negative bacilli ranked highest in all hospital settings, particularly K. pneumoniae, E. coli, P. aeruginosa, and A. baumannii, is in line with the findings of a large systematic review on data from low- and middle-income countries.Reference Allegranzi, Bagheri Nejad and Combescure 1
The number of publications reporting HAI-PPSs in China was unexpectedly high. Still, these findings cannot be considered conclusively representative for acute healthcare in mainland China. First, reports largely focus on the southeastern provinces, where both population density and socio-economic status are high (Supplementary Table 3). The total population of these provinces contributes to ~48% of the entire population in mainland China. Together, this limits representativeness for the entire country, particularly for less populated, rural areas. Second, publications addressed predominantly tertiary-care hospitals, with a lower number of publications from other settings, such as children’s, maternal and child health, and oncology hospitals. Third, the reported HAI prevalence is consistently low compared to other data, which raises concerns about definitions and survey quality and limits comparisons with other data. However, this is the best evidence available at this time,Reference Wang, Hu, Harbarth, Pittet, Zhou and Zingg 17 and large variations across studies have been described by others.Reference Allegranzi, Bagheri Nejad and Combescure 1 , Reference Zingg, Hopkins, Gayet-Ageron, Holmes, Sharland and Suetens 33 Despite differences, frequencies reported by the national surveillance system and this meta-analysis are similar: 3.1% and 2.7% in the meta-analysis and the 2014 national report, respectively. On the other hand, only 17 of 115 studies were of high quality. Notably, data on multidrug-resistant organisms were very limited and far from representative. In an era of emerging resistance, and in the light of high antimicrobial use in China, more information on susceptibility to antimicrobials would have been expected from many PPS reports, particularly because the most common pathogens are K. pneumoniae, P. aeruginosa, and A. baumanni, in which resistance to carbapenems is emerging.
In conclusion, this is the largest systematic review on the prevalence of HAI in mainland China and the first published in a peer-reviewed journal. This systematic review serves as a benchmark for future PPSs and a reference for infection prevention and control strategies in mainland China.
ACKNOWLEDGMENTS
Financial support: No financial support was provided relevant to this article.
Potential conflicts of interest: All authors report no conflicts of interest relevant to this article.
SUPPLEMENTARY MATERIAL
To view supplementary material for this article, please visit https://doi.org/10.1017/ice.2018.60.