


The National Healthcare Safety Network (NHSN) receives reports of central-line–associated bloodstream infections (CLABSIs) from >4,000 US acute care hospitals. Data are now publicly reported as a measure of healthcare quality and are used to determine reimbursement through the Centers for Medicare and Medicaid Services Hospital Inpatient Quality Reporting Program.Reference KM. 1
Some bloodstream infections (BSIs) meet the NHSN CLABSI definition but are not related to central-line care.Reference Pehar, Ristaino and Budd 2 – Reference Worth, Slavin, Brown and Black 8 For example, among immunocompromised patients, BSIs may result from translocation of gut microorganisms related to mucosal barrier injury, defined as alteration of normal gastrointestinal microbiota, or loss of mucosal integrity in the setting of impaired host defenses.Reference Tancrede and Andremont 9 , Reference Blijlevens, Donnelly and De Pauw 10 To identify the subset of CLABSIs most likely associated with mucosal barrier injury among oncology patients and therefore less likely to be prevented through evidence-based central line insertion and maintenance practices, the mucosal barrier injury-laboratory confirmed bloodstream infection (MBI-LCBI) definition was established in NHSN. 11 In 2012, field-testing of the new definition was conducted in a convenience sample of 193 patient locations in 38 acute care hospitals to assess the feasibility of integrating the MBI-LCBI definition into CLABSI reporting.Reference See, Iwamoto, Allen-Bridson, Horan, Magill and Thompson 12 However, the potential impact of the MBI-LCBI definition on CLABSI rates among various location types and on a national level was not determined.
In January 2013, optional reporting of MBI-LCBI cases as part of NHSN CLABSI surveillance was initiated. The primary objective of this analysis was to describe MBI-LCBIs reported to NHSN during 2013 and determine the impact of removing MBI-LCBIs from CLABSI rates.
METHODS
Facilities and Locations
Due to optional reporting of MBI-LCBIs to NHSN in 2013, 2 groups of surveillance settings were defined for this analysis. The first group included inpatient locations performing CLABSI surveillance that reported ≥1 MBI-LCBI to NHSN in 2013. The second group comprised all inpatient locations in short-stay acute care hospitals performing CLABSI surveillance during 2013, regardless of MBI-LCBI reporting. Because it was unknown when a location initiated surveillance for MBI-LCBI during 2013, any location that reported ≥1 MBI-LCBI was assumed to have reported for the entire year. Neonatal, behavioral health, prenatal obstetrical/labor and delivery, and post-partum locations were excluded from both groups.
CLABSI and MBI-LCBI Definitions
A CLABSI was defined as a laboratory-confirmed primary bloodstream infection with a central-line was in place for >2 calendar days. 13 For each month of surveillance, participating hospital locations submitted microbiologic and other information about CLABSI events as well as the monthly total patient days and central-line days for that location to NHSN according to the NHSN CLABSI protocol in place at that time.
Potential MBI-LCBI cases had to first meet criteria for an NHSN healthcare-associated primary BSI. 13 In addition, they had to satisfy criteria from 2 separate categories (Table 1): (1) the organism(s) cultured from blood were from a group of selected organisms known to be commensals of the oral cavity or gastrointestinal tract (organism criteria), and (2) the patient had 1 of 2 clinical conditions compatible with the presence of mucosal barrier injury (clinical condition criteria, Table 1). For a BSI to be classified as MBI-LCBI, both the organism criterion and clinical condition criterion had to be satisfied. 13
TABLE 1 Patient and Organism Criteria for the National Healthcare Safety Network (NHSN) Mucosal Barrier Injury Laboratory-Confirmed Bloodstream Infection (MBI-LCBI) Definition Used in 2013
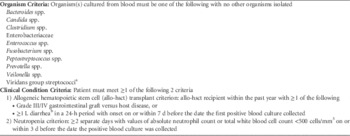
a Viridans group streptococci must be isolated from 2 blood cultures and in a patient with signs and/or symptoms as specified in the NHSN protocol for central-line–associated bloodstream infections. 13
b Or ≥20 mL/kg in a 24-hour period for patients <18 years of age.
Analysis
A descriptive analysis of facility and location characteristics as well as organism and patient characteristics for the reported MBI-LCBIs was performed. CLABSI incidence rates were calculated as the number of CLABSIs per 1,000 central-line days. Analyses were performed for the 2 surveillance groups to assess (1) the impact of MBI-LCBIs on CLABSI rates among the subset of locations that reported MBI-LCBIs in 2013 and (2) the impact of MBI-LCBIs on overall CLABSI rates among locations performing CLABSIs surveillance in 2013. Within each group, locations were stratified into 4 mutually exclusive types: oncology locations (both ward and critical care units), non-oncology ward locations (eg, GI, pulmonary, and telemetry ward locations; and adult and pediatric medical, surgical, and medical/surgical ward locations), non-oncology critical care locations (ie, non-oncology intensive care units), and “other” locations (ie, any location not classified in another group, eg, orthopedic wards, long-term acute care, neurosurgery wards). Pooled mean CLABSI rates per 1,000 central-line days with MBI-LCBIs and without MBI-LCBIs were calculated, and the percent difference in CLABSI rates was assessed to determine the change in CLABSI rates overall and by location type. All analyses were performed using SAS, version 9.3 (SAS Institute, Cary, NC).
RESULTS
Facility and Inpatient Unit Characteristics
In total, 17,217 CLABSIs were reported to NHSN from 14,181 eligible locations in 3,421 acute care hospitals; 418 of these locations in 252 acute care facilities reported ≥1 MBI-LCBI. Among the locations that reported MBI-LCBIs, 3,162 CLABSIs were reported, and 1,415 of them (44.8%) met the MBI-LCBI definition (8.2% of the total 17,217 CLABSIs reported). General hospitals accounted for most of the MBI-LCBIs reported (62.4%, n=883), followed by specialty oncology hospitals (22.3%, n=316), children’s hospitals (14.8%, n=209), and other hospitals (0.5%, n=7). Most MBI-LCBIs (79.2%, n=1,120) were reported from oncology locations (Table 2).
TABLE 2 Summary of Data from Locations that Reported Mucosal Barrier Laboratory-Confirmed Bloodstream Infections (MBI-LCBIs) to the National Healthcare Safety Network (NHSN), 2013

NOTE. CLABSI, central line-associated bloodstream infection.
a Both oncology ward and critical care units.
b GI, pulmonary, and telemetry ward locations; and adult and pediatric medical, surgical, and medical/surgical ward locations.
c Non-oncology critical care units
d Any location not otherwise classified in another group.
Descriptive Characteristics of MBI-LCBI
A total of 1,542 pathogens were reported among the 1,415 MBI-LCBIs; 127 MBI-LCBIs (8.2%) had 2 organisms reported. The leading 5 organisms among the MBI-LCBI were Escherichia coli (23.7% of organisms reported), Enterococcus faecium (17.5%), Klebsiella pneumoniae (10.3%), viridans streptococci (7.3%), and Enterobacter cloacae (5.3%). Together, these 5 pathogens accounted for nearly two-thirds of all MBI-LCBIs reported.
Most MBI-LCBI (90%) were identified among patients who only met the neutropenic patient criterion; 84 MBI-LCBIs (6%) were identified among patients who only met the allogeneic hematopoietic stem cell patient (allo-hsct) criterion, and 4% were identified among patients who met both criteria. Among the cases that met the allo-hsct patient criterion only, 39 (46%) had documentation of graft vs host disease (with or without diarrhea), while 45 (54%) had only diarrhea documented (without GVHD).
CLABSI Rate Differences among Locations that Reported MBI-LCBIs
The pooled mean CLABSI rate among locations that reported ≥1 MBI-LCBI during 2013 was 2.13 per 1,000 central-line days. After removing MBI-LCBIs from the CLABSI data, the pooled mean CLABSI rate decreased to 1.18 CLABSIs per 1,000 central-line days, a 44.8% decrease. No notable monthly trend in the percentage of CLABSIs that met the MBI-LCBI definition was identified. When stratified by location type, removing MBI-LCBI from the CLABSI rate determinations resulted in decreases in pooled mean CLABSI rates ranged from 25.2% in critical care locations to 49.2% in oncology locations (Figure 1).
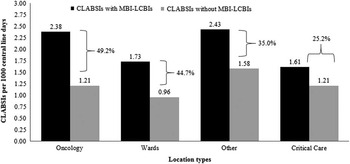
FIGURE 1 Impact of mucosal barrier laboratory-confirmed bloodstream infections (MBI-LCBIs) on central line-associated bloodstream infection (CLABSI) rates in locations that reported ≥1 MBI-LCBI in 2013. Black bars represent the CLABSI rate per 1,000 central-line days including MBI-LCBIs. Gray bars represent the CLABSI rates without MBI-LCBIs. The percent change in the CLABSI rate is indicated for each location type. Overall, there was a 44.8% decrease among locations that reported ≥1 MBI-LCBI in 2013 (not shown).
Overall CLABSI Rate Differences
The pooled mean CLABSI rate among all locations was 1.00 per 1,000 central-line days. After removing MBI-LCBIs, the pooled mean CLABSI rate decreased to 0.92 CLABSIs per 1,000 central-line days, an 8.4% decrease. When stratified by location type, the decline in pooled mean CLABSI rates ranged from 1.2% in other locations to 37.9% in oncology locations (Figure 2).
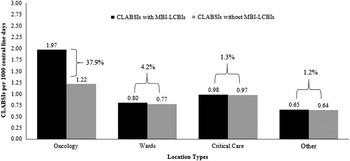
FIGURE 2 Impact of mucosal barrier laboratory-confirmed bloodstream infections (MBI-LCBIs) on central-line–associated bloodstream infection (CLABSI) rates in all locations, irrespective of MBI-LCBI reporting. Black bars represent the CLABSI rate per 1,000 central-line days including MBI-LCBIs. Gray bars represent the CLABSI rates without MBI-LCBIs. The percent change in the CLABSI rate is indicated for each location type. Overall, there was an 8.4% decrease among all locations, irrespective of MBI-LCBI reporting (not shown).
DISCUSSION
This is the first large-scale evaluation of the impact of the exclusion of MBI-LCBI on national CLABSI rates. Among locations for which ≥1 MBI-LCBIs in 2013 were reported, overall CLABSI rates were reduced by 45% when MBI-LCBIs were removed. However, among all locations participating in CLABSI surveillance, removing MBI-LCBI reduced the overall CLABSI rate by 8%. These findings provide insight for understanding and interpreting changes in the epidemiology of CLABSIs, such as monitoring progress toward CLABSI elimination as part of the HHS Action Plan, 14 and for informing changes to state and federal mandatory or incentivized reporting programs.
The MBI-LCBI definition was developed to enable identification of BSIs among oncology patients that may not be related to central lines. MBI-LCBIs comprised between 40% and 50% of CLABSI reported from oncology locations, indicating a substantial burden of healthcare-associated BSIs among the oncology patient population. Several studies have demonstrated that gastrointestinal tract organisms are more common causes of BSIs among immunocompromised patients compared with other hospitalized patients, suggesting an alternative mechanism for infection other than central lines.Reference Steinberg, Robichaux, Tejedor, Reyes and Jacob 4 , Reference Tancrede and Andremont 9 , Reference Gaur, Bundy and Gao 15 , Reference Freeman, Elinder-Camburn and McClymont 16 In addition, a recent retrospective analysis from a single institution showed that CLABSI prevention measures did not affect rates of MBI-LCBIs.Reference Metzger, Rucker and Callaghan 17 Therefore, optimizing central-line insertion and maintenance practices will not address some MBI-LCBIs in these settings, and additional efforts to develop and implement prevention strategies for these BSIs are needed to prevent patient morbidity.Reference Rettig, Gross and Ditaranto 6 , Reference Digiorgio, Fatica and Oden 7 , Reference Freeman, Elinder-Camburn and McClymont 16
Removing MBI-LCBI events from calculated CLABSI rates had only a small effect on overall rates. However, among locations that reported MBI-LCBI events, removing MBI-LCBI events decreased CLABSI rates by 45%, a proportion similar to the decrease in oncology locations. This finding emphasizes the heterogeneity of the patients cared for in inpatient locations that are mapped to the same NHSN location type, and the limitations of risk adjustment based on location type. Moving forward, it is important to note that MBI-LCBI and CLABSI data reported to NHSN during 2015 will be used as the baseline period for the calculation of CLABSI standardized infection ratios.
We are aware of some limitations. First, we excluded some specific location types (ie, behavioral health, prenatal obstetrical/labor, and delivery) due to low central-line use and the low numbers of CLABSIs reported to NHSN. In addition, we excluded neonatal locations due to differences in reporting of CLABSI rates (by birthweight) compared with the pediatric and adult populations.Reference Dudeck, Edwards and Allen-Bridson 18 These exclusions likely did not affect our assessment of the impact of the MBI-LCBI definition on CLABSI rates overall. Second, our analysis is based on optional reporting of MBI-LCBIs; therefore, locations that reported MBI-LCBI events during 2013 may not be representative of all locations that could have reported MBI-LCBIs in 2013. Furthermore, we assumed that any location that reported at least 1 MBI-LCBI during 2013 reported for the entire year. It is difficult to know how these factors may have over- or underestimated the impact of MBI-LCBIs on CLABSI rates. It will be important to confirm these findings through analysis of NHSN CLABSI data reported beginning in 2014 when MBI LCBI reporting became routinely required.
In conclusion, our findings suggest that the impact of removing MBI-LCBIs from CLABSI rates might be large for oncology locations and certain non-oncology hospital units but less substantial for overall national CLABSI rates if 2013 reporting is representative of overall trends. NHSN is committed to ensuring the utility of its data for directing prevention needs locally and guiding public policy decisions. These findings will facilitate the interpretation of changes in NHSN CLABSI data over time and inform changes to reporting MBI-LCBIs in the context of CLABSI quality measurement and public reporting.
ACKNOWLEDGMENTS
Financial support: No financial support was provided relevant to this article.
Potential conflicts of interest: All authors report no conflicts of interest relevant to this article.
DISCLAIMER. The findings and conclusions in this report are those of the authors and do not necessarily represent the official position of the Centers for Disease Control and Prevention.


