


Infections caused by multidrug-resistant organisms (MDROs) are associated with significant mortality and carry an important economic burden.Reference Laxminarayan, Duse and Wattal 1 Microbiome dysbiosis, defined as an imbalance between beneficial and potentially deleterious microorganisms,Reference Olesen and Alm 2 is associated with increased risk of MDRO colonization and infection.Reference Taur, Xavier and Lipuma 3 , Reference Araos, Tai, Snyder, Blaser and D’Agata 4 The Centers for Disease Control and Prevention (CDC) has begun to work on developing microbiome disruption indices (MDIs): characteristics of microbiome dysbiosis that can identify patients at increased risk of MDRO colonization, infection, and transmission.Reference Halpin and McDonald 5 MDIs could be used to develop rapid MDRO detection methods and to prompt placement of patients on isolation precautions in an effort to limit MDRO spread.
We previously reported MDIs in the fecal microbiomes of patients who acquired MDROs during their hospitalization and showed that a greater abundance of Lactobacillus spp. was suggestive of protection against MDRO acquisition.Reference Araos, Tai, Snyder, Blaser and D’Agata 4 Other potential biomarkers predicting MDRO colonization include reductions in microbial diversity and the relative abundance of the anaerobic compartment of the microbiome.Reference Halpin, de Man and Kraft 6 , Reference Andersen, Connolly, Bangar, Staat, Mortensen and Deburger 7
In the current study, we sought to characterize the MDIs of hospitalized patients who were colonized with MDRO at hospital admission. We also used metagenomic inference to include indices of metabolic pathways that could predict MDRO colonization at hospital admission.
METHODS
Study Population
Adult patients hospitalized (<48 hours) on medical/surgical wards in a 649-bed, tertiary-care center in Boston, Massachusetts, were approached for study participation. The exclusion criteria included (1) patients unable to consent, (2) those with conditions that precluded rectal sampling (eg, with colostomy bags), and (3) specimens that did not have sufficient DNA for sequencing. The hospital’s institutional review board approved the study protocol, and informed consent was obtained from all subjects prior to specimen and data collection.
Data and Sample Collection
After patients agreed to participate, clinical and demographic data were collected, including the Charlson comorbidity indexReference Charlson, Szatrowski, Peterson and Gold 8 and exposure to antimicrobials or healthcare-associated facilities in the prior 3 months. Rectal specimens were obtained by inserting a sterile, double-tipped cotton swab (Starswab II; Starplex Scientific, Cleveland TN) 0.5–1.0 cm into the anus. Samples were then transported to a central laboratory located in the study hospital within 1–2 hours after collection. Once in the laboratory, the first tip of the swab was immediately processed for MDRO identification using standard techniques,Reference Mitchell, Shaffer, Kiely, Givens and D’Agata 9 and the second tip was placed in a 20% glycerol vial and stored at −80°C for subsequent assessment of microbial communities.
Microbiological Methods
Identification of MDROs and antimicrobial susceptibility testing were performed as previously described using the Clinical and Laboratory Standards Institute (CLSI) methodology.Reference Snyder 10 , 11 MDROs included methicillin-resistant Staphylococcus aureus (MRSA), vancomycin-resistant enterococci (VRE), and multidrug-resistant gram-negative bacilli (MDRGN). MDRGN were defined as gram-negative bacteria resistant to ≥3 of the following antimicrobials: ampicillin/sulbactam or piperacillin/tazobactam, ceftriaxone or ceftazidime (in case of Pseudomonas spp. only ceftazidime), ciprofloxacin, gentamicin, or meropenem.
16S rRNA Sequencing and Bioinformatic Approach
For each rectal specimen, bacterial DNA was extracted as described.Reference Araos, Tai, Snyder, Blaser and D’Agata 4 Subsequently, the 16S rRNA amplicon library was generated by polymerase chain reaction (PCR) using a barcoded primer set targeted to the V4 variable region.Reference Caporaso, Lauber and Walters 12 Amplicons were then sequenced on an MiSeq sequencer (Illumina, San Diego, CA) at the Tufts University Core Facility using a paired-end 250-bp protocol with reads merged as described.Reference Caporaso, Lauber and Walters 12
Subjects were classified according to the presence or absence of MDRO colonization (ie, MDRO+ [positive] or MDRO– [negative], respectively). Relevant patient characteristics were compared between the 2 groups using the Wilcoxon rank-sum test or the Fisher exact test. A significance level of P≤.05 was used for all statistical tests. Statistical analyses were performed using STATA version 13.0 software (StataCorp, College Station, TX).
Bioinformatic analyses were performed using the QIIME version 1.7 software packageReference Caporaso, Kuczynski and Stombaugh 13 following the pipeline previously reported.Reference Araos, Tai, Snyder, Blaser and D’Agata 4 First, within-sample microbial diversity (α diversity) was estimated using the Shannon indexReference Magurran 14 and was compared between MDRO+ and MDRO− patients. Second, associations between microbial diversity and MDRO colonization were analyzed using multiple logistic regression with the Shannon index as the predictor and MDRO colonization with ≥1 MDRO species as the outcome variable. To account for potential confounders, other risk factors for MDRO acquisition were included a priori as covariates if they were statistically significant on univariate analyses. Third, the diagnostic performance of the Shannon index was investigated by running receiver operating characteristic curves (ROCs) and estimating the area under the ROC curve (AUC).
Differences in community composition between MDRO+ and MDRO– were analyzed by estimating weighted and unweighted UniFrac distancesReference Lozupone and Knight 15 and were visualized using principal coordinates analysis (PCoA).Reference Vázquez-baeza, Pirrung, Gonzalez and Knight 16 Within- and between-group distances were compared using nonparametric testing (ie, 999 Monte Carlo permutations, Bonferroni-corrected). In addition, differential sample clustering according to MDRO status was investigated using the adonis test implemented in QIIME pipeline. Differentially abundant bacterial taxa at any phylogenetic level between groups were determined by performing linear discriminant analysis (LDA) effect size (LEfSe) analysis, using an LDA score of 2.0 as the cutoff and an α level of 0.05.Reference Segata, Izard and Waldron 17
Finally, the functional profile of each sample was analyzed using reconstruction of unobserved states (PICRUSt) to infer the metagenome from the 16S rRNA data. Functional profiles were assessed using the PICRUSt Predict Metagenome tool.Reference Langille, Zaneveld and Caporaso 18 The quality of the metagenome prediction was estimated by calculating the mean nearest sequenced taxon index (NSTI), where low values (<.06) indicate accurate prediction.Reference Langille, Zaneveld and Caporaso 18 The predicted Kyoto Encyclopedia of Genes and Genomes (KEGG) orthology terms where then analyzed using LEfSe (LDA score ≥2.0 and α value≤0.01) to identify genes that were differentially abundant between MDRO+ and MDRO− groups. The pathways and gene descriptions of KEGG orthology terms were then obtained from the KEGG Brite database.Reference Kanehisa, Sato, Kawashima, Furumichi and Tanabe 19
RESULTS
Clinical Characteristics and MDRO Colonization
From May 27, 2013, to January 24, 2014, 49 patients completed the study. Of these, 5 patients were excluded due to unsuccessful sequencing of the rectal sample. The median age of the study cohort was 66 years (interquartile range [IQR], 59–75 years), and 34 (77%) were male. Furthermore, 11 patients were colonized with at least 1 MDRO at hospital admission, among whom 5 patients were cocolonized with >1 MDRO, and 7 patients (63.6%) had a history of MDRO colonization in the previous year. The MDROs isolated at baseline were Escherichia coli (n=4), Klebsiella pneumoniae (n=3), Proteus mirabilis (n=1), Citrobacter freundii (n=1), Pseudomonas aeruginosa (n=1), VRE (n=3), and MRSA (n=3).
Compared to MDRO− patients, MDRO+ patients had a significantly higher Charlson comorbidity index (7 [IQR, 6–9] vs 4 [IQR, 3–7]; P=.05). The MDRO+ patients were more frequently exposed to healthcare-associated facilities (90.9% vs 57.6%; P=.07), and they had greater antimicrobial exposure during the 3 months prior admission (90% vs 48.4%; P=.02). Age, gender, diabetes mellitus, obesity, gastrointestinal disease, and current use of proton pump inhibitors were similar between MDRO+ and MDRO− patients (P>.5) (Tables 1 and 2).
TABLE 1 Clinical and Demographic Characteristics of the Study Population
NOTE. IQR, interquartile range; HCAF, healthcare-associated facility; MDRO, multidrug-resistant organism.
a Therapy >14 days.
TABLE 2 Prior and In-Hospital Antimicrobial Exposure

NOTE. IQR, interquartile range.
Fecal Microbiome Assessment
A total of 44 baseline rectal specimens were successfully sequenced, yielding 3,638,570 high-quality 16S rRNA gene sequences after quality filtering, with a median number of sequences per sample of 84,752 (IQR, 68,472–96,133). Alpha diversity metrics were estimated at a sequencing depth of 7,300 reads per sample. The overall range of the Shannon index in the study population was 1.53–6.65. The median Shannon index differed significantly between MDRO+ and MDRO− patients (3.03 [IQR, 2.40–4.57] vs 4.43 [IQR, 3.96–4.93]; P=.005) (Figure 1A), and it was inversely associated with MDRO colonization (odds ratio [OR] for each additional increment of the Shannon index, 0.23; 95% confidence interval [95% CI], 0.09–0.62; P=.004). The inverse association between the Shannon index and MDRO colonization remained significant after adjusting for the Charlson index, prior antimicrobial exposure, and prior stay in healthcare-associated facilities (adjusted odds ratio [OR], 0.26; 95% CI, 0.07–0.92; P=.04). The AUC of the ROC curve for the Shannon index as a predictor of MDRO− status was 0.79 (95% CI, 0.61–0.96) (Figure 1B). For a Shannon index cutoff ≥3.62, the sensitivity and specificity to detect MDRO− patients was 93.9% and 63.6%, respectively. Using this optimal cutoff, the Shannon index correctly classified 86.4% of the 44 patients according to their MDRO status.
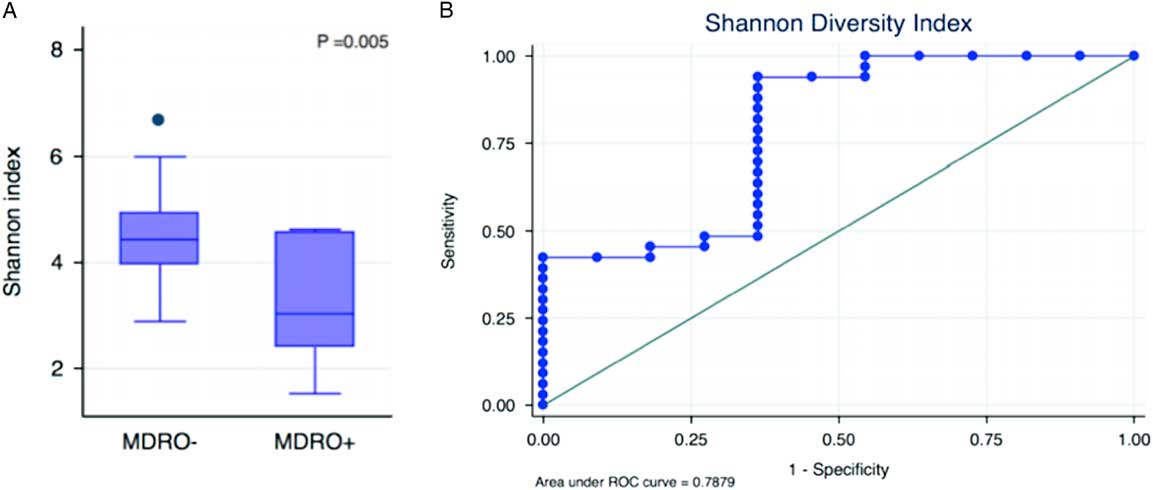
FIGURE 1 Microbial disruption indices associated with MDRO colonization at hospital admission: (A) microbial diversity compared between MDRO− and MDRO+ patients, and (B) the area under receiver operating characteristic (ROC) curve for the Shannon index as a predictor of MDRO− status.
The composition of the bacterial communities of MDRO+ and MDRO− patients also differed significantly. First, the within-group distances were significantly lower in MDRO− compared to MDRO+ patients (Bonferroni corrected, nonparametric P=.01), indicating that samples among MDRO− patients were more homogeneous than the samples of MDRO+ individuals (Figure 2A). Second, between-group distances were higher than within-group distances, suggesting that marked differences in community composition were present when comparing MDRO− versus MDRO+ patients (Figure 2A). The principal coordinates analysis (PCoA) of unweighted UniFrac distances showed differential clustering of samples according to MDRO status (Figure 2B). The analysis of differentially abundant taxonomic features between groups is shown in Figure 3.
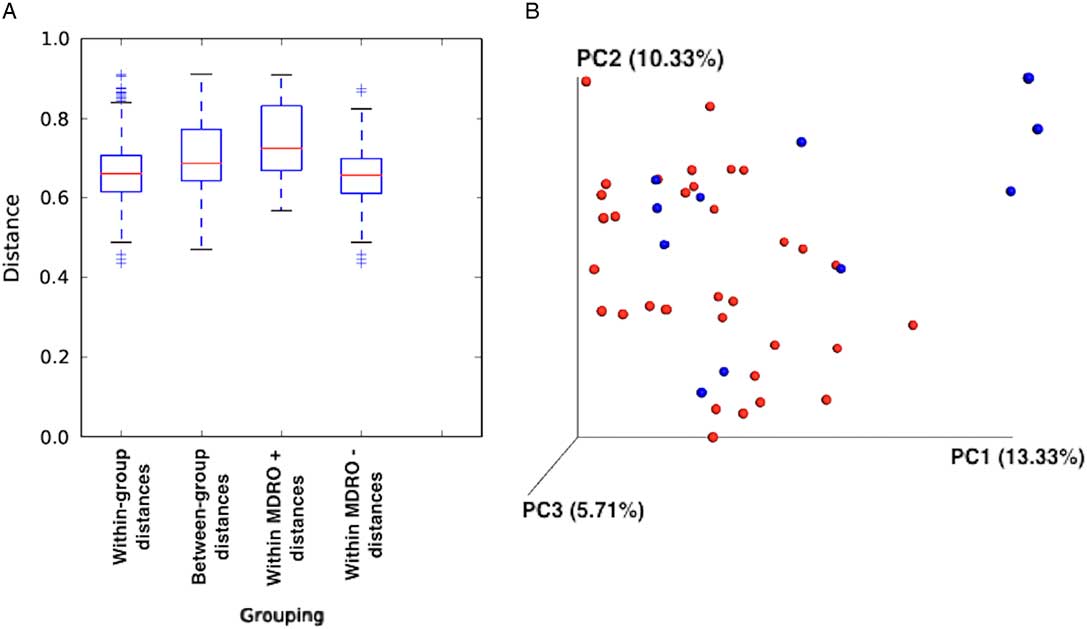
FIGURE 2 Unweighted UniFrac distances. (A) Between-group distances were significantly higher than within-group distances (Bonferroni corrected, nonparametric P=0.01). (B) Principal coordinate analysis (PCoA) of unweighted UniFrac distances according to MDRO colonization status (P=0.01, R2=0.04). Blue dots, MDRO+; red dots, MDRO−.
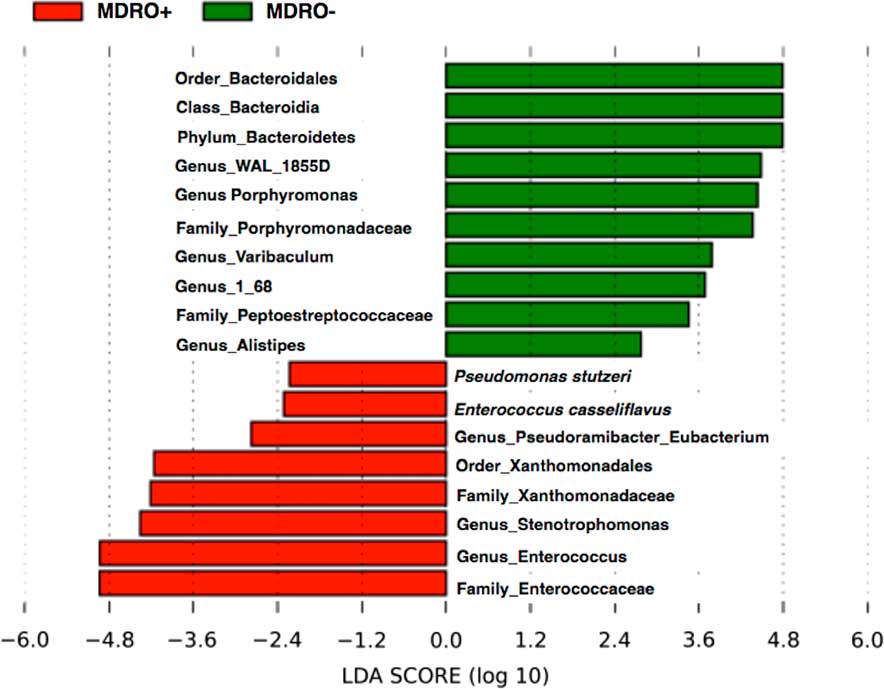
FIGURE 3 Linear discriminant analysis (LDA) effect size (LEfSe) showing differential abundance of taxa between MDRO+ and MDRO−.
Overall, 20 genes were identified with significant differences in relative abundance between MDRO+ and MDRO− patients and are summarized in Table 3. MDRO colonization was correlated with increased abundance of genes related to multidrug-resistance: the 2-component systems, and membrane transport (phosphotransferase systems, and ATP-binding cassette transporters). MDRO− status was associated with higher abundance of amino acid and nucleotide metabolism genes (Figure 4).
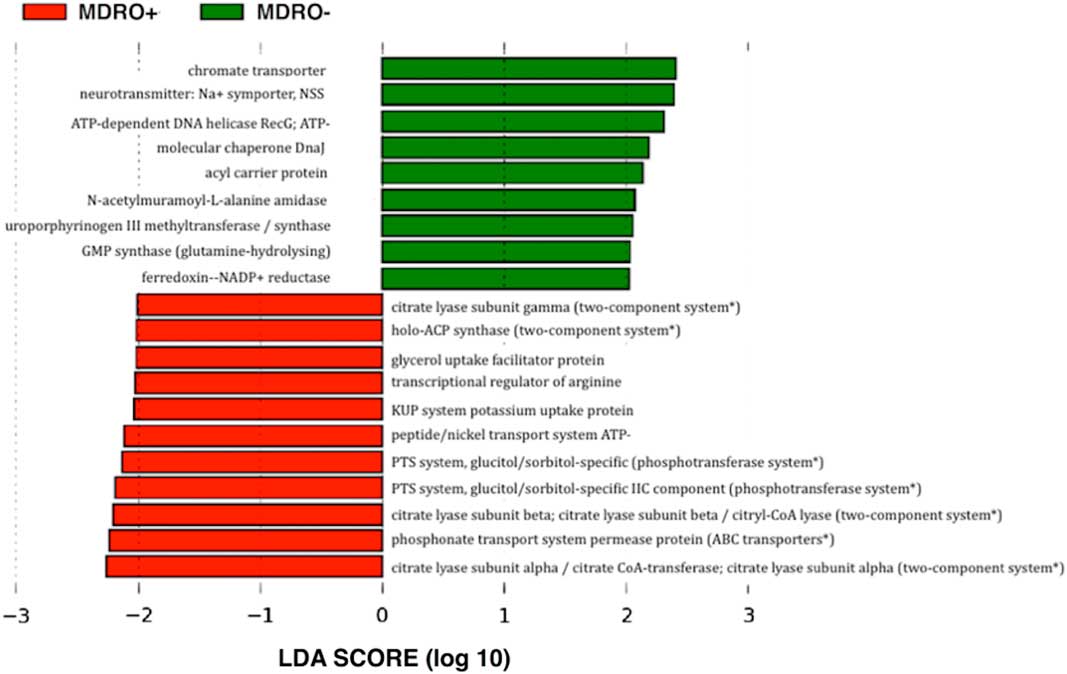
FIGURE 4 Linear discriminant analysis (LDA) effect size (LEfSe) output showing differential abundance of functions observed according to the metagenomic prediction, mean nearest sequenced taxon index, 0.05 (SD±0.03). *Predicted metabolic pathways associated with multidrug-resistance mechanisms.
TABLE 3 Differentially Abundant Genes Associated With Multidrug-Resistance Mechanisms That Significantly Differed Between MDRO− and MDRO+ According to the Metagenomic Prediction of 16S rRNA Sequence Data
NOTE. LDA, linear discriminant analysis; ACP synthase, 4´-phosphopantetheinyl transferase; PTS system, phosphotransferase system; ABC, adenosine triphosphate-binding cassette.
DISCUSSION
Several MDIs were associated with colonization with MDRO among patients at hospital admission. Compared with MDRO− patients, the intestinal microbiota of MDRO+ patients had substantially lower microbial diversity, even after adjusting for potential confounders of MDRO colonization, including prior stay in healthcare-associated facility and antimicrobial exposure. Reduced microbial diversity has been associated with adverse clinical outcomes. Among patients undergoing hematopoietic stem-cell transplantation, a profound decrease in microbial diversity preceded intestinal domination by specific bacterial pathogens and increased the risk of subsequent VRE or gram-negative bacteremia.Reference Taur, Xavier and Lipuma 3 In the same patient setting, low intestinal microbial diversity has been shown to be an independent predictor of mortality.Reference Taur, Jenq and Perales 20 Similarly, the intestinal microbiota of patients with recurrent Clostridium difficile infection (CDI), in particular those with severe disease, is also characterized by reduced microbial diversity compared to controls.Reference Seekatz, Rao, Santhosh and Young 21 Although data suggest that reduced microbial diversity itself does not constitute a causal mechanism for developing disease, it may be considered a biomarker of a disrupted microbiota.Reference Ubeda, Bucci and Caballero 22
Substantial differences in the composition of bacterial communities between the MDRO− and MDRO+ patients were also identified. These included a greater abundance of Enterococcus spp. and microbiota belonging to Bacteroidales order, among MDRO+ and MDRO− patients, respectively. These findings are consistent with previous reports showing severe disruptions in the fecal microbiota of hospitalized patients exposed to antimicrobials. Thus, higher abundances of pathogens such as enterococci may reflect an impaired colonization resistance. Several bacterial taxa have been associated with colonization resistance against transient pathogens, including MDROs. For example, a greater abundance of Lactobacillus spp. characterized the fecal microbiota of patients that remained uncolonized with MDRO during hospitalization.Reference Araos, Tai, Snyder, Blaser and D’Agata 4 Clostridium scindens has been shown to have a potentially protective effect against C. difficile and Barnesiella spp. against VRE colonization.Reference Ubeda, Bucci and Caballero 22 , Reference Pamer 23 Lastly, successful eradication of MDRO using fecal microbiota transplantation in patients with hematologic disease has been reported, with a high abundance of members of the Bacteroidales order characterizing the post-FMT microbiota of patients in whom MDRO was successfully eradicated.Reference Bilinski, Grzesiowski and Sorensen 24 In this study, the microbiome of patients not colonized with an MDRO also showed greater abundance of the Bacteroidales order, suggesting that this order may reflect a healthier microbiome that is more resistant to MDRO colonization.Reference Bilinski, Grzesiowski and Sorensen 24
Metagenomic prediction revealed a higher abundance of genes among MDRO+ patients related to several pathways implicated in multidrug resistance: the 2-component system, the ATP-binding cassette system, and the phosphotransferase system.Reference Richmond, Evans and Anderson 25 – Reference Ham, Lee and Jeong 27 These results are consistent with our phenotypic identification of MDROs using classical culture-dependent microbiological methods, and they highlight the potential to identify metabolic pathways and their byproducts as potential biomarkers of MDRO colonization, which may be widely applicable considering the functional stability of the human microbiome. 28 A recent study by Zhernakova et alReference Zhernakova, Kurilshikov and Bonder 29 showed that the protein chromogranin A, retrieved from the stool, had a strong negative correlation with microbial diversity in the gut, suggesting that this fecal biomarker could be used to ascertain gut health. The results of our study and others, suggest that similar biomarkers could be identified in the future that would predict MDRO colonization.
Our study has several limitations. First, our results are subject to unrecognized bias because the number of samples was relatively small. Therefore, the associations described should be interpreted with caution; no causal relationship between microbiome features and MDRO colonization can be established. Furthermore, as a cross-sectional study, the differences in microbiome characteristics cannot be considered predictive of the outcome. Second, the case definition (MDRO detection) was based on cultures that have variable sensibility, conveying a risk of misclassification bias. However, participants were extensively exposed to antimicrobials, which maximizes the sensitivity of the MDRO detection approach.Reference Snyder 10 Third, antimicrobial use is a well-recognized confounder in microbiome studies.Reference Blaser 30 Although prior and current antimicrobial exposures were variables considered in the analysis, differential exposure to types of antimicrobials between MDRO+ and MDRO− patients may have occurred. Finally, the functional prediction for a given bacterial community based on 16S rRNA sequence data may be subject to limitations when the availability of reference genomes is scarce. However, the low mean NSTI value (0.05) reported in this study indicates that closely related genomes were available and supports the accuracy of the prediction.Reference Langille, Zaneveld and Caporaso 18
Substantial advancement in characterizing microbiome dysbiosis predictive of disease states has been made.Reference Lloyd-Price, Abu-Ali and Huttenhower 31 Microbiome research focusing on MDRO transmission dynamics is at a younger stage. The findings of this study begin to characterize MDIs associated with MDRO colonization, including an independent and inverse association with microbiome diversity, differences in bacterial community structures, and metabolic pathways. Future larger studies are required to increase our understanding and application of microbiome analyses toward limiting MDRO transmission and spread, with the future goal of developing rapid tests that could detect MDRO colonization at hospital admission.
ACKNOWLEDGMENTS
Financial support: This work was supported in part by Becas Chile, CONICYT, Gobierno de Chile (RA) and National Institute of Allergy and Infectious Diseases (NIAID, grant no. K24 AI119158 to E.M.C.D.).
Potential conflicts of interest: The authors of this manuscript report no conflicts of interest relevant to this article.


