Surveillance has been cited as a useful tool to reduce healthcare-associated infections (HAIs).Reference Gastmeier, Geffers and Brandt1–Reference Meyer, Schroder, Gastmeier and Geffers8 Despite the substantial morbidity and mortality of healthcare-associated bloodstream infections (HABSIs), surveillance programs for all HABSIs are rare. Networks more commonly perform targeted surveillance that favor the monitoring of certain HABSIs, such as central-line–associated bloodstream infections (CLABSIs),Reference Blanchard, Fortin and Rocher9–Reference Zingg, Sax and Inan11 or limit surveillance to certain wards, such as intensive care units (ICUs).Reference Blanchard, Fortin and Rocher9, Reference Schwab, Geffers, Barwolff, Ruden and Gastmeier12, Reference Civitarese, Ruggieri and Walz13
However, surveillance limited to CLABSI would miss 70%–80% of HABSI cases,Reference Valles, Calbo and Anoro14 most of which would be secondary infections that are often more morbid with higher case-fatality rates than primary infections. Similarly, surveillance limited to ICUs would miss infections arising in acute-care wards, which can represent ~40%–70% of HABSIs.Reference Suljagic, Cobeljic and Jankovic15, 16 Although it is reasonable that institutions with limited resources focus their attention on the most frequent subtypes or the most vulnerable patients, such methods have impeded a more complete understanding of HABSIs and have hindered a potentially more extensive reduction in preventable cases.
To our knowledge, the handful of hospital-wide HABSI surveillance programs in progress have been established in Belgium,Reference Vrijens, Hulstaert, Van de Sande, Devriese, Morales and Parmentier17, Reference Ronveaux, Jans, Suetens and Carsauw18 Finland,Reference Lyytikainen, Lumio, Sarkkinen, Kolho, Kostiala and Ruutu19, Reference Kontula, Skogberg, Ollgren, Jarvinen and Lyytikainen20 Australia,Reference Si, Runnegar, Marquess, Rajmokan and Playford21, Reference Cope and Wilkinson22 and Quebec, Canada.Reference Fortin, Rocher, Frenette, Tremblay and Quach23, Reference Fakih, Fortin and Smith24 In 2007, the Surveillance des bactériémies nosocomiales panhospitalières (BACTOT) program was initiated in Quebec to monitor all HABSI in the province’s acute-care hospitals. BACTOT has grown from 40 participating hospitals in 2007–2008 to 89 in 2016–2017.16 Although BACTOT has been operating for >10 years, the effect of surveillance on HABSI rates has not yet been characterized. In this retrospective cohort study, we evaluated the association between each BACTOT surveillance year and hospital HABSI rates, using the first year of surveillance as a baseline. It was hypothesized that rates would drop progressively in the first few years of surveillance then begin to level off.
Methods
Data collection
BACTOT data collection has been described elsewhere.Reference Fakih, Fortin and Smith24 In brief, beginning on April 1, 2007, Surveillance provinciale des infections nosocomiales (SPIN; the provincial nosocomial infection surveillance program) required participating hospitals to perform active HABSI surveillance in their facility, excluding psychiatric wards, long-term care, and nurseries. On April 1, 2013, participation in BACTOT became mandatory for all hospitals with >1,000 admissions per surveillance year. A surveillance year begins on April 1 of a calendar year, ends on March 31 of the following calendar year, and is composed of thirteen 4-week administrative periods. For every period, the following data are collected for each facility: total patient days, patient days in the ICU, and all relevant information on identified HABSI cases.
Case definitions
The BSI case definition was described elsewhereReference Fakih, Fortin and Smith24 and was based on the National Healthcare Safety Network criteria.Reference Horan, Andrus and Dudeck25 To be considered healthcare-associated, a BSI could not be present or incubating within 48 hours of admission, except if it resulted from a preceding admission or procedure. Primary BSIs constitute BSIs associated with a venous catheter (CA-BSI), both central or peripheral, and non–catheter-associated primary BSIs (NCA-BSI). Secondary BSIs followed by BACTOT are those arising from primary surgical site infections (BSI-SSIs), urinary tract infections (BSI-UTIs), pulmonary infections (BSI-PULMs), intra-abdominal infections (BSI-ABDOs), skin and soft-tissue infections (BSI-SSTs), bone and joint infections (BSI-BONEs), or any other infection of primary focus (BSIOther).
Study design and analysis
We conducted a secondary analysis of BACTOT, a retrospective cohort study using HABSI data collected for BACTOT and obtained directly from SPIN. The cohort was open and included hospitals that had participated for at least 3 consecutive surveillance years in BACTOT by the end of 2016–2017. This restriction allowed us to compare the year of entry rates with those of at least 2 subsequent surveillance years. Yearly participation was defined as contributing to at least 11 of the 13 periods within the surveillance year. Hospitals with no cases (n = 2) were excluded because they would not contribute any information to the fitted models. Access to data was granted by Institut national de santé publique du Québec (National Institute of Public Health) to allow the authors to carry out its monitoring mandate entrusted by the Ministry of Health and Social Services. The McGill University Institutional Review Board approved this study.
Numerators
All HABSIs among admitted patients were considered cases. Cases were pooled by hospital, administrative period, and surveillance year and were stratified by type of infection.
Denominators
Patient days were pooled by hospital, administrative period, and surveillance year. Every day spent at a participating hospital by a patient was counted as 1 patient day.
Days of admission and discharge were each counted as half a day.
Descriptive analyses
Hospitals that met the inclusion criteria were described by the number of years they contributed, their teaching status, whether they had an ICU or not, and number of beds. The frequency distribution of HABSI cases by infection source over the 10-year period was computed. Raw pooled HABSI rates per 10,000 patient days were calculated for each period by dividing the number of HABSI cases by the total number of patient days. The 95% confidence intervals (CIs) for these rates were calculated using the normal approximation method. Percentages may not equal 100 because of rounding.
Statistical analyses
Multilevel Poisson-lognormal mixture models were fitted to the data aggregated by hospital, period, and surveillance year with HABSI, CA-BSI, NCA-BSI, or BSI-UTI cases as the outcome and the natural logarithm of patient days as the offset. The remaining HABSI subtypes were too rare to achieve models with satisfactory fit, as evaluated by fitted values. The log-mean Poisson rate for each observation was decomposed into a surveillance (year) random component, a period random component, and a hospital component following a normal distribution with unknown variance. The prior mean of the hospital component was modeled as a linear function of the number of beds in the facility and hospital type (nonteaching without ICU as the reference, nonteaching with ICU, and teaching), and a random effect relating to the year the hospital entered BACTOT. Independent zero mean normal prior distributions, with relatively large variance (=10) were assigned to the coefficients of the hospital-level variables. Some hospitals participated for <13 periods annually, and 10 observations were missing. Patient days for those observations were imputed using multiple regression, with calendar time and number of admissions as covariates, while the outcome was considered to be missing completely at random. These missing observations were considered parameters of the model and were estimated imputed within the using Markov Chain Monte Carlo (MCMC) procedure.
The surveillance effect was calculated for years 2–10 by exponentiating their surveillance component and dividing it by that of the first year to get incidence rate ratios. Similarly, the period effects were calculated for periods 2 to 13 by exponentiating the period component and dividing it by that of the first period. The incidence rate ratio of different entry years was estimated by dividing the rate independently associated with the year of interest by that associated with the latest year of entry included in the study, 2014–2015. The sample from the posterior distributions of the coefficients of number of beds and hospital type were exponentiated to obtain incidence rate ratios.
The same model was fitted using data from all hospitals and then separately for 37 hospitals with <10 years of participation, for a total of 8 models. The subgroup analysis was performed to exclude hospitals that may have been conducting facility-wide HABSI surveillance prior to BACTOT entry, for those that started in 2007–2008.
Because the analytical form of the posterior distribution of the parameter vector is unknown, we used MCMC methods to obtain samples from the resultant posterior distribution.Reference Gamerman and Lopes26 In particular, the models were fitted using JAGS software within the R package, rjags version 4–6.Reference Depaoli, Clifton and Cobb27, Reference Plummer28 The model burn-ins were 60,000 followed by 150,000 sampling iterations. Convergence of the chains was checked using the Gelman-Rubin diagnostic.Reference Gelman and Rubin29 All analyses were conducted using R version 3.4.1 software with RStudio version 1.0.143 (RStudio Team, Boston, MA).
Results
Cohort description
In total, 77 hospitals were included in the study, representing 87% of the hospitals eligible to participate in BACTOT. Among them, 40 hospitals (51%) participated for the full 10 years, contributing 76% of total cases and 71% of total patient days. Of the included hospitals, 20 (26%) were teaching hospitals, contributing 46% of total patient days. Only 1 teaching hospital did not have an ICU. Among nonteaching hospitals, 34 (60%) had ICUs. The median number of beds per hospital was 153 (IQR, 54-283). Among hospitals with ICUs, the median number of ICU beds was 10 (IQR, 8-16).
Cases and rates
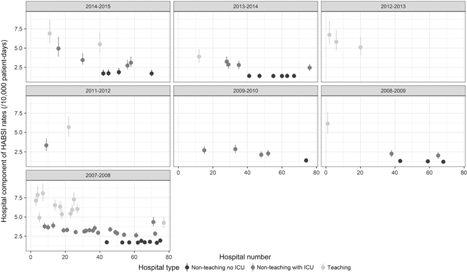
Overall, 17,479 cases and 33,029,870 patient days were recorded for the cohort. The proportions of the HABSI subtypes were determined: CA-BSI (21%), NCA-BSI (20%), BSI-UTI (22%), BSI-PULM (11%), BSI-SSI (12%), BSI-ABDO (8%), BSI-SST (3%), BSI-BONE (1%), and BSI-Other (3%). The raw pooled cohort HABSI rate for the 10-year period was 5.20 per 10,000 patient days (95% CI, 5.12–5.28). No clear trend in the raw pooled annual cohort HABSI rates was observed (Table 1). The large variation in HABSI rates across hospitals was captured by the hospital component, independent of year and period (Fig. 1). For example, the hospital component of 2 teaching hospitals that entered in 2007–2008 accounted for >7.5 per 10,000 patient days of their overall HABSI rate, whereas all nonteaching hospitals without ICUs entering the same year accounted for <2.5 per 10,000 patient days. Teaching hospitals tended to have the highest rates, followed by nonteaching hospitals with ICUs (Table 2). An additional 10 beds in a hospital was associated with slightly higher rates of HABSI and the analyzed subtypes. In most instances, year of entry had no clear influence on these rates (Table 3).

Fig. 1. Summary of the posterior distribution of the contribution of the hospital effects to the healthcare-associated bloodstream infection rate, stratified by calendar year of entry into BACTOT. Solid circles are the posterior mean for a single hospital and solid lines represent the limits of the 95% posterior credible intervals.
Table 1. Healthcare-Associated Bloodstream Infection Cases, Patient Days, and Pooled Incidence Rates for Each BACTOT Surveillance Year

Note. CI, confidence interval.
Table 2. Posterior Summary of the Incidence Rate Ratios of Hospital Characteristics for Healthcare-Associated Bloodstream Infections and the Most Common Subtypes for the Cohort and Hospitals that Participated in BACTOT for <10 Years

Note. HABSI, healthcare-associated bloodstream infection; CS-BSI, catheter-associated bloodstream infection; NCA-BSI, non–catheter-associated bloodstream infection; BSI-UTI, bloodstream infection secondary to urinary tract infection.
a Models fitted to data from the entire cohort.
b Models fitted separately to data from hospitals that have participated in BACTOT for <10 years.
c The effect of 10 beds is estimated by transforming a hospital’s number of beds by dividing by 10.
d Nonteaching hospital with ICU incident. Rate ratio is relative to nonteaching hospitals without ICUs.
Table 3. Posterior Summary of the Incidence Rate Ratios of Year of Entry, Relative to 2014–2015, for Healthcare-Associated Bloodstream Infections and the Most Common Subtypes from Models Fitted for the Cohort and for Hospitals that Participated for <10 Years

Note. HABSI, healthcare-associated bloodstream infection; CS-BSI, catheter-associated bloodstream infection; NCA-BSI, non–catheter-associated bloodstream infection; BSI-UTI, bloodstream infection secondary to urinary tract infection.
a Models fitted to data from the entire cohort.
b Models fitted separately to data from hospitals that have participated in BACTOT for <10 years.
Surveillance effect
HABSI incidence rates across surveillance years did not change substantially (Supplementary Figure 1 online). For HABSI, CA-BSI, and BSI-UTI, there was no difference between the estimated posterior rates of years 2 to 10 compared to year 1 (Table 4). This remained the case when only hospitals that participated in BACTOT for <10 years were analyzed separately. As for NCA-BSI, the posterior means of the rate ratios increased from the seventh year of surveillance until the tenth, when the rate was 29% (95% CI, 1%–89%) higher than the first year rate. However, in the subgroup analysis, both the posterior means and the credible intervals remained relatively constant. The variance of the posterior mean rates for all the models was consistently very low, highlighting that the year-to-year changes in rates were largely similar across hospitals.
Table 4. Posterior Summary of the Incidence Rate Ratios of Surveillance Years, Relative to the First Year, for Healthcare-Associated Bloodstream Infections and the Most Common Subtypes for the Cohort and for Hospitals that Participated in BACTOT for <10 Years

Note. HABSI, healthcare-associated bloodstream infection; CS-BSI, catheter-associated bloodstream infection; NCA-BSI, non–catheter-associated bloodstream infection; BSI-UTI, bloodstream infection secondary to urinary tract infection.
a Models fitted to data from the entire cohort.
b Models fitted separately to data from hospitals that have participated in BACTOT for <10 years.
Period effect
We detected little difference in estimated posterior rates across periods within a surveillance year (Supplementary Figure 2 online). The fifth and sixth periods, which overlap with the months of August and September, were associated with higher HABSI rates than the first periods in April; these were 8% (95% CI, 1%–16%) and 7% (95% CI, 0–14%) higher, respectively. CA-BSI rates also tended to be 15% (95% CI, 1%–33%) higher in the sixth periods compared to the first periods. No difference in NCABSI or BSI-UTI rates across periods was detected.
Discussion
Our study provides novel information regarding HABSI rates over years of surveillance, taking into account period and hospital effects. Contrary to our hypothesis, and despite the dedicated long-term surveillance, we detected no sustained change in rates of HABSI or of its most common subtypes. This remained the case when the 40 hospitals that entered the program at its inception were removed from the analyses. Cohort NCA-BSI rates increased in the seventh year to reach rates only slightly higher than the starting rates in the tenth year of surveillance. The increase was absent in the subgroup analysis. Although its absence may have been due to reduced power, it may also suggest that the starting 40 hospitals differed from the rest of the cohort in their response to surveillance or that changes independent of surveillance have been occurring. An increase in NCA-BSI rates in these 40 hospitals between years 2014 and 2017 was also highlighted when calendar time trends were investigated elsewhere.Reference Fakih, Fortin and Smith24 HABSI rates were higher in the August and September periods compared to April rates. The literature indicates that BSIs caused by gram-negative bacteria, especially Escherichia coli, tend to increase in the summer months.Reference Al-Hasan, Lahr, Eckel-Passow and Baddour30, Reference Chazan, Colodner, Edelstein and Raz31 Although the reasons for such seasonality remain unclear,Reference Freeman, Anderson and Sexton32 our results suggest that the change in September may be driven in part by CA-BSI, as it also increases.
The influence of calendar time, and, in turn, time-dependent confounders, is difficult to eliminate completely when investigating trends over surveillance time. This is especially true when a large number of hospitals share the same entry year, particularly during the years when only these hospitals remain in the cohort. Adjusting for this by directly including a calendar time variable in the model would create problems due its collinearity with surveillance time. The alternative we opted for in this study was to adjust for the calendar year of entry as a time-invariant effect captured as a random intercept for the hospital effect. To our knowledge, this method has not been used before in the published surveillance literature. Including calendar year of entry in the model reduces the deviance information criterion (DIC), a hierarchical modeling generalization of the Akaike information criterion (AIC), indicating that it captures enough variation in the data to consider it parsimonious to keep it in the model.Reference Spiegelhalter, Best, Carlin and van der Linde33
The large case number and patient days covered by our study was made possible by using a cohort of hospitals with different lengths of BACTOT participation. Without this novel method, a choice between investigation of long-term trends post surveillance and representativeness of post-surveillance trends would have to have been made. Limiting the cohort to hospitals with longer participation periods would exclude hospitals that may have not begun participation for reasons related to their surveillance capabilities or HAI incidence. Results from such a cohort would not be considered representative of hospitals eligible to participate in BACTOT. If a representative cohort was instead chosen, analyses would be limited to the first 3 years of surveillance time, preventing a long-term understanding of HABSI post surveillance. The flexibility of Bayesian model writing allowed the fitting of a multilevel model to the available data for each hospital while borrowing strength across hospitals.
Notably, any changes or lack thereof reported here cannot be attributed solely to surveillance. Unavailable HABSI data from hospitals prior to surveillance means an absence of a counterfactual that would allow us to estimate a causal effect. In our study, we used the data from the first year of surveillance as a baseline to which we compared following years. Although the first year of surveillance is not necessarily representative of pre-surveillance rates, we believe that full effects of surveillance require time. After 1 year of participation in BACTOT, hospitals receive an annual report with their rates, compared to the rest of the province, stratified by hospital status.16 First-time reception of this report by a hospital could drive local initiatives to improve HABSI rates for 2 reasons. First, it can be a revelation to key stakeholders and decision makers about the breadth of preventable HABSIs in their hospital, particularly in settings with previously limited surveillance programs or poor infection rates communication plans. Second, it can provide to these same actors a competitive interfacility benchmark for improvement by comparing their hospital’s rates with those of others. The subgroup analysis performed also excludes hospitals that had participated for the entire 10-year period to further isolate surveillance effects and focus on hospitals more likely to be beginning their local surveillance of HABSIs. Hence, we believe our results are a valuable evaluation of HABSI behavior after participation in BACTOT surveillance.
Among the previously cited HABSI surveillance programs, some have published reports on longitudinal trends in HABSI. The Belgian program reported a increases between 1992 and 1996 after initiating surveillance; however, a greater increase in blood culturing was concomitant with the surveillance program, along with an absence of prevention efforts.Reference Ronveaux, Jans, Suetens and Carsauw18 The Australian program in South Australia, which had been running since 1997, reported a reduction between 2010 and 2016.Reference Cope and Wilkinson22 There was a decreasing trend in average length of stay during the same period of time, but, to our knowledge, no targeted statewide efforts were made to reduce HABSI.34 Both analyses evaluate changes over calendar time, and neither adjust for the changes in hospital participation; therefore, it is challenging to disentangle secular changes from those induced by surveillance.
Although it is concerning that HABSI rates have showed no reduction with continued BACTOT surveillance, they do remain stable and low. For this reason, the usefulness of BACTOT in burden suppression cannot be dismissed. Nonetheless, it is unlikely that Quebec hospitals have reached the limit of HABSI preventability, as other SPIN surveillance initiatives, such as SPIN-BACC (CLABSI in the ICUs) and SPIN-HD (BSI associated with venous access for dialysis), have been successful at reducing rates.Reference Li, Fortin, Tremblay, Ngenda-Muadi and Quach35, 36 Both infection types were subject to bundle interventions and their programs use more specific denominators (catheter-associated days), which allow the detection of smaller changes in incidence than BACTOT.
To follow suit, SPIN-BACTOT must consider implementing active interventions against HABSI, both universal, such as the enforcement of hand hygiene protocols, and targeted to infection types. The latter will benefit from collecting data on more specific denominators for their greater discriminatory power and to adjust for changes in exposure risk. Along with incidence rates, process measures can be calculated to ensure intervention implementation. Burden reduction can also be examined with severity measures, such as case-fatality or specific clinical indicators, which will give a richer understanding of HABSI epidemiology as well as more discriminatory measures for evaluation.
Supplementary material
To view supplementary material for this article, please visit https://doi.org/10.1017/ice.2018.357.
Author ORCIDs
Alexandra M. Schmidt 0000-0002-6448-6367
Acknowledgments
We are grateful to all the infection control practitioners and infectious disease physicians/medical microbiologists who participate in the SPIN program. The SPIN-BACTOT working group members include Élise Fortin, Charles Frenette, Lise-Andrée Galarneau, Sylvie Latreille, Danielle Moisan, Muleka Ngenda-Muadi, Noémie Savard, Marc-André Smith, Claude Tremblay, Mélissa Trudeau, and Jasmin Villeneuve.
Financial support
This work was supported by SPIN, a program from the Quebec Institute of Public Health, funded by the Quebec Ministère de la Santé et des services sociaux (Ministry of Health). Dr. Quach is supported through an external salary award (FRQ-S merit, grant no. 252775).
Conflicts of interest
All authors report no conflicts of interest relevant to this article.