World leaders gathered at the United Nations General Assembly and called for country-level strategies and implementations plans to reduce antimicrobial resistance (AMR) worldwide.1 Many countries, including Australia have a national AMR strategy and implementation plan already in place,2 but the evidence showing the health and economic burden of these infections on the population is limited.Reference Wozniak, Paterson and Halton3
The current evidence of the cost of AMR infections to human health is highly variable.Reference Gandra, Barter and Laxminarayan4 Healthcare costs can be quantified several ways with a range of economic perspectives used. One method is to measure the prolongation of length of hospital stay (LoS) and extra mortality risk associated with AMR infections.Reference Graves, Harbarth, Beyersmann, Barnett, Halton and Cooper5, Reference De Angelis, Murthy, Beyersmann and Harbarth6 Many studies have reported the costs of AMR infections in the past decade,Reference Smith and Coast7 and these have produced highly variable estimates ranging from US$10.7–15 million across all AMR organismsReference Roberts, Hota and Ahmad8 to £3–11 billion for MRSA onlyReference Smith, Yago, Millar and Coast9 or a global economic output of US$100 trillion by 2050.Reference O’Neill10 The methods used to generate these estimates vary and should be carefully considered prior to new policy being implemented to reduce the problem.Reference de Kraker, Stewardson and Harbarth11
We aimed to provide Australian estimates of the cost of five clinically important hospital-associated infections using local data and transparent methods. Estimating the economic burden is useful to prioritize infection control programs and health policies and to support Australian and global AMR efforts.
Methods
Ethics
The Health and Economic Modelling of Antimicrobial Resistance in Australia (HEMAA) project meets the conditions within section 5.1.22 of the Australian National Statement on Ethical Conduct in Human Research (2007) for exemption from Human Research Ethics Committee review and approval, and an exemption was granted accordingly by the Queensland University of Technology (QUT) University Human Research Ethics Committee. Written approval was provided for the release of data from Queensland Department of Health, Pathology Queensland, pertaining to the organism, site of infection and antibiotic susceptibility testing.
Building the economic model
The economic model was developed with input parameters for each combination of bacteria and resistance profiles (Fig. 1 and Tables 1–5). We estimated the number of resistant and susceptible infections from Queensland Department of Health, Pathology Queensland database for the year 2014. A synthesis of published literature informed the estimates of excess LoS, value of a bed day, antibiotic treatment, and excess risk of death. The cost of a single infection was a product of excess cost for antibiotic treatment plus excess length of hospital stay. The cost of a hospital bed day was the product of multiplying excess days in hospital for each of the five organisms by the value of a hospital bed. The methods used for all of these estimations are reported in subsequent sections of this article. The total cost of AMR for this study was a measure of number of resistant infection, excess treatment costs, and additional hospital stay. Excess deaths, as a measure of the number of resistant infections multiplied by the risk of death from AMR, were not included in the total cost of AMR.
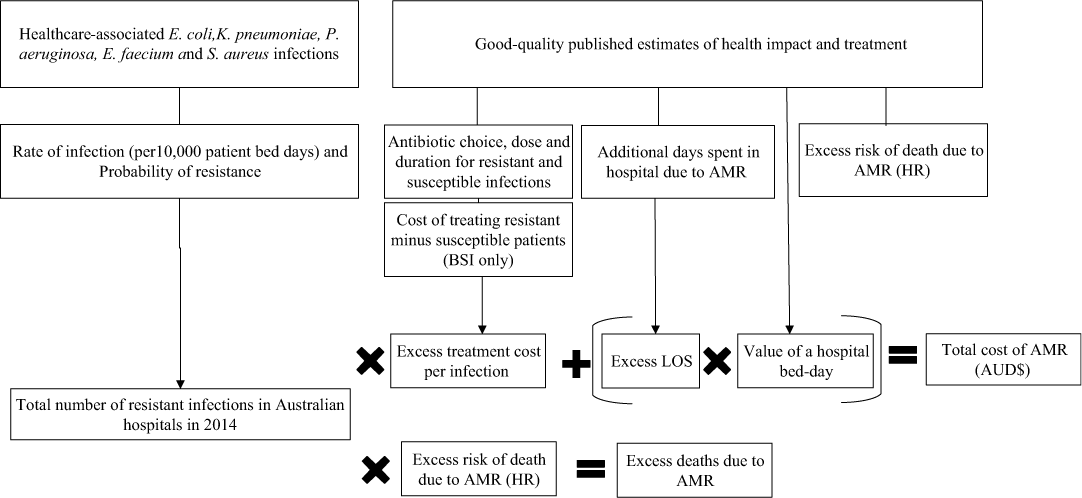
Fig. 1. A schematic representing the parameters of the economic model used for the study.
Table 1. Parameter Estimates and Distributions for E.coli Infections Used in the Economic Model
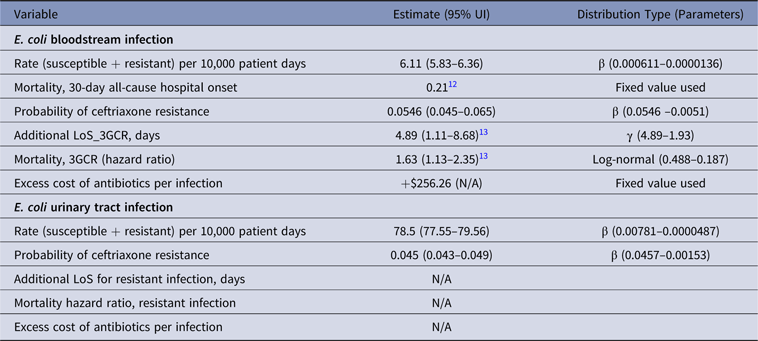
Note. UI, uncertainty interval; LoS, length of stay; 3GCR, third-generation cephalosporin resistant; N/A, not available.
Table 2. Parameter Estimates and Distributions for K. pneumoniae Infections Used in the Economic Model
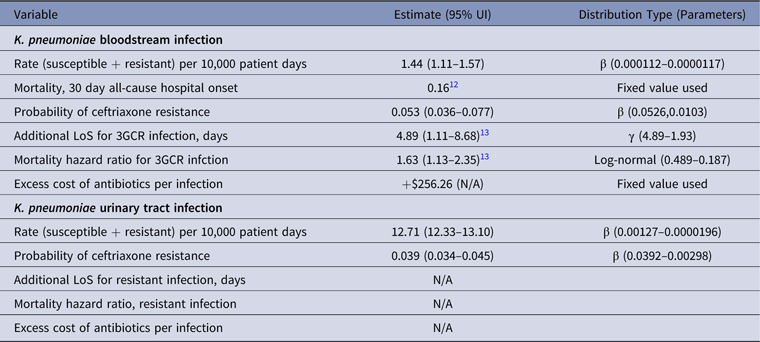
Note. UI, uncertainty interval; LoS, length of stay; 3GCR, third-generation cephalosporin resistant; N/A, not available.
Table 3. Parameter Estimates and Distributions for P. aeruginosa Infections Used in the Economic Model

Note. UI, uncertainty interval; LoS, length of stay; N/A, not available.
Table 4. Parameter Estimates and Distributions for E. faecium Infections Used in the Economic Model

Note. UI, uncertainty interval; LoS, length of stay; VRE, vancomycin-resistant E. faecium.
Table 5. Parameter Estimates and Distributions for S. aureus Infections Used in the Economic Model
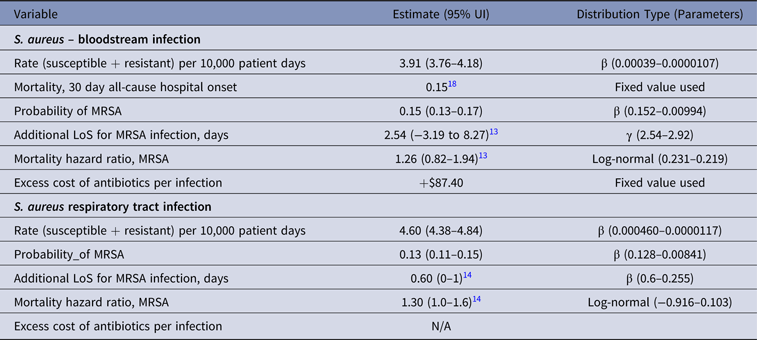
Note. UI, uncertainty interval; LoS, length of stay; MRSA, methicillin-resistant S. aureus; N/A, not available.
Uncertainties in the model parameters were included by fitting prior statistical distributions and making 10,000 random picks from all distributions. The method of momentsReference Bowman and Shenton19 was used to estimate the model parameters for γ and β distribution (Tables 1–5). A γ distribution was fitted to LoS data to reflect the skew typical of this type of information, and a β distribution to describe uncertainty about the true value of a rate and resistance probability. A log-normal distribution was used for mortality measures (Tables 1–5). The results of the simulations show the uncertainty in estimates.
The model was developed with the advice from an advisory committee made up of experts from the hospital, medical community, and health department. All members had expertise in infectious diseases, epidemiology, and infection control. Selection of organisms was based on the availability and completeness of published evidence as well the advice from the advisory committee. The final selection of organism included healthcare-associated (community- and hospital-onset) infections of the blood, urinary tract, and respiratory tract caused by any one of the five selected organisms: ceftriaxone-resistant E. coli (including extended-spectrum β-lactamases (ESBL); ceftriaxone-resistant K. pneumoniae (including ESBL); ceftazidime-resistant P. aeruginosa; vancomycin-resistant E. faecium; and methicillin-resistant S. aureus (MRSA). Organisms such as Acinetobacter baumanii, Mycobacterium tuberculosis, Neisseria meningitis, N. gonorrhoea, Haemophilus influenza, and human immunodeficiency virus were excluded following detailed review, primarily due to currently low incidence rates in Australia and/or a limited availability of information. Community-onset infections could not be adequately identified or appropriately dichotomized from infections that presented within a healthcare setting and were therefore analyzed together with the hospital-acquired infections.
Total number of resistant and susceptible infections in Australian hospitals in 2014
Data on incidence density and antibiotic resistance probability was obtained from Queensland Department of Health, Pathology Queensland database. This database provides antimicrobial susceptibilities for all 170 Queensland public hospitals networked by 35 laboratories that collect specimens from district laboratories in rural, large, regional as well as metropolitan teaching hospitals. The data included the first clinical isolate from a patient infected with any one of the included organisms. An estimated 160,000 infections are recorded each year in this database, excluding infection control screens with contributing sites from blood, urine, respiratory and other sites (swabs, operational specimens, tissue, fluid, and pus). A total of 63,349 clinical isolates of the five selected organisms were available for analysis. Isolates from colonization and/or screening were not included in the analysis. All isolates included were tested using European Committee on Anti microbial Susceptibility Testing methods and were standardized across all laboratories from which the data was extracted. The case definitions were adapted from those of the Centers for Disease Control and Prevention.Reference Horan, Andrus and Dudeck20
In the absence of a national AMR surveillance system at the time of the data request, we used the Queensland Department of Health, Pathology Queensland database to determine the incidence of infections and proportion that were resistant. The probabilities of resistance for each of the five organisms in 2014 are presented in Tables 1–5. The total number of infections was divided by the number of patient bed days in Queensland in 2014 (N = 3,308,998 bed days). The estimate was then extrapolated to the Australian population, using the Australian hospital statistics estimate of the number of days of patient care in all hospitals across Australia (N = 18,934,000).21
Synthesis of published studies
Any study published between January 1990 and June 2017 reporting primary evidence of the health impact of resistant compared to susceptible patients was considered. No language or publication status restrictions were imposed. Studies comparing resistant or susceptible to uninfected groups were included in the original search to ensure that all possible estimates were identified; however, only studies that directly compared resistant to susceptible patients were included in the final economic model. Primary outcomes measures were excess LoS, excess mortality, and treatment. Organisms of interest were Enterococcus spp, Escherichia coli, K. pneumoniae, P. aeruginosa, and S. aureus. All study designs were considered, but priority was given to systematic reviews, randomized controlled trials, cohort studies, and case-control studies.
Studies were identified by searching electronic databases, scanning reference lists of articles, and consulting with the advisory committee. This search was applied to PubMed, Embase, Cinahl, Cochrane, and DARE (Database of Abstracts of Reviews of Effectiveness). The last search was run in June 2017. In addition, we manually searched the contents pages of the UK Review on Antimicrobial Resistance; Centres for Disease Control; the Australian Group of Antimicrobial Resistance (AGAR); Enterococcus Surveillance Program; the Australian Staphylococcus aureus Sepsis Outcome Programme; the Enterobacteriaceae Sepsis Outcome Programme and the Australian Commission of Safety and Quality in Healthcare AURA (the Australian report on antimicrobial use and resistance in human health).
We developed a data extraction sheet, and one author (T.W.) extracted information from each included study. Inclusion of each study and extraction of estimates used in the economic model were critiqued by two authors and, where possible, members of the advisory committee. All included studies were ranked based on the criteria adapted from a published quality-assessment method.Reference Gandra, Barter and Laxminarayan4 We prioritized studies that had used a rigorous methodology. The highest-quality studies were those that had appropriately adjusted for time-dependent bias by using multistate modeling.Reference Barnett, Beyersmann, Allignol, Rosenthal, Graves and Wolkewitz22 Studies that controlled for LoS using other methodologies, such as case-matching or regression analysis or by sensitivity analysis of LoS prior to infection, were categorized as medium quality and were considered the next-best scenario. Studies that did not control or describe adjustment for prior LoS within their methodology were excluded even if they had adjusted for severity of illness and/or prior antibiotic therapy (ie, low quality). If >1 estimate was available and was of equal quality, then the study reporting the most recent data and that with the closest representation to the Australian population and healthcare system was considered.
Data acquisition and calculation
We used an Australian survey of the clinical management of patients with a BSI caused by a resistant organism.Reference Wozniak23 From this publication, we extracted the antibiotic treatment (type of antibiotic, dose, and duration) and compared it against the treatment regimen for patients infected with a susceptible organism as described in the Australian Therapeutic guidelines (eTG)24 (Table 7 and Fig. 1). We calculated the difference in costs of antibiotics used to treat a single hypothetical patient with a resistant infection compared to a patient with a susceptible infection (cost of resistant infection minus the cost of a susceptible infection). Costs of antibiotics were obtained from the Queensland Department of Health lead pharmacist at a major metropolitan hospital using the 2017 pricing agreement for all Queensland hospital pharmacies.
Excess LoS and mortality data were obtained from published estimates identified in the literature review and are shown in Tables 1–5 for each of the 5 organisms. Accounting costs of a hospital bed used in our model was $1,839 per hospital bed day obtained from the Australian Independent Hospital Pricing Authority.25 The total annual cost of AMR was a product of the cost of excess treatment and excess hospital stay multiplied by the expected number of resistant infections in 2014.
Results
Health burden
The most frequently occurring infections in our analysis were hospital-associated UTIs caused by E. coli (7.85 episodes per 1,000 patient days); these demonstrated a 10-fold higher rate than E. coli BSI (0.61 episodes per 1,000 patient days) (Table 6). Similar trends were evident for K. pneumoniae UTIs (1.3 UTI episodes per 1,000 patient days) compared with K. pneumoniae BSIs (0.14 BSI episodes per 1,000 patient days). Respiratory tract infections (RTIs) caused by ceftazidime-resistant P. aeruginosa (0.12 episodes per 1,000 patient days; 95% uncertainty interval [UI], 0.11–0.13) also demonstrated rates that were 10-fold higher than P. aeruginosa BSIs.
Table 6. Incidence Density and Resistance Rate of AMR Infections in Australia, 2014

Note. UI, uncertainty interval; BSI, bloodstream infection; UTI, urinary tract infection; RTI, respiratory tract infections; KP, K. pneumoniae; PA, P. aeruginosa; Entero, E. faecium; SA, S. aureus.
Across the 5 organisms included in our model, the proportion of resistant isolates was highest in E. faecium, with 34.3% of BSIs and 42.6% UTIs testing positive for vancomycin resistance. However, incidence was amongst the lowest at 0.01 BSI episodes per 1,000 patient days and 0.05 UTIs per 1,000 patient days.
Cost of antibiotics used to treat VRE was the highest across all infections analyzed (Table 7). Linezolid prescribed intravenously 600 mg twice daily to treat VRE BSIReference Wozniak23 resulted in an additional AUD$1,622 per infection and was ~20-fold more expensive than antibiotic treatment of MRSA (Table 7).
Table 7. Clinical Management and Cost of Resistant and Susceptible BSIs, 2017

Note. KP, K. pneumoniae; PA, P. aeruginosa; Entero, E. faecium; SA, S. aureus.
a Costs of antibiotics were obtained from Queensland Department of Health, 2017 pricing agreement for hospital pharmacies.
b Cost of antibiotics used for resistant infection minus cost of antibiotics used for susceptible infections.
Attributable LoS and mortality
Estimates of additional hospital stay and mortality are presented in Tables 1–5. We identified high-quality studies that adjusted for time-dependent bias and reported measures of additional LoS and mortality for BSI patients for all selected organisms and excess LoS as reported for S. aureus and P. aeruginosa causing respiratory infections. High-quality studies that used a multistate modeling method to adjust for time-dependent bias reported excess morbidity and mortality of MRSA, E. coli, and K. pneumoniae BSIs.Reference Stewardson, Allignol and Beyersmann13 Cheah et al. (2013)Reference Cheah, Spelman and Liew16 and Lambert et al. (2011)Reference Lambert, Suetens and Savey14 did not use multistate modeling methodology, but both groups controlled for time of infection at the analysis phase (medium-quality study). We did not identify any high-quality estimates for patients with UTIs for any of the included organisms. Except for a study from two Australian hospitals reporting additional LoS attributed to VRE infection,Reference Cheah, Spelman and Liew16 all other estimates of LoS and mortality were based on international data.Reference Stewardson, Allignol and Beyersmann13, Reference Lambert, Suetens and Savey14, Reference Salgado and Farr17 All included studies were based on the general hospital ward population, with the exception of that by Lambert et al. (2011), which quantified attributable morbidity and mortality in patients infected with P. aeruginosa or respiratory MRSA from an intensive care unit.Reference Lambert, Suetens and Savey14
Patients with BSIs caused by ceftriaxone-resistant E. coli stayed in the hospital an average of 4.89 days (95% UI, 1.1–8.7) longer than patients with susceptible E. coli infections (Table 1).Reference Stewardson, Allignol and Beyersmann13 This additional LoS amounted to a total excess of 3,088 days (95% UI, 1,159–5,988) in 2014 (Fig. 2). The average MRSA patient stayed in the hospital 2.54 days (95% UI, −3.2 to 8.3) longer than methicillin-susceptible S. aureus (MSSA) patients (Table 5),Reference Stewardson, Allignol and Beyersmann13 and we estimate that this resulted in an additional 2,899 hospital days per year (Fig. 2). However, we noted large variation around this point estimate. In our model, the greatest number of AMR-attributable deaths were among patients with an RTI caused by MRSA (155 deaths; 95% UI, 40–412) and P. aeruginosa (88 deaths; 95% UI, 9–196) (Fig. 3).
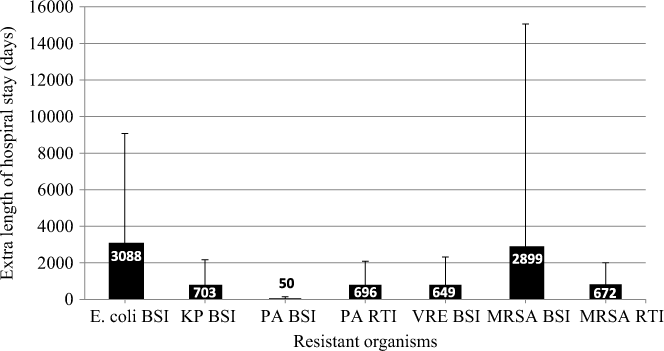
Fig. 2. Additional length of hospital stay (days) due to AMR infections in Australia, 2014. Note. AMR, antimicrobial resistant; BSI, bloodstream infection; RTI, respiratory tract infection; KP, K. pneumoniae; PA, P. aeruginosa; VRE, vancomycin-resistant E. faecium; MRSA, methicillin-resistant S. aureus.

Fig. 3. Additional deaths due to AMR infections in Australia, 2014. Note. AMR, antimicrobial resistant; BSI, bloodstream infection; RTI, respiratory tract infection; KP, K. pneumoniae; PA, P. aeruginosa; VRE, vancomycin-resistant E. faecium; MRSA, methicillin-resistant S. aureus.
Economic burden
The cost of AMR in Australian hospitals is presented as the combined effect of incidence of infection, resistance rate, in-hospital antibiotic therapy, and additional LoS (Table 8). For total costs per infection (cost of treatment combined with extra hospital stay), VRE bacteremia was the most expensive infection and added an estimated AUD$10,682 per infection (95% UI, $3,500–$23,223) compared to a susceptible infection. We estimate that BSIs caused by K. pneumoniae and E. coli cost an additional AUD$9,248 (95% UI, $3,597–$17,470) and AUD$9,200 (95% UI, $3,716–$17,381) per infection, respectively (Table 8). By combining the cost per infection with incidence density, the largest contributor was from ceftriaxone-resistant E. coli BSIs, which added an excess of AUD$5.8–11.2 million per year. These costs were similar to those for patients infected with MRSA BSIs, where the Australian healthcare system spent an additional AUD$5.5 million (95% UI, $339,633–$22.7 million per year) compared with MSSA patients.
Table 8. Estimated Economic Burden of AMR Infections, Australia 2014

Note. UI, uncertainty interval; BSI, bloodstream infection; RTI, respiratory tract infection; KP, K. pneumoniae; PA, P. aeruginosa; VRE, vancomycin-resistant E. faecium; MRSA, methicillin-resistant S. aureus; N/A. not available.
a Calculated as the total costs divided by the number of resistant infections. The number of resistant infections can be found in Table 6.
Discussion
Australian hospitals are spending an additional AUD$5.8 million treating patients infected with 1 bacteria that is resistant to 1 antibiotic (ie, ceftriaxone-resistant E. coli BSI), and this estimate could be as high as AUD$11.2 million per year. Without good-quality measurable indicators of the additional LoS and risk of death of patients, we cannot provide a more complete cost estimate and include other antimicrobial classes or sites of infection. In particular, the lack of rigorous estimates of the additional burden of UTIs caused by E. coli, which are highly prevalent (7.85 per 1,000 patient days (95% UI, 7.7–7.9), precludes a more accurate estimate of the economic burden of resistant infections.
To date, we have identified only ‘one’ estimate of the cost of AMR in Australia. Using international data and assuming comparable AMR rates and healthcare costs between the United States and Australia, the Expert Advisory Group on Antimicrobial Resistance have report an additional AUD$250 million per year.26 Hence, within the context of such estimates, our measure of additional combined estimate AUD$16.8 million per year (for the five organisms analyzed) may be a conservative underestimate. This underestimation may be attributable to a several key factors discussed below.
First, our economic model includes hospital patients with bacteremia only, with the exception of respiratory P. aeruginosa and MRSA infection where high-quality estimates of AMR-attributable morbidity were reported. However, excluding highly prevalent infections (eg, UTIsReference Mitchell, Ferguson, Anderson, Sear and Barnett27) based on lack of evidence would inevitably impact the overall costs of infection. Second, our estimates only include direct costs of infection and do not consider personal costs, the cost of premature death, nor any estimate of productivity loss.Reference Smith, Yago, Millar and Coast9, Reference O’Neill10 Last, we focused on five clinically important infections that constitute the majority of but not all, hospital-associated infections.
We applied Monte Carlo simulation to propagate forward, to the results, the effect of uncertainties in the model parameters. For each sample, a different set of random values from the probability functions were selected. The advantage of using a Monte Carlo simulation method over a single-point estimate is that the results show not only what could happen but also how likely each outcome is at providing a result.Reference Briggs, Sculpher and Buxton28
A number of limitations should be considered when interpreting the results of this study. First, we assumed that every infection had a specimen collected that grew the organism, and that each one of these had sensitivity testing performed. Second, we used Queensland-specific data and extrapolated these to the Australian population. With an area of 1,727,000 square kilometers, Queensland is the second largest state in Australia. As a comparator to national rates of hospital-acquired infection, the Queensland rate of S. aureus cases (MRSA and MSSA) in 2014 was equivalent to the national rate of 0.07 cases per 1,000 days of patient care.29 At the time of requesting data for this study, Australia did not have a routine surveillance system for AMR; hence, we assessed Queensland-specific data that uses a single reliable testing methodology and covered all public hospitals in an entire state, was the best data source. Third, treatment data were only available for BSIs and do not include other sites of infection or costs associated with staff time, equipment or any additional aspects of treating a patient in hospital. However, auxiliary costs are often considered when estimating the average cost of a bed day and thus may in part be reflected in the overall cost estimate. We did not consider the loss of productivity or the societal perspective. Lastly, the underlying model assumes that resistant infections replace susceptible infections; however, others suggest that resistance has an additive effect as well.Reference de Kraker, Jarlier, Monen, Heuer, van de Sande and Grundmann30 If this is the case, our estimates of cost on the healthcare system are likely to be larger than reported.
We have provided an evidence-based, locally informed estimate of the cost of AMR in Australian hospitals, which has also been developed into an online open-access tool.Reference Wozniak, Graves and Barnett31 Together these estimates and tool aims impact the clinical management of patients with resistant infection, to inform current AMR strategy and implementation plans,2 and to raise awareness of the significant knowledge gaps and the need for future investments in this important issue.
Author ORCIDs
Teresa Maria Wozniak, 0000-0003-3182-8348
Acknowledgments
Authorship and manuscript preparation. TW and NG conceptualised the economic model. TW wrote the first draft. TW, EB and NG reviewed the manuscript and provided feedback.
Financial support
The work was supported by the National Health and Medical Research Council-funded Centre for Research Excellence in Reducing Healthcare Associated Infections (grant no. GNT1030103). TW was supported by a Fellowship from the NHMRC-funded ‘Improving Health Outcomes in the Tropical North: A multidisciplinary collaboration (Hot North)’, grant identification number 1131932.
Conflicts of interest
All authors report no conflicts of interest relevant to this article.


