


Pay for performance was introduced in the United States to incentivize hospital investment in quality initiatives that improve patient outcomes. Under Medicare, hospital payment for performance is determined through scores incorporating rates of preventable conditions including healthcare-associated infections (HAIs). 1 Hospitals in the bottom quartile can see a 1% revenue reduction from Medicare.Reference Evans 2 Other hospital reimbursement policies, however, can offset these penalties and limit financial incentives to invest in quality improvement strategies, even those associated with lower system-wide costs.
Cost burdens of quality improvements generally fall entirely on healthcare providers, but cost burdens of lower-quality care may be shared between providers and payers, including patients. Financial penalties are intended to better align incentives by encouraging hospitals to consider costs of poor quality in investment decisions. However, if payers compensate providers for additional treatment costs resulting from quality deficiencies, providers face diminished incentives to invest in quality. 3
Reducing costly and deadly HAIs is a priority of the Department of Health and Human Services. 4 – Reference Neidell, Cohen and Furuya 6 Infection prevention processes are well established, yet adoption by hospitals has been slow. One explanation may be that hospitals face few incremental costs of HAIs, instead passing these to payers. Literature documenting such perverse incentives is sparse and situation specific, with mixed results and small samples. Early research suggested that hospitals faced most incremental costs of infections, particularly under prospective diagnosis-related group (DRG) payment,Reference Wenzel 7 , Reference Haley, White, Culver and Hughes 8 a result supported by a more recent case study.Reference Shannon, Patel, Cummins, Shannon, Ganguli and Lu 9 However, a second case study found that a hospital profited from patients who acquired bloodstream infections (BSIs).Reference Hsu, Lin and Evans 10
Under DRG systems, hospitals can classify patients with complications into DRGs with higher reimbursement. Under per-diem systems, hospitals can charge payers for extra days associated with complications. In many systems, including Medicare, extremely costly cases qualify for additional outlier payments (payments that cover 80% of hospital costs to treat seriously ill patients above a fixed-loss threshold) or stop-loss payments.Reference Cleverley, Cleverley and Song 11 Under these arrangements, some costs of complications may be offset, and in extreme cases, hospitals may even profit, which reduces their incentive to avoid complications.
In 2008, Medicare sought to address this situation by limiting a hospital’s ability to assign higher DRGs for certain hospital-acquired conditions, including some HAIs. 12 , Reference Peasah, McKay, Harman, Al-Amin and Cook 13 Empirical research suggests that this strategy has had limited effect on quality improvement,Reference Krein, Kowalski, Hofer and Saint 14 , Reference Lee, Kleinman and Soumerai 15 in part because the impact on payments has been limited.Reference McNair, Luft and Bindman 16 Payments changed little because patients who acquired infections were already likely to qualify for higher DRGs and because outlier payments muted the effects. In California, >25% of catheter-associated infections qualified for outlier payments.Reference McNair, Luft and Bindman 16
United States hospitals use a variety of payment methodologies and levels. For example, private insurers in Los Angeles often pay per diem, while those in Indianapolis rarely do.Reference Ginsburg 17 Rates also vary considerably, with DRG reimbursements at 210% of Medicare rates in some areas.Reference Ginsburg 17 Medicaid hospital payments have been estimated at 70–85% of Medicare rates,Reference Levit, Friedman and Wong 18 but payment methodologies vary. 19 The magnitude of financial incentives for hospital quality improvement depends on payment methodology. In this analysis, we used cost data associated with BSIs and urinary tract infections (UTIs) from a large hospital system to simulate the incentives for quality improvement generated by alternative payer and payment configurations.
METHODS
Data
Following study approval by the Columbia University Institutional Review Board, data from 2013 to 2014 were extracted from electronic databases of a community hospital and 2 tertiary- and/or quaternary-care hospitals in a large urban system caring for a diverse population. The data used to determine propensity for infection, to identify presence of UTI and BSI, and to derive costs, payments, and length of stay (LOS) were compiled from (1) microbiologic results from blood and urine cultures; (2) patient hospital unit and presence of roommates; (3) medications administered, procedures performed, and device utilization; (4) financial information including payer and total and itemized charges by date; and (5) International Classification of Diseases, Ninth edition, Clinical Modification diagnosis and procedure codes. Data were linked using medical record number and date and time stamps.Reference Neidell, Cohen and Furuya 6 , Reference Apte, Neidell, Furuya, Caplan, Glied and Larson 20
We identified BSI and UTI cases occurring after the patient’s second day in the hospital using previously validated electronic algorithms derived from the Centers for Disease Control and Prevention National Healthcare Safety Network surveillance definitions (https://www.cdc.gov/nhsn/pdfs/pscmanual/2psc_identifyinghais_nhsncurrent.pdf), as described in a previous publication.Reference Glied, Cohen, Liu, Neidell and Larson 21 Recognizing the limitations of electronic data, we categorized patients as infected, uninfected, or “uncertain,” with the latter excluded to reduce misclassification bias.Reference Glied, Cohen, Liu, Neidell and Larson 21 The BSI cases had at least 1 positive blood culture without the presence of a positive culture with the same organism in another body site in the previous 14 days. Controls had no positive blood cultures or <2 cultures with common skin contaminants. Patients who had (1) ICD-9 codes for sepsis but no positive blood cultures or (2) a positive blood culture and a positive culture from another body site in the previous 14 days with the same organism were considered “uncertain” and were excluded. The UTI cases had positive urine cultures, and controls were those with no positive urine culture and no ICD-9 code for UTI. Patients who had an ICD-9 code for UTI but no positive urine cultures were considered “uncertain” and were excluded.
Statistical Analysis
Propensity score matching
We used propensity score matching to estimate excess hospital costs, payments, and LOS attributable to BSI and UTI (relative to individuals with similar infection risk but no infection). We estimated discrete time survival modelsReference Allison 22 for developing HAIs, controlling for a broad array of time-variant and -invariant conditions (see Appendix Table 1), allowing for a nonparametric hazard. Calculations included variables used in prior studies of infection risk and were available in our electronic medical record.Reference Neidell, Cohen and Furuya 6 , Reference Glied, Cohen, Liu, Neidell and Larson 21 Each patient contributed 1 observation per day in the hospital from day 3 until either the last day in the hospital, the day an infection occurred, or day 40 (because 99% of HAIs occurred prior to day 40). This model was used to generate 1 propensity score (ie, the predicted probability of acquiring an infection on a given day). We then performed exact matching on the day in the hospital, primary payer matching (ie, Medicare, Medicaid, or private, excluding self-pay patients), and nearest-neighbor matching based on propensity score. We then assessed excess hospital costs and LOS, and we simulated payments under various methodologies for infected compared to uninfected, adjusting for the same covariates as in the propensity score because these may have also affected postinfection outcomes. Because uninfected patients can be matched to multiple infected patients, we clustered standard errors at the admission level.
Payment estimation
We simulated hospital payments received under DRG and per diem. First, we computed payments for all patients assuming DRG reimbursement. We assigned payments to Medicare and Medicaid patients using publicly available federal and New York State formulas at the time of discharge, incorporating indicated outlier payments. 23 , 24 Payments were calculated per diem for Medicaid patients discharged before the mean LOS for that patient’s DRG to account for Medicaid payments for those transferred to other facilities. Medicaid patients’ payments were structured according to managed care reimbursement (most in-state Medicaid beneficiaries were managed care enrollees) and adjusted to LOS if discharge occurred before the mean LOS for that patient’s DRG. 25 , 26 We assigned Medicare payment rates, including outlier payments, as baseline rates to privately insured patients because private payers often make similar stop-loss payments.Reference Cleverley, Cleverley and Song 11 We then repeated our analyses using scaling factors to simulate various markups over Medicare rates for private pay patients. For example, a scaling factor of 100% assumes hospitals were reimbursed at Medicare rates for privately insured patients, while a scaling factor of 150% assumes hospitals receive 150% of the Medicare rate for privately insured patients. We varied the markup from 100% to 200%, a range consistent with documented private insurance payment practices.Reference Ginsburg 17 , Reference Levit, Friedman and Wong 18
We simulated per diem reimbursement by assuming that hospitals would obtain the same aggregate reimbursement for their privately insured case load if they were reimbursed on a per diem basis as if it were reimbursed on a DRG basis. Based on this assumption, we computed per-diem payments by dividing aggregate payments (excluding outlier payments) by aggregate hospital days for patients by payer type. We then adjusted private payer rates for various insurance scaling factors as described above.
Cost calculations
We computed costs by adjusting hospital charges using the hospital’s cost-to-charge ratio (available in the annual “Final Rule IPPS Impact PUF” files at http://www.cms.gov/Medicare/Medicare-Fee-for-Service-Payment/AcuteInpatientPPS/). We computed excess costs borne by hospitals after adjusting for payment received, assuming that private payers paid Medicare rates with no markups. Calculations were then repeated separately for Medicare and Medicaid beneficiaries and privately insured patients, assuming payments at Medicare rates. Finally, we computed these ratios for privately insured patients and for hospitals under different private-insurer payment systems and markups, given the payer mix of patients with BSI and UTI infections. Because hospitals generally adopt the same precautions for all patients, hospital-level calculations are most appropriate in considering incentives for investment in HAI control.
Sensitivity analyses
We varied several critical assumptions to confirm robustness of results. Because of the importance of outlier payments in prior analyses, we repeated our analysis omitting outlier payments. Because we could not determine the Medicaid plan in which patients were enrolled, we repeated the analysis assuming all Medicaid patients were enrolled in fee-for-service rather than managed-care plans. We examined changes in Medicaid payments without per-diem adjustment for patients with shorter LOS than expected for their DRG diagnoses. We also estimated sensitivity of results to the exclusion of post-matching controls. Because disproportionate share hospital (DSH) were included in Medicare, 23 but not Medicaid discharge payments, 24 we estimated and included DSH Medicaid payments per discharge proportional to hospitals’ share of revenue from DSH publicly reported by the state. 27
RESULTS
Patients with and without UTI and BSI infections differed considerably in characteristics (Appendix Table 1). Most covariates differed between infected and uninfected individuals, but these differences were minimized and were not statistically significant after matching, with a few exceptions for UTI (ie, genitourinary system disease, intensive care unit stay, intubation, mechanical ventilation, and urinary catheter) and BSI (ie, malignancy and intensive care unit stay).
Adjusting for all patient characteristics, assuming privately insured payers pay at Medicare rates, UTI patients experienced $6,238 (P<.01) higher costs than patients without UTIs, while payments increased by $1,901 at public payment rates (P<.05) (Figure 1). Length of hospital stay for UTI patients was 1.97 days longer than similar patients without UTIs (P<.01) (Appendix Table 2). For BSI patients (Figure 2), costs were $15,367 higher (P<.01), while payments were $7,895 higher at Medicaid and Medicare rates (P<.01). Length of hospital stay for BSI patients was 3.67 days longer (P<.01) (see Appendix Table 2). Results using the propensity-score-matched sample, but without further controls, showed larger incremental increases in costs, payments, and LOS (see Sensitivity Analysis). In the UTI sample, unadjusted payment differences between cases and controls were proportionally greater than adjusted estimates compared to differences in costs and LOS.
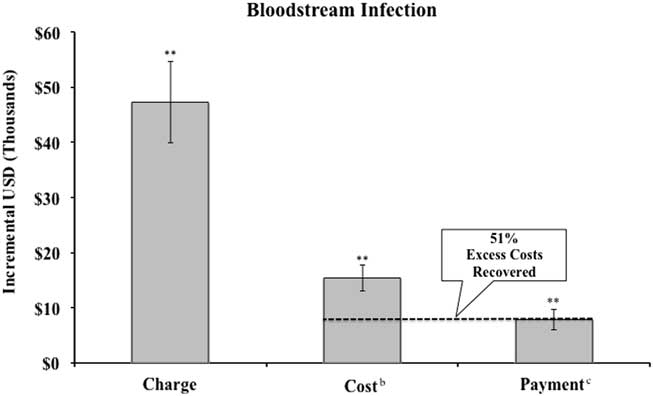
FIGURE 1 Incremental charges, costs, and payment, for patients with urinary tract infection and share of excess cost recovered by hospital compared to propensity-score matched controls.a NOTE. aSee Appendix Table 1 for discussion of propensity score matching methodology. Regressions include all controls in Appendix Table 1. Error bars represent robust standard errors. Excludes self-pay patients. bHospital costs converted from charges using hospital system’s Medicare cost-to-charge ratio. cPayment calculated as Medicaid payment (including outliers) for Medicaid patients and Medicare payment (including outliers) for all other patients. **P<.01. *P<.05.
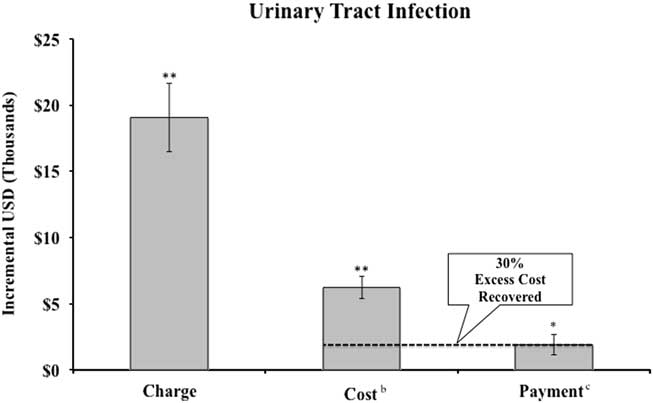
FIGURE 2 Incremental charges, costs, and payment, for patients with bloodstream infections and share of excess cost recovered by hospital compared to propensity-score matched controls.a NOTES. aSee Appendix Table 1 for discussion of propensity score matching methodology. Error bars represent robust standard errors. Excludes self-pay patients. Regressions include all controls in Appendix Table 1. bHospital costs converted from charges using hospital system’s Medicare cost-to-charge ratio. cPayment calculated as Medicaid payment (including outliers) for Medicaid patients and Medicare payment (including outliers) for all other patients. **P<.01.
At the aggregate level, assuming privately insured payers pay at Medicare rates, hospitals recovered 30% of the extra cost of treating patients with hospital-acquired UTIs and 51% of the extra cost of treating patients with hospital-acquired BSIs through higher payments.
Outlier payments were important components of reimbursement. Among UTI patients, 20.9% had charges above the outlier threshold versus 14.5% of matched controls (P<.01). Among BSI patients, 30.9% had charges above the threshold versus 25.7% of matched controls (P<.01).
We repeated these analyses by insurance type, again using Medicare rates for privately insured patients (Table 1). Incremental charges varied by payer; privately insured patients incurred higher incremental charges than Medicaid or Medicare patients for both BSI and UTI. Payment increases were highest among Medicaid BSI patients and private UTI patients. While point estimates for increased payments were positive, we cannot reject the hypothesis that there was no increase in payments between cases and controls for privately insured patients (UTI, P=.38; BSI, P=.23) and for Medicaid patients in the UTI sample (P=.90).
TABLE 1 Incremental Charges, Costs, Payment, and Length of Stay for Patients With Urinary Tract and Bloodstream Infections and Share of Excess Cost Recovered by Hospital Compared to Propensity-Score Matched Controls by PayerFootnote a

NOTE. SD, standard deviation; LOS, length of hospital stay.
a See Appendix Table 1 for discussion of propensity score matching methodology. Robust standard errors in brackets. Charges, payments, and costs presented in US dollars.
b Hospital costs converted from charges using hospital Medicare cost-to-charge ratio.
c Payment calculated as Medicaid payment (including outliers) for Medicaid patients, Medicare payment (including outliers) for Medicare patients and private payment patients (excludes self-pay patients).
The point estimates for payments and costs in Table 1 suggest that share of HAI costs recovered by hospitals varies by payer and HAI type. Hospitals recover ~50% of BSI costs among Medicare patients; 58% of BSI costs in Medicaid patients; and 27% of BSI costs in privately insured patients, assuming no markup over Medicare rates. Approximately one-third of excess costs are recovered for Medicare and privately insured patients with UTI (29% and 28%, respectively), though 8% of additional costs may be recovered for Medicaid patients. Our estimates indicate that hospitals recover 44–56% of excess HAI costs from Medicare, Medicaid, and privately insured patients.
We computed the difference in payments for infected versus uninfected patients using our matched sample, varying the method of payment (DRG vs per diem for privately insured patients) and the private insurance markup over Medicare payments, and we compared these payments to costs. We computed an average per diem payment, assuming no markup of prices over Medicare rates, of $2,584 across all privately insured patients in the hospital.
Using this estimate of per-diem rates and estimated LOS from Table 1, Figure 3 shows how the share of costs borne by the hospital for privately insured patients and for the hospital varies according to private payment rates and mechanisms. If private payers use DRGs at Medicare rates, the hospital recovers ~27% of its excess costs for privately insured patients with BSI (28% for UTI) and ~47% of its excess costs across all patients with BSI (27% with UTI), given the distribution of payers for infected patients across the hospital. If private payers pay 200% of Medicare rates, the hospital recovers ~55% of excess costs across private-pay patients with BSI and UTI. If private payers pay 200% of Medicare rates, the hospital recoups 54% of the incremental BSI costs and 33% of the incremental UTI costs across all patients with these HAIs.

FIGURE 3 Share of excess costs of hospital-associated infections recovered under different assumptions about private payer payment methodologies and markups. Calculations are based on coefficients in Appendix Table 1 (ie, adjusted, private pay patients, excluding self-pay patients). Regressions include all controls in Appendix Table 1. NOTE. DRG, diagnosis-related group; HAI, healthcare-associated infection.
Moving to per-diem payment increases the share of excess costs recovered by the hospital for all insurers without any markup. Under per-diem payment at a 100% scaling factor, the hospital recovers 71% of the excess BSI costs among private patients and 60% of the excess BSI costs across all insurers. At a 100% scaling factor, the hospital recovers >88% of the excess UTI costs among private patients and 78% across all insurers. At a 150% scaling factor, the hospital benefits financially from both BSI and UTI among private patients. At the hospital level, a 150% scaling factor and per-diem payments mean that the hospital almost fully recovers UTI costs across all patients (87%) and recovers 69% of excess BSI costs across all patients.
Varying assumptions did not change the magnitude or direction of these findings except when outlier payments were excluded. When these payments were excluded, differences were no longer significant in Medicare payments for BSI versus controls and were no longer significant in Medicaid and all payer payments between UTI cases versus controls.
DISCUSSION
Our cost and payment simulations suggest that hospitals recover a portion but not all of the full extra costs of HAI under most existing payment arrangements. Even under the most conservative payment assumptions (all payers pay DRG rates and private payers pay at Medicare rates), hospitals recover from payers one-third to one-half of the cost of HAIs, substantially reducing the incentive to make costly investments in this area. Higher private-insurer markups and the use of per diem rather than DRG payments further reduce the financial incentive for hospitals to invest in precautions that reduce HAIs. Various sensitivity analyses suggest that our findings are robust and confirm that outlier payments are an important component of this reduction in incentives. Therefore, under most scenarios examined here, payers will bear at least a portion of the costs associated with HAIs.
These findings pose several conundrums for policy makers. Higher markups help hospitals earn positive margins and retain earnings for capital investments needed to reduce infections. However, broadly increasing payment rates reduces the incentives for hospitals to invest in quality-improvement measures that lead to reductions in healthcare costs. The outlier payment system provides hospitals with protection against the cost of very expensive cases, including those patients at high risk of suffering an HAI. These protections also discourage hospitals from avoiding such cases. However, outlier payments diminish the incentive to take precautions to avoid harm.
It is possible that other components of the complex public-policy landscape mitigate the effect of increased payments due to HAI. For example, public reporting of HAI by states or the readmissions penalty program (HRRP) may also encourage hospitals to reduce infection rates.Reference Marsteller, Hsu and Weeks 29 Furthermore, it is possible that risk-adverse hospitals may not need to bear the full cost burden of HAI or reach pay-for-performance penalty thresholds to be motivated to invest in HAI prevention.
Nevertheless, it is unclear whether current incentives are ideal to reduce HAIs. Payers benefit when hospitals make costly investments to reduce infections, but different payers benefit differentially. Furthermore, hospitals with differing case mixes are not equally incentivized to reduce HAI under the current payment structures.
This study has several limitations. First, we estimated costs from charges. Because we studied urban hospitals with a particular payer-mix and cost-to-charge ratio, generalizability of these findings to other settings may be limited. Additionally, we chose not to include penalty for poor patient safety in payment calculations as this hospital system received a total HAI measures score of 6.75 from the National Healthcare Safety Network, 1 which was sufficient to avoid the penalty during the study period.Reference Rau 28 However, if penalized, base DRG payments would decrease by 1% regardless of infection status of the individual. 24 This additional hospital-wide penalty would provide an additional incentive to the hospital to reduce HAIs.
Our analysis demonstrates the complexity of designing hospital payment systems to incentivize quality improvement. Both methods and levels of payment matter, and their relation to incentives depends on the structures of the costs of quality improvement and the costs of deficient quality care. This outcome suggests that the role of payers in quality improvement may need to go beyond changing payment incentives.
ACKNOWLEDGMENTS
Financial support: This study was funded by grants from the National Institute of Nursing Research, National Institutes of Health (grant nos. R01 NR010822 and T32 NR014205).
Potential conflicts of interest: All authors report no conflicts of interest relevant to this article.
SUPPLEMENTARY MATERIAL
To view supplementary material for this article, please visit https://doi.org/10.1017/ice.2018.18.


