


Performance-based payment programs are used as a tool to incentivize hospitals to adopt better practices and reduce healthcare-associated infections, but metrics must be carefully risk adjusted to avoid unfairly penalizing some facilities. From 2000 to 2011, Clostridioides difficile infection (CDI) emerged as one of the most common causes of healthcare-associated infection in US hospitals, prompting a national escalation in public health surveillance and prevention efforts.Reference Magill, Edwards and Bamberg1 In 2009, the National Healthcare Safety Network (NHSN) introduced an objective, automated method of CDI surveillance, which classified positive laboratory test results as community-onset (CO) and healthcare facility-onset (HO) laboratory-identified (LabID) CDI events based on the timing of specimen collection, hospital admission, and recent hospital discharge.Reference Dudeck, Malpiedi, Edwards, Peterson and Sievert2, Reference McDonald, Coignard and Dubberke3 Hospitals were incentivized to report data to the NHSN by a Centers for Medicare and Medicaid Services (CMS) rule that made CMS reimbursement contingent on CDI reporting.4 In 2013–2014, the NHSN implemented a standardized infection ratio (SIR) to enable interhospital comparisons. The SIR compares the number of observed HO-CDI events for each facility with the number of predicted HO-CDI events for a comparable hospital using a risk-adjusted model.Reference Dudeck, Malpiedi, Edwards, Peterson and Sievert2 In 2016, the CMS added the HO-CDI SIR to the list of metrics used to compare hospital quality and set inpatient reimbursement, tying millions of dollars to performance on the NHSN HO-CDI SIR.5
In a perfect world, the NHSN HO-CDI event prediction model would account for all independent, nonmodifiable risk factors that affect a hospital’s HO-CDI risk, such as the number and proportion of patients with an inherently increased risk of CDI. Such a model would focus interhospital comparisons on the excess preventable fraction of HO-CDI events while fully adjusting for all of the fixed characteristics hospitals cannot readily change.Reference Dudeck, Malpiedi, Edwards, Peterson and Sievert2, 6, Reference Dudeck7 However, <1 year after CMS penalties were tied to the NHSN HO-CDI SIR, investigators in Iowa showed that the NHSN adjustment for CDI laboratory test type was insufficient and that switching the test could halve or double the SIR.Reference Marra, Edmond, Ford, Herwaldt, Algwizani and Diekema8 This and other concerns prompted the NHSN to readjust the HO-CDI prediction model using a larger cohort of hospitals from 2015.6, Reference Dudeck7, 9
Upon examining this new model, we observed that the highest tier ICU bed adjustment (≥43 ICU beds) was lower than the number of ICU beds at many large US hospitals, and there was no adjustment for oncology units and/or hematopoietic cell transplant units (ONC-HCT units) within general hospitals, despite wide recognition that these patient populations are at increased risk for CDI (Table 1).6, Reference Wallace, Seymour and Kahn10 We hypothesized that inadequate adjustment for these patients might explain why large, academic hospitals tend to be poor performers in CDI SIR rankings and decided to investigate the effect of removing ICU and ONC-HCT unit data on the CDI SIRs of large, general, acute-care facilities.Reference Al Mohajer, Joiner and Nix11–13
Table 1. Current NHSN 2015 Rebaseline HO-CDI LabID Risk-Adjusted Event Prediction Model Used to Calculate the Number of Predicted HO-CDI LabID Events for a Comparable Facility Used as the Denominator of the NHSN HO-CDI SIR Calculationa

Note. NHSN, National Health Safety Network; HO-CDI, hospital-onset Clostridioides difficile infection; LabID, laboratory identified; SIR, standardized infection ratio; EIA, enzyme-linked immunosorbent assay; NAAT, nucleic acid amplification test; ICU, intensive care unit; ED, emergency department.
Methods
We used data from 8 tertiary-care referral community and academic general acute-care hospitals in California to test our hypothesis. Quarterly CDI LabID event line list data for fiscal year 2016 (FY 2016 or July 1, 2015, through June 30, 2016) was downloaded for each facility from the NHSN. Other data used in the SIR calculation, including total facility and unit-level admissions, patient days, and bed numbers, were obtained from local sources at each facility. Unit-level admissions were the only data not available in the NHSN LabID module. This project was exempt from institutional review board review because it involved fully deidentified data and was pursued for quality improvement purposes.
We used the published 2015 rebaseline model to calculate the HO-CDI SIRs for each hospital (Table 1).6 We calculated the number of HO-CDI LabID events predicted for each quarter and facility with and without data for (1) ICUs and (2) ONC-HCT units included. Unmodified NHSN facility-wide inpatient SIRs were calculated using all observed inpatient HO-CDI LabID events in the numerator (ie, events from all inpatient locations except newborn nursery and neonatal ICUs) and all predicted HO-CDI events from the NHSN HO-CDI event prediction model in the denominator with the appropriate facility risk-adjustment parameters and facility-wide inpatient data for each facility included (Tables 1 and 2).6 Unmodified facility-wide SIRs were compared to SIRs where HO-CDI events identified in ICU or ONC-HCT units were removed from the SIR numerator and facility characteristic parameters and data were adjusted for the risk-adjustment model (eg, removing ICU admissions, ICU patient days, ICU CDI events, and setting the ICU bed adjustment to zero, or similarly removing ONC-HCT unit data) to yield the appropriate number of predicted HO-CDI events in the SIR denominator. Quarterly SIR numerator and denominator data (observed and predicted HO-CDI events) were summed to create fiscal-year data. Example calculations are shown in the online supplement.
Table 2. Facility Characteristics and FY 2016 Data for the 8 Hospitals Participating in the Studya
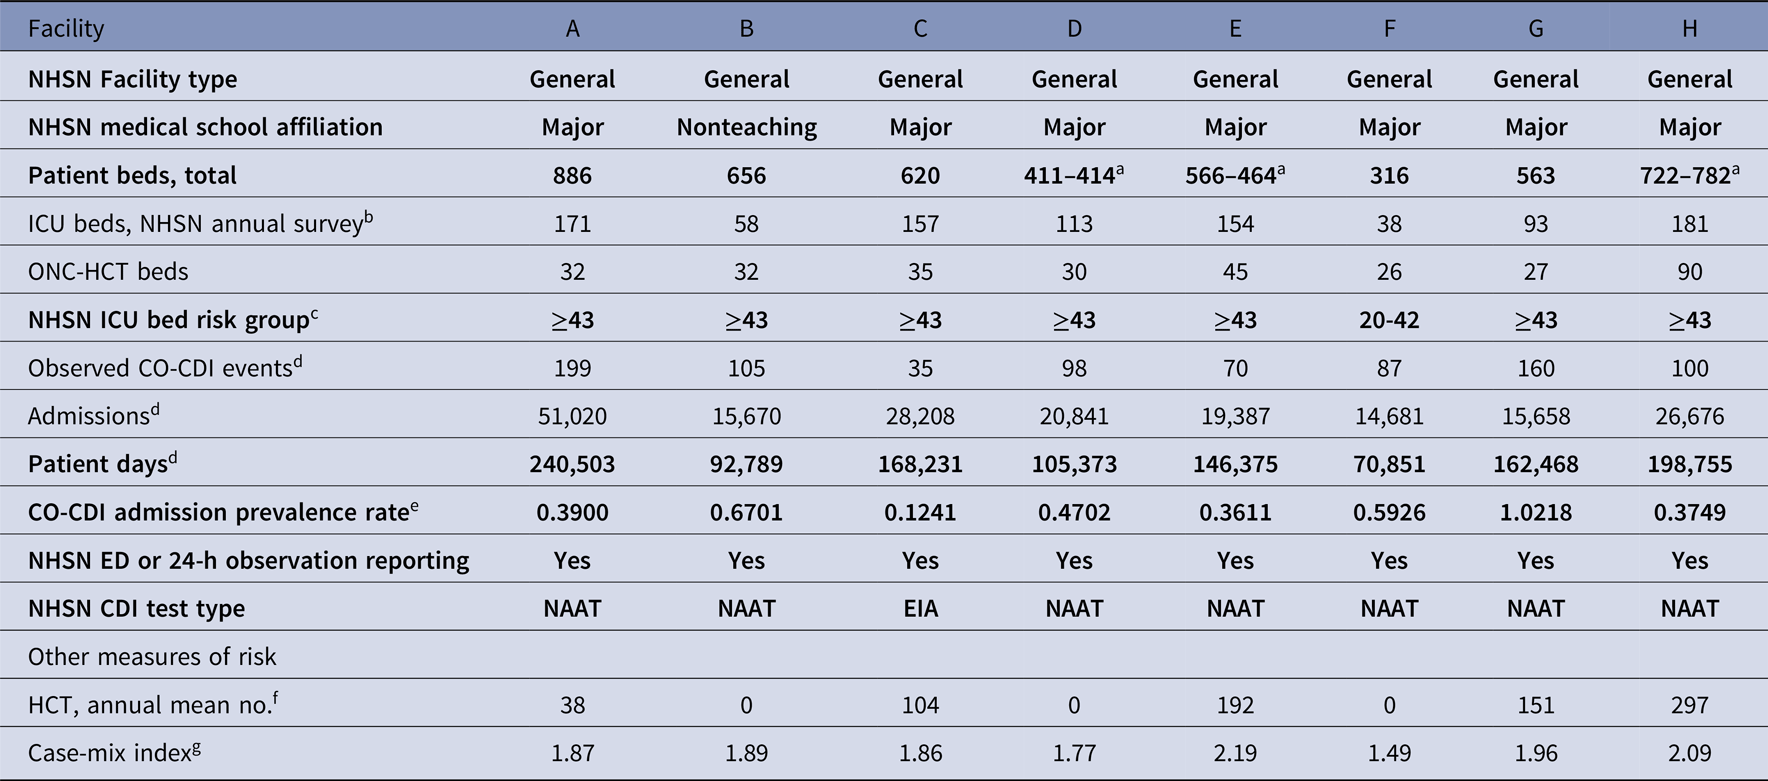
Note. FY, fiscal year; NHSN, National Health Safety Network; ICU, intensive care unit; ONC, oncology; HCT hematopoietic cell transplant; CO-CDI, community-onset Clostridioides difficile infection; ED, emergency department; SIR, standardized infection ratio; NICU, neonatal ICU. Bold rows denote characteristics used in the NHSN HO-CDI event prediction model and SIR calculation.
a Bed no. changed during study period and change was accounted for in the analysis.
b Note: the NHSN annual hospital survey ICU bed no. (used to select the ICU bed quintile risk adjustment parameter for the HO-CDI event prediction model) includes neonatal intensive care unit (NICU) beds; no. of NICU beds per facility as follows: A, 126; B, 58; C, 108; D, 68; E, 132; F, 22; G, 60; H, 123.
c Based on NHSN annual hospital survey ICU bed no. (includes NICU beds).
d The NHSN CDI module and HO-CDI event prediction model excludes positive C. difficile LabID events, admissions, and patient days from newborn nursery babies and NICU.
e Calculated per NHSN as (observed CO-CDI events/admissions)×100.
f Source: HealthData.gov FY 2016. Accessed January 30, 2019.
We calculated 2 population summary measures: (1) median facility with interquartile range (IQR) and (2) pooled mean calculated by summing the observed and predicted (expected) values across all individual facilities in the study.
Results
The facility characteristics for the 8 hospitals in the study are shown in Table 2. All were medium-to-large, urban, tertiary-care, referral, general, acute–care hospitals, including 7 major teaching facilities and 1 nonteaching hospital. Of these 8 hospitals, 7 had enough ICU beds to qualify for the highest NHSN ICU bed adjustor quintile (≥43 ICU beds) (Table 1), 1 hospital was in the second highest ICU bed adjustment quintile (20–42 ICU beds) (Table 1). The median number of ICU beds was 134 (IQR, 84–161) (Tables 2 and 3). All 8 hospitals provided specialized oncology and/or HCT care with dedicated inpatient units for these patients during the study period (median facility, 32 ONC-HCT beds; IQR, 29–38). Of the 8 hospitals, 5 performed HCTs during the study period (median among the 5 performing facilities, 151 HCTs per year; IQR, 104–192) (Table 2).
Table 3. Observed and Predicted HO-CDI Events and SIR With and Without ICU Dataa and NHSN ICU Bed Risk Adjustmentb Included in HO-CDI Event Prediction Modelc and SIR Calculation

Note. HO-CDI, hospital-onset Clostridioides difficile infection; SIR, standardized infection ratio; ICU, intensive care unit; NHSN, National Health Safety Network; IQR, interquartile range; CO-CDI, community-onset Clostridioides difficile infection.
a ICU data include CO-CDI and HO-CDI events with sample collected in ICU, ICU beds as component of total hospital beds, ICU patient days.
b ICU bed no. risk-adjustment parameter based on no. of ICU beds reported in NHSN annual hospital survey.
d NHSN facility-wide inpatient (FACWIDEIN) HO-CDI events (observed or predicted; excludes CDI events in newborn nurseries and NICU).
e Calculated from NHSN HO-CDI event prediction/risk adjustment model using facility characteristics from Table 2 and NHSN risk adjustment parameters from Table 1.6, 9
f ICU beds from NHSN annual hospital survey including NICU beds; total hospital beds from NHSN annual hospital survey for facilities A, B, C, F, G; total hospital beds = average of NHSN annual hospital survey bed no. and subsequent hospital bed no. (changed during study period) for facilities D, E, and H.
Table 3 shows the unmodified facility-wide inpatient SIRs and amended SIRs with all ICU data and the NHSN ICU bed adjustment removed. Overall, 25% of observed HO-CDI events were identified in ICUs (median, 25%; IQR, 20%–29%) (Table 3). The proportion of HO-CDI events identified in ICUs was generally greater than the proportion of hospital beds located in ICUs at most facilities (median, 22% of hospital beds in ICUs; IQR, 15%–26%). Removal of ICU data and setting the ICU bed adjustment to zero resulted in a net increase in the facility-wide SIR at all hospitals (median, 104%; IQR, 90%–105%). This SIR increase was generally 3–5 times greater than the proportion of HO-CDI events identified in ICUs at these facilities.
Table 4 shows the unmodified facility-wide inpatient SIRs and adjusted SIRs with ONC-HCT unit data removed. Overall, 17% of HO-CDI events were identified in ONC-HCT units (median, 15% of HO-CDI events identified in ONC-HCT units; IQR, 14%–21%). The proportion of HO-CDI events identified in an ONC-HCT unit was greater than the proportion of hospital beds located in ONC-HCT units at all facilities (median, 6% of hospital beds in ONC-HCT units; IQR, 5%–8%). Removal of ONC-HCT unit data resulted in a net decrease in the facility-wide SIR at all hospitals (median, −8%; IQR, −4% to −11%).
Table 4. Observed and Predicted HO-CDI Events and SIR With and Without ONC-HCT Dataa Included in HO-CDI Event Prediction Modelb and SIR Calculation

Note. HO-CDI, hospital-onset Clostridioides difficile infection; SIR, standardized infection ratio; ONC, oncology; HCT, hematopoietic cell transplant; ICU, intensive care unit; NHSN, National Health Safety Network; IQR, interquartile range.
a ONC-HCT data include CO-CDI and HO-CDI events with sample collected in ONC-HCT units, dedicated ONC-HCT beds as component of total hospital beds, and patient days from dedicated ONC-HCT units.
c NHSN facility-wide inpatient (FACWIDEIN) HO-CDI events (observed or predicted; excludes CDI events in newborn nurseries and NICU).
d Calculated from NHSN HO-CDI event prediction/risk adjustment model using facility characteristics from Table 2 and NHSN risk adjustment parameters from Table 1.
e ONC-HCT beds (Table 2) over total hospital beds (total hospital beds from NHSN annual hospital survey for facilities A, B, C, F, G; total hospital beds = average of NHSN annual hospital survey bed no. and subsequent hospital bed no. (changed during study period) for facilities D, E, and H).
Discussion
Reducing preventable HO-CDI is a public health priority, and underperforming hospitals should be encouraged to improve their infection prevention practices and antimicrobial stewardship initiatives to reduce HO-CDI. However, the high reputational and financial stakes created by mandatory participation in national surveillance and pay-for-performance incentive programs makes it imperative that metrics fully adjust for nonmodifiable patient population characteristics that lead to differences in CDI risk between facilities. Facilities with high HO-CDI SIRs are penalized under 2 CMS pay-for-performance programs: the Hospital Value-Based Purchasing (VBP) Program and the Hospital-Acquired Condition (HAC) Reduction Program.Reference Vokes, Bearman and Bazzoli14 In FY 2018, 1,211 of 2,808 US hospitals (43%) received a net reduction in inpatient reimbursement under the CMS Hospital VBP Program, and an estimated $1.9 billion in CMS reimbursement was withheld from underperforming hospitals and was rewarded to high-performing hospitals, suggesting that the stakes are high.15, 16 Among the 8 facilities included in this study, 3 had their CMS reimbursement reduced, 5 were rewarded under the VBP Program in FY 2018, 2 had their CMS reimbursement reduced, and 6 received no penalty under the HAC reduction program. The range of reimbursement losses was $61,000 to $3.2 million, and the range of reimbursement rewards was $302,000 to $1.6 million.15 Anecdotally, hospital administrators often attribute millions of dollars in reduced CMS reimbursement to high CDI SIR results holding infection prevention and antimicrobial stewardship units accountable for poor institutional performance.
In this context, we used data from 8 California referral hospitals to determine whether the 2015 rebaseline HO-CDI SIR adequately adjusts for 2 high-risk populations that are commonly enriched in tertiary-care referral hospitals: ICU and ONC-HCT patients. Our analysis confirmed that ICU and ONC-HCT units contributed an excess of HO-CDI cases relative to their bed size and other wards in these hospitals but removing ICU and ONC-HCT unit data had opposing effects on the SIR. Removing ICU data and the ICU-bed risk adjustor decreased the number of observed HO-CDI cases but increased the SIR, suggesting the ICU-bed adjustor functions as a global adjustment for the increased complexity and acuity of patients at hospitals with large numbers of ICU beds, rather than only adjusting for ICU-attributable HO-CDI cases (Table 3). In hindsight, this approach makes sense because large teaching and referral hospitals often receive the most complicated, critically ill patients from other hospitals and non-ICU patients are also more complex in these hospitals than non-ICU patients at smaller community hospitals.Reference Al Mohajer, Joiner and Nix11, Reference Burke, Frakt, Khullar, Orav and Jha17–Reference Thompson, Edwards, Dudeck, Fridkin and Magill19 National hospital comparisons show that large teaching and referral hospitals have more subspecialty ICUs, more ICU beds, more oncology patients, more transplant centers, more level I trauma centers, and a higher case mix index than community hospitals, and many of these characteristics likely carry an increased the risk of HO-CDI.Reference Al Mohajer, Joiner and Nix11, Reference Burke, Frakt, Khullar, Orav and Jha17–Reference Revolinski and Munoz-Price20 For example, case-mix index (CMI), a measure of the clinical complexity and disease severity of patients in a facility, is an independent predictor of NHSN HO-CDI incidence.Reference Thompson, Edwards, Dudeck, Fridkin and Magill19 A 2012 analysis by the CDC showed that hospitals with a CMI of 1.66 had a 12% higher HO-CDI rate than hospitals with a CMI of 1.31.Reference Thompson, Edwards, Dudeck, Fridkin and Magill19 Our observation, that removing ICU data and the ICU bed adjustment paradoxically increased the HO-CDI SIR at the 8 facilities in our study (7 of which had a CMI >1.66) (Table 2), suggests that the NHSN may be using the ICU bed adjustor to account for some of these additional risk characteristics, like high CMI, at facilities with high numbers of ICU beds.
On the other hand, our ONC-HCT analysis suggests inadequate adjustment for ONC-HCT units in the current SIR, which may disadvantage general hospitals with large oncology populations. Removal of the ONC-HCT unit data decreased the SIR for all 8 facilities despite the ICU bed adjustment (median SIR reduction, −8%; IQR, −4% to −11%). Hence, the current SIR treats HO-CDI in ONC-HCT patients as a performance failure at general hospitals even though many ONC-HCT patients are colonized prior to admission and precipitating medications (eg, chemotherapy, antibiotics) are a necessary part of ONC-HCT care. Meanwhile, the inclusion of a separate adjustment for dedicated oncology hospitals in the current SIR seems to be an acknowledgment by the NHSN that the increased risk of CDI in ONC-HCT patients is probably nonmodifiable.6, Reference Revolinski and Munoz-Price20
Although small, the 8% median SIR reduction we found with the removal of ONC-HCT unit data is enough to bring some underperforming hospitals on par with peers and presumably reduce reimbursement penalties. For example, lowering publicly available 2017 SIRs for California hospitals by 8% allowed 16.2% additional major teaching and large community hospitals with ONC-HCT units to meet the FY 2019 CMS VBP CDI achievement threshold of SIR ≤ 0.924 (n = 6 of 37). Notably, the FY 2019 CMS VBP Program assessment was the first to use the 2015 rebaseline SIR, and the performance period for this assessment was January 1, 2017, to December 31, 2017.12, 21–23
Other studies have pointed out inaccuracies in the LabID classification of CDI events, HO-CDI risk adjustment for C. difficile test method and SIR calculation.Reference Marra, Edmond, Ford, Herwaldt, Algwizani and Diekema8, Reference Albert, Ross, Calfee and Simon24–Reference Marra, Edmond, Ford, Herwaldt, Algwizani and Diekema27 Our study adds unique information by demonstrating that failure to adjust for important high-risk patient populations in general acute-care hospitals may lead to falsely elevated SIR results.
Our study also highlights the challenge the NHSN and other quality programs face in identifying and adjusting for all potential risk factors that distinguish hospitals from limited survey data. Currently, just 3 factors in the NHSN HO-CDI event prediction model describe and adjust for the severity and complexity of patient populations at individual facilities: (1) oncology versus general acute-care facility designation, (2) ICU bed number, and (3) teaching status (Table 1).6 Our observation that the ICU bed-size adjustor corrects for more than just ICU beds and CDI events, and perhaps is a predictor of higher patient complexity and severity across the hospital in facilities with higher ICU bed numbers, suggests one way to make up for limited availability of individual facility data. Yet, the wide variation in the effect of ICU and ONC-HCT SIR manipulations within our small group of facilities and incomplete adjustment for ONC-HCT HO-CDI events (assuming the ICU bed adjustment corrects for some ONC-HCT events) points to the need for more granular facility risk adjustment.
Our study also has several limitations. We only examined data from a convenience sample of 8 hospitals in 1 state, which is a small sample of the ~3,000 U.S. hospitals. We were also unable to identify ONC-HCT–related HO-CDI events in patients located outside of dedicated ONC-HCT units and attributed HO-CDI events using the location where the positive C. difficile sample was collected, which likely resulted in some misattribution.
Our study has several implications. First, hospitals with a large proportion of oncology and HCT beds are more likely to have an overestimated SIR due to incomplete adjustment of predicted HO-CDI events. This may be most important for hospitals closest to the cutoff point for penalties. Conversely, hospitals with a predominance of ICU beds and few other high-risk populations (ie, no ONC-HCT units) appear to have adjustment not only for the ICU patient population, but a presumption of a higher acuity non-ICU population as well. This accounts for ICU patients discharged to non-ICU units as well as evidence that tertiary-care hospitals have a higher acuity of patients throughout the hospital, not just the ICU.Reference Al Mohajer, Joiner and Nix11, Reference Burke, Frakt, Khullar, Orav and Jha17–Reference Thompson, Edwards, Dudeck, Fridkin and Magill19
Risk-factor adjustment by the NHSN is often limited to variables collected within the same NHSN reporting module. Currently, few variables are collected for the CDI module, limiting the ability to determine risk factors that require adjustment. However, hospitals also are required to report data to the CLABSI and CAUTI device modules for CMS reimbursement. Because these modules already collect data on the number of oncology and HCT units, beds, and patient days, and because full hospital- and patient-level data are available from state inpatient databases, it is possible for the NHSN to mine existing data for additional nonmodifiable elements that require adjustment.28 The NHSN could also collect additional information as part of the annual hospital survey and assess additional elements found to be important adjustors in published studies. For example, the risk of C. difficile colonization and infection increases with longer length of stay in the hospital and increased length of stay in non-CDI patients has been associated with higher rates of CDI, suggesting that the average patient length of stay could be an important marker for CDI risk that should be considered.Reference Loo, Bourgault and Poirier29, Reference Miller, Polgreen, Cavanaugh and Polgreen30
In summary, our evaluation of 8 tertiary-care referral hospitals revealed that the current NHSN CDI SIR quality metric does not adequately adjust for the known higher CDI risk in oncology and HCT patients, despite the fact that the NHSN acknowledges and adjusts for the higher CDI risk in dedicated oncologic hospitals. Given the high financial and reputational stakes facing hospitals with high HO-CDI SIRs, the NHSN should improve the risk adjustment for general hospitals with large ONC-HCT patient populations as soon as possible.
Supplementary material
To view supplementary material for this article, please visit https://doi.org/10.1017/ice.2020.4
Acknowledgments
None.
Financial support
This study was conducted with operational resources and no external financial support.
Conflicts of interest
All authors report no conflicts of interest relevant to this article.


