


Hospital-acquired infections (HAIs) are one of the preventable adverse events that impose significant economic consequences on the healthcare system. Surgical site infections (SSIs) account for 20% of all HAIs and are associated with increased morbidity, length of hospital stay, readmission rates, and healthcare costs. Reference Klevens, Edwards and Richards1,Reference Arefian, Vogel, Kwetkat and Hartmann2 Costs due to SSIs have been recently reported to be $3.45–$10.07 billion in the United States. 3 Because of this significant economic burden as well as high expectations of their prevention, reducing SSIs has become a major target of quality improvement initiatives, especially in the era of expanding healthcare costs. Thus, estimating the cost of SSIs has been a matter of great interest and the number of healthcare economic studies has increased. Accurate estimation of the HAI costs has important implications for hospitals, patients, and payers. Decisions concerning the extent of resources that hospitals assign to infection control (IC) and the incentives third-party payers provide to reduce infection rates require accurate information. Reference Kilgore, Ghosh, Beavers, Wong, Hymel and Brossette4
Estimating costs due to nosocomial infections requires that incremental costs associated with the infection must be distinguished from those attributable to the problems for which the patient was admitted. Reference Lauria and Angeletti5 Researchers differ on the best estimation technique to accurately capture cost. Consequently, the number of published studies that have conducted different costing methodologies to produce valid cost estimates has increased. Most studies have used case reviews, unmatched comparison, matched comparison, or regression analyses. Reference Fukuda, Lee and Imanaka6
In case review, each patient medical record is reviewed to distinguish between resources related to original causes of hospitalization and resources related to SSI. Reference Lauria and Angeletti5
Unmatched comparison of the cost outcomes for patients with SSI and for those without is not useful because of the heterogeneity unrelated to SSI and difference in time to start of infection between the 2 groups. Those with SSI might have more comorbid conditions and so might generate quite greater cost outcomes regardless of the SSI. Reference Schulgen, Kropec, Kappstein, Daschner and Schumacher7
Matching is used to replicate randomization by identifying uninfected controls that are similar as much as possible for observed covariates to infected cases. Reference Faria, Hernandez, Manca and Wailoo8 This leads to a balanced number of cases and controls across levels of the matching variables that improves statistical efficiency. Reference Rose and Laan9 One method of matching is propensity score matching (PSM). Patients with SSI are matched to uninfected control patients if their propensity scores are within a prespecified range. Reference Desai and Franklin10,Reference Stuart11 Regression analysis summarizes the association between the cost and the SSI while controlling for other observable factors that might explain variation in cost. Reference Graves, Weinhold, Tong and Birrell12 Regression can be used in combination with matching. Reference Stuart11
Cost components associated with SSIs include inpatient, outpatient, out of pocket, capital/overhead (indirect costs that have to be paid even if there is no production, include rent, utilities, insurance and staff salaries, office supplies, etc), productivity losses (costs due to loss of labor productivity due to illness or death) and opportunity costs (costs that could have been produced or purchased with the same resources if the treatment of an SSI-case was avoided). Cost estimates differ according to the chosen perspective, which determines which resources should be included and whether to use charges or costs to value them. Illustrations of types of perspective, charges, and costs are presented in Box 1.
Box 1. Illustrations of Types of Perspective, Charges, and Costs
The perspective of a cost analysis refers to the standpoint at which costs are determined. Reference Mogyorosy and Smith114 The economic impact of SSIs can be assessed from patient, provider or hospital, payer, and society perspective. Reference Drummond, Manca and Sculpher115 Costing will differ dependent on the perspective; therefore, it is important to identify those who bear these costs. Reference Tai, Bae and Le116 Cost analysis can be conducted from a single or multiple perspectives.
The choice of the perspective depends upon the point of view of decision makers Reference Mogyorosy and Smith114 and should be in harmony with the objective of the study. Reference Sculpher, Pang, Manca and Drummond14 In assigning monetary value to resource utilization, costing should be aligned with the study perspective. Reference Mogyorosy and Smith114
Patient perspective. Costs from the patient perspective are the expenses that patients pay for medical products or health care services not covered by their health insurance. Reference Drummond, Manca and Sculpher115
Provider perspective. Providers can be hospitals, managed care organizations, or private practice physicians. Costs from the provider perspective are the true costs of providing a product or service, regardless of the charge. Reference Drummond, Manca and Sculpher115 Providers usually use charges instead of the true economic costs because charge data are more readily available but are usually not reflective of the true costs of health care. Reference Yasunaga, Ide, Imamura and Ohe117
Payer perspective. Payers include insurance companies, the government, or employers. Costs from the payer perspective are charges for health care services allowed, or reimbursed, by the payer. They may include lost workdays and decreased productivity.
Societal perspective. Costs from the societal perspective are all costs and all health outcomes, regardless of who incurs the costs. Reference Zilberberg and Shorr118
Although the latest guidelines allow researchers to utilize cost estimates from published literature, the results of economic evaluations may be inaccurate. Thus, the decision to implement a control program may be misled. Reference Fukuda and Imanaka13,Reference Sculpher, Pang, Manca and Drummond14 Also, these results may not be directly applied elsewhere due to differences in the context and circumstances in which original results were produced. Therefore, epidemiologists and decision makers must assess the quality of the costing methods and transparency of cost estimates, and their suitability to their setting. Reference Drummond, Barbieri and Cook15
In 2008, Fukuda et al Reference Fukuda and Imanaka13 developed criteria for assessing transferability of the cost estimates, by reviewing publications dealing with economic evaluations. This assessment is based on 2 axes. The first is the clarification of the scope of costing. It assesses the transparency on reporting cost components and how cost estimates were calculated to enable readers to judge the potential applicability to their own cost-effectiveness and cost-savings analyses of infection control measures. The second assesses the accuracy of the costing methods which are of 2 types: micro costing or quasi–micro costing (higher accuracy) and gross costing (lower accuracy). Gross costing methods include relative value units (RVUs), cost to charge ratios (RCCS), and charges. In 2011, Fukuda et al Reference Fukuda, Lee and Imanaka16 conducted a systematic review of published studies that have produced cost estimates of HAI from 1980 to 2006 to evaluate the transferability of these estimates.
In this study, we conducted a systematic review of published studies that (1) estimated the costs of SSIs, (2) determine the distribution and trend of the analytical methodology used, and (3) evaluated the costing methods’ quality and the transparency of the cost estimates. Also, we investigated whether studies of high transferability were more likely to be cited.
Methods
Data collection
Inclusion criteria
We included primary studies that produced original costs estimates of SSI published in English from January 1, 2007, to March 23, 2021.
Exclusion criteria
Studies that had utilized existing cost estimates obtained from other published studies, studies in a language other than English, studies without full text, studies reflecting biomedical or laboratory research, studies reporting quantities of resource utilization (length of stay) rather than costs, studies focusing on identifying cost predictors (analyze impact of patient sociodemographic on cost) rather than evaluating costs, studies used infected patients in the control group, and studies in which the primary aim was economic evaluation of intervention or infection control programs (ICPs). We also excluded reviews, conceptual papers, commentaries, letters, editorials, meta-analyses, and research protocols.
Search strategy
We searched the MEDLINE database via PubMed using the following keywords ((surgical wound infection MeSH Terms) AND ((economics MeSH Terms) OR (hospital cost MeSH Terms))) AND ((“2007/1/1"Date - Publication : “2021/3/23"Date - Publication)) and used Human and English as filters. We hand-searched the references of the included studies after the MEDLINE search.
Study selection
We reviewed the identified studies in 2 steps: an initial abstract review followed by a full-text review. The initial abstract review was conducted to identify studies focusing on SSI that produced original cost estimates while excluding those that used published cost estimates.
The subsequent full-text review included studies identified as eligible and studies that could not be fully evaluated from the abstract review. The abstract review and the full-text review were conducted independently by 2 evaluators (R.H. and G.A.) with backgrounds in economic evaluations and infectious diseases. Disagreements were discussed and resolved by consensus. If a disagreement cannot be resolved, a third evaluator (O.G.) was consulted to resolve disagreement and to determine whether the article is suitable for inclusion.
Data extraction
Data were extracted as reported in the studies without judgment or deduction using a data collection form (Supplementary Materials 1 online). It included:
(1) The analytical methodology used to estimate the cost of SSI
(2) The transferability of cost estimates which was assessed according to the evaluation axes developed by Fukuda et al (2009). Reference Fukuda and Imanaka13 These evaluation axes as described below:
Evaluation axis 1: Clarification of the scope of costing. Studies were classified according to the following definitions:
-
Level A: All cost components were described, and data for both quantity and unit price of resources were reported for each component.
-
Level B: All cost components were described, and data for costs in each component were reported.
-
Level C: All cost components were described, but data for costs in each component were not reported.
-
Level D: Only the scope of costing was described, but the components of costs were not described. Studies that only reported terms such as “hospital stay” or “direct costs” without further exposition were evaluated at Level D.
Evaluation axis 2: Evaluating the costing method. Studies were further classified according to the following definitions:
-
α: The use of micro- or quasi-microcosting, i.e., activity-based costing
-
β: The use of relative value units (RVU)
-
γ: The use of charge data based on the ratio of costs to charges (RCC).
-
δ: The use of unmodified charge data
-
ϵ: Studies that offer no information to readers about the methodology used.
The α level was assigned for studies that reported using the “actual costs” in valuing resources without determining how these costs were estimated.
Level of transferability was considered high when the level of clarification of scope of costing was A or B and costing method was α.
(3) Relevant criteria for reporting which were adopted from Drummond et al Reference Drummond, Sculpher, Claxton, Stoddart and Torrance17 and the CHEERS checklist Reference Husereau, Drummond and Petrou18 as follows: economic perspective, cost description measure, time horizon, discounting, price year and/or inflation adjustment, sensitivity analysis, currency and currency conversion.
The data items were independently extracted by 2 members of the review team (R.H. and G.A.). Disagreements were discussed and resolved. When disagreements could not be resolved, a third researcher (O.G.) was consulted.
Statistical analysis
The Monte-Carlo test and the Fisher’s exact test were used to test the difference in the distribution of the analytical methodologies, scope of costing, costing method, length of stay adjustment, and transferability through the study periods. The Monte-Carlo test was conducted to test wheather or not the costing method is aligned with the chosen economic perspective. Also, 2 Poisson log-linear models were used to test whether transferability level, as well as scope of costing and costing method, affect the number of citations while adjusting for the time since publication. The numbers of citations (from the year of publication to 2021) were obtained from Google scholar. The effect size was summarized using the adjusted incident rate ratio. Significance level was set at P < .05.
Results
We identified 541 studies after searching MEDLINE, and hand-searching the references of relevant studies. After title and abstract review, 81 were assessed by full literature review, and 70 were included (Fig. 1). The reasons of exclusion after full literature review were: utilizing existing cost estimates from published studies, Reference Graves, Halton, Doidge, Clements, Lairson and Whitby19 estimating the cost based on expert opinion, Reference Fadayomi, Kasumova and Tabatabaie20 estimating the incremental cost associated with bacterial resistance because the comparison group were also infected, Reference Vargas-Alzate, Higuita-Gutiérrez, López-López, Cienfuegos-Gallet and Jiménez Quiceno21 estimating cost of SSI as a part of economic evaluation of intervention or ICPs, Reference Leaper, Holy and Spencer22–Reference Gunnarsson, Rizzo and Hochheiser25 studies in which SSI was not a single component of the cost object (eg, complications of certain surgery, HAI, or wound healing Reference Al-Qurayshi, Baker and Garstka26–Reference Nosrati, Boroumand, Tahmasebi, Sotoudeh, Sheikhfathollahi and Goodarzynejad28 ), and using contribution margin rather than cost to evaluate the impact of SSI. Reference Von Strauss, Marti Walter and Mujagic29

Fig. 1. PRISMA flow diagram showing identification and selection of published studies that estimated the cost of SSIs from 2007 to 2020.
Among the studies included in the review, 38 were conducted in the United States, 20 were conducted in Europe, 6 were conducted in Asia, and 5 were conducted in Australia, Brazil, Canada, and Egypt. Half of the studies (52.9%) were multicenter, 17 studies (24.3%) were conducted in university hospitals, and 7 studies (10%) were conducted in tertiary-care hospitals (Tables 1 and 2).
Table 1. Analytical Methodology, Additional Estimates, Matching Variables or Regression Analysis Covariates, Economic Perspective Used in the Studies Cited in the Systematic Review
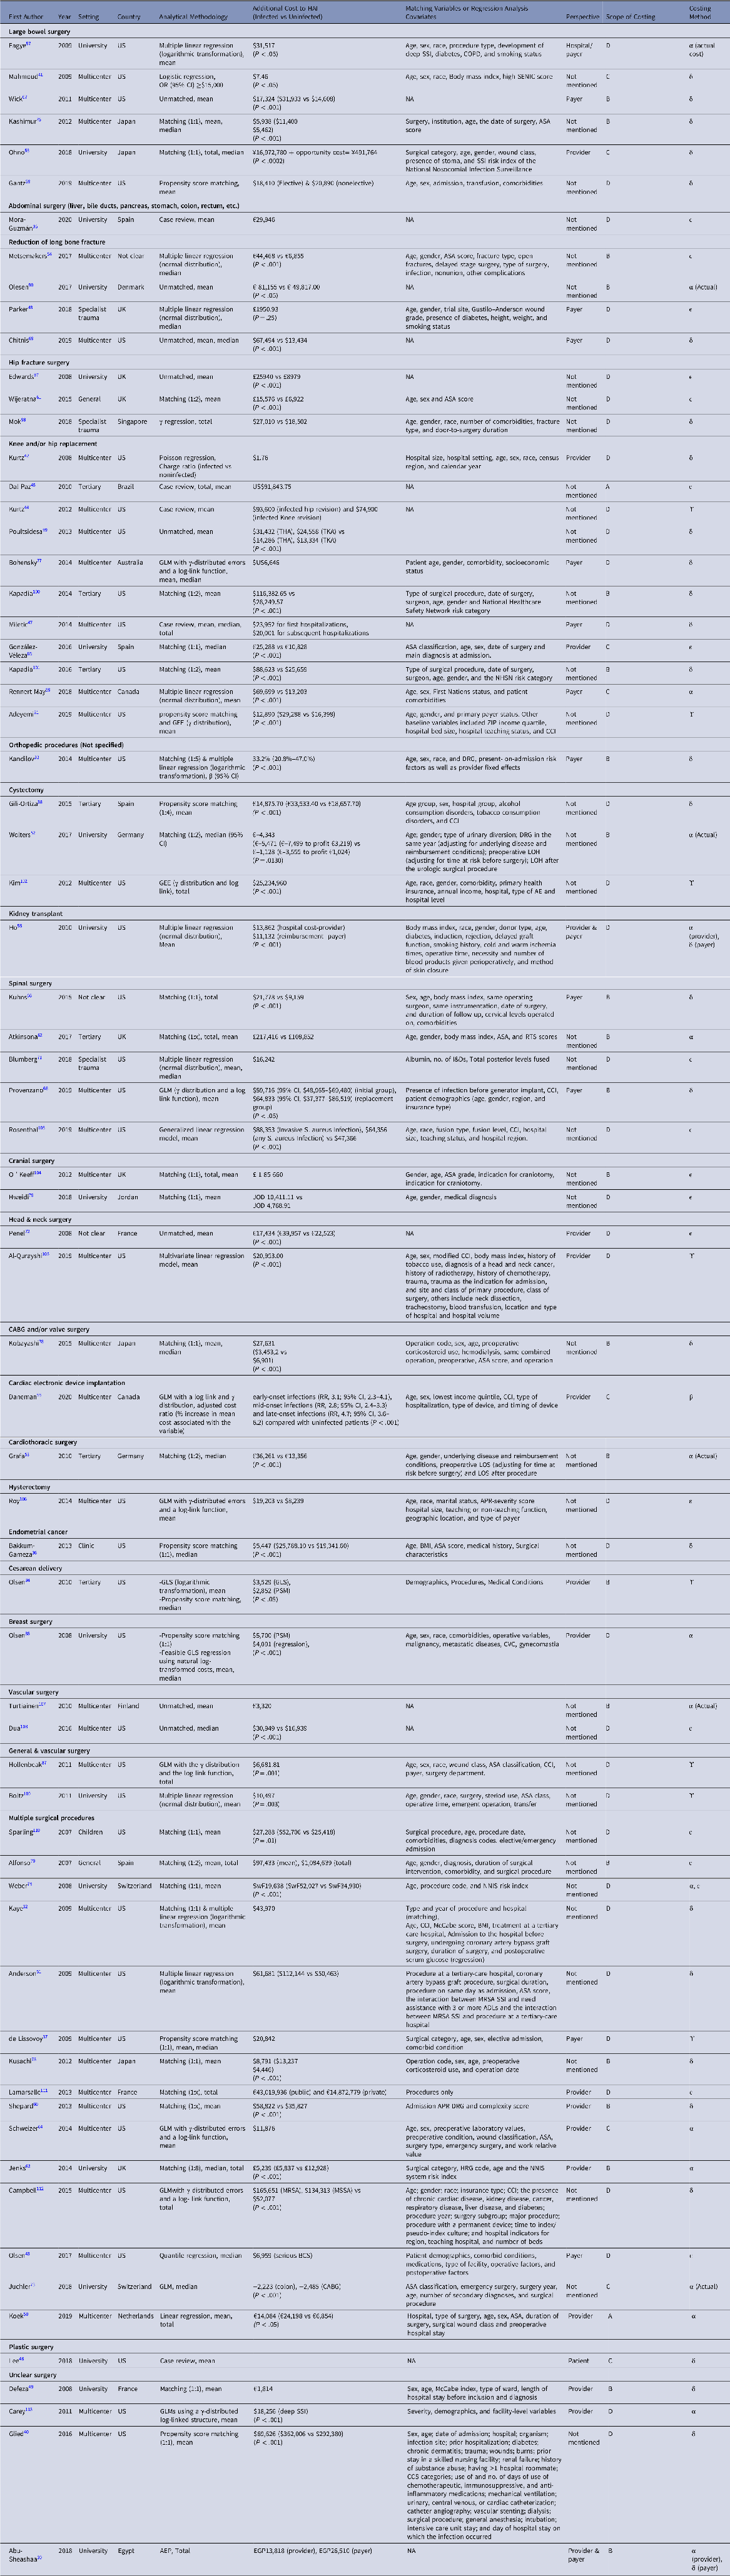
Note. AE, adverse event; APR DRG, all-patients refined diagnosis-related groups; ASA, American Society of Anesthesiologists classification;
BCS, breast-conserving surgery; BMI, body mass index; CABG, coronary artery bypass graft; CCI, Charlson Comorbidity Index; CCS, Clinical Classifications Software; CI, Confidence Interval; COPD, chronic obstructive pulmonary disorder; CVC, central venous catheter; I&D, irrigation and debridement; GEE, generalised estimating equation; GLM, generalized linear model; GLS, generalized least squares; HRG, Healthcare Resource Group; LOS, length of hospital stay; MRSA, methicillin-resistant Staphylococcus aureus; MSSA, methicillin-susceptible Staphylococcus aureus; NA, Not Applicable; NHSN, National Health Safety Network; OR, Odds ratio; NNIS, National Nosocomial Infection Surveillance;
PSM, propensity score matching; RTS, Revised Tokuhashi Score; RR, rate ratio; SENIC, Study on the Efficacy of Nosocomial Infection Control; SSI, surgical site infection; THA, total hip arthroplasty; TKA, total knee arthroplasty.
Table 2. Characteristics of the Published Studies Used to Estimate the Cost of SSI Between 2007 and 2020

a Others: specialist trauma (n = 3 studies), general (n = 2), not stated (n = 2), clinic (n = 1), children (n = 1)
b Country: Europe includes United Kingdom (n = 6 studies), France (n = 3), Spain (n = 4), Germany (n = 2), Switzerland (n = 2), Denmark (n = 1), Finland (n = 1), and Netherlands (n = 1), Asia includes Japan (n = 4), Jordan (n = 1) and Singapore (n = 1), others include Australia (n = 1), Brazil (n = 1), Canada (n = 2), Egypt (n = 1), and not clear (n = 1).
Analytical methodologies and adjustment on time to start of infection
The most frequent analytical methodologies were matched comparison, and regression models (82.9%) (Table 3). Moreover, 6 studies (8.6%) used case review; one of these was standardized using used appropriateness evaluation protocol (AEP). Reference Abu-Sheasha, Yassine, Anwar and Bedwani30 Regression on a matched sample was used in 3 studies (4.3%). Reference Adeyemi and Trueman31–Reference Kandilov, Coomer and Dalton33 The distribution of the studies through the different analytical methodologies was not significantly different between the periods 2007–2013 and 2014–2020.
Table 3. Analytical Methodology, Time to Infection Adjustment and Transferability of the Cost Estimates of SSI in the Included Studies by Publication Year

a 3 studies that used regression on matched sample were included in regression category while the 2 studies that used regression as well as PSM as analytical methodologies were counted twice (with matched comparison and with regression).
b MCp = Monte Carlo test P value.
c FEp = Fisher’s exact P value.
d 2 studies that estimated the cost from 2 perspectives used 2 different costing methods, microcosting method for hospital perspective and charges for patient or payer, each study was counted in the corresponding category of the costing method twice.
In matched comparisons, 13 studies (46.4%) used 1:1 matching in which each infected patient was matched to a single control patient, and 6 studies (21.4%) used 1:2 matching. Matching based on propensity scores was performed in 7 studies. Reference Olsen, Butler, Willers, Gross, Hamilton and Fraser34–Reference Glied, Cohen, Liu, Neidell and Larson40
Regarding the regression models, 24 studies (88.9%) used multiple regression, 9 of them used normal distribution of costs as the dependent variable, and 15 used logarithmic and/or γ transformation. Other regression models used include multiple logistic regression (1 study), Reference Al-Qurayshi, Baker and Garstka26,Reference Mahmoud, Turpin, Yang and Saunders41 multiple Poisson regression (1 study), Reference Kurtz, Lau, Schmier, Ong, Zhao and Parvizi42 and quantile regression (1 study). Reference Olsen, Tian and Wallace43 Also, 2 studies Reference Olsen, Butler, Willers, Gross, Hamilton and Fraser34,Reference Olsen, Chu-Ongsakul, Brandt, Dietz, Mayfield and Fraser35 compared total cost between SSI cases and controls matched based on propensity scores as well as regression model (Table 1).
The statistical comparison between SSI and non-SSI patients was reported in 63 studies (98.4%), P value was mentioned in 44 studies (69.8%), and P was <.05 in all but 1 study (Table 1). Reference Parker, Petrou, Masters, Achana and Costa48
Only 9 studies (12.9%) Reference Kaye, Anderson and Sloane32,Reference Glied, Cohen, Liu, Neidell and Larson40,Reference Defez, Fabbro-Peray, Cazaban, Boudemaghe, Sotto and Daurès49–Reference Daneman, Homenauth, Saskin, Ng, Ha and Wijeysundera55 accounted for the time to start of SSI. Also, 4 studies Reference Glied, Cohen, Liu, Neidell and Larson40,Reference Defez, Fabbro-Peray, Cazaban, Boudemaghe, Sotto and Daurès49,Reference Wolters, Oelke and Lutze52,Reference Graf, Ott, Vonberg, Kuehn, Haverich and Chaberny53,Reference Daneman, Homenauth, Saskin, Ng, Ha and Wijeysundera55 used the time to start of SSI itself, and 5 studies Reference Kaye, Anderson and Sloane32,Reference Koek, van der Kooi and Stigter50,Reference Anderson, Kaye and Chen51,Reference Metsemakers, Smeets, Nijs and Hoekstra54,Reference Daneman, Homenauth, Saskin, Ng, Ha and Wijeysundera55 used the preoperative LOS or “having the surgery on same day of admission” as regression covariate instead. The percentage of studies that accounted for time to start of SSI from 2007 to 2020 has not statistically significantly changed.
Transferability
Regarding the scope of costing, the most common level was D (38 studies, 54.3%) and B (22 studies, 31.4%) levels, only 2 studies Reference Dal-Paz, Oliveira, Paula, Emerick, Pécora and Lima45,Reference Koek, van der Kooi and Stigter50 were classified as level A studies (Table 3). The distribution of the studies through the levels of the scope of costing was not significantly different between the 2 periods (2007–2013 and 2014–2020).
The most frequently reported costing method was the charge method in 29 studies (41.4%). The method of costing was unknown in 19 studies (27.1%). Among the 15 studies that reported the use of actual costs, 5 studies did not determine the method of estimating these costs. In our review, only 7 studies (10%) had a high level of transferability. The distribution of costing methods and transferability were not significantly different between the periods 2007–2013 and 2014–2020.
Economic perspective
Of the included studies, 40 (57.1%) did not state the economic perspective. The cost was estimated from hospital or provider perspective in 18 studies (25.7%), from the payer perspective in 13 studies (18.6%), and from the patient perspective in 2 studies. Reference Abu-Sheasha, Yassine, Anwar and Bedwani30,Reference Lee, Morrison, Maeng, Ascherman and Rohde46 No studies estimated the cost from societal perspective. However, 3 studies Reference Abu-Sheasha, Yassine, Anwar and Bedwani30,Reference Ho, Lynch, Ranney, Magar, Kubus and Englesbe56,Reference Eagye and Nicolau57 estimated the cost from 2 perspectives. Ho et al Reference Ho, Lynch, Ranney, Magar, Kubus and Englesbe56 and Eagye et al Reference Eagye and Nicolau57 estimated the cost from hospital and payer. Abu-Sheashae et al Reference Abu-Sheasha, Yassine, Anwar and Bedwani30 estimated the cost from provider and patient perspectives.
Among the 18 studies conducted in the United States and that also mentioned the economic perspective, 9 studies (50%) estimated the cost from the payer perspective, 8 studies (44.4%) estimated the cost from the hospital or provider perspective, and 1 study (5.6%) estimated the cost from the patient perspective. In Europe, hospital or provider perspective was the most common.
The reported costing method was significantly aligned with the chosen perspective among 21 of the 28 studies with reported perspective and costing method. Also, 11 studies (73.3%) adopted provider or hospital perspective and used actual costs directly or indirectly by converting charges to actual cost using RVU or RCC, while 10 studies (76.9%) considered payer or patient perspective and used unmodified charges (P = .008). An unsuitable costing method was used in the remaining 7 studies (25%), where actual costs were used with payer or patient perspective in 3 studies Reference De Lissovoy, Fraeman, Hutchins, Murphy, Song and Vaughn37,Reference Eagye and Nicolau57,Reference Rennert-May, Conly and Smith59 and unmodified charges were used with provider perspective. Reference Kurtz, Lau, Schmier, Ong, Zhao and Parvizi42,Reference Defez, Fabbro-Peray, Cazaban, Boudemaghe, Sotto and Daurès49,Reference Ohno, Shimada, Satoh, Kojima, Sakamoto and Hori58,Reference Shepard, Ward and Milstone60
In addition, 2 studies estimated the cost from 2 perspectives. Abu-Sheasha et al Reference Abu-Sheasha, Yassine, Anwar and Bedwani30 used microcosting for hospital perspective and charges for patient perspective. Ho et al Reference Ho, Lynch, Ranney, Magar, Kubus and Englesbe56 also used microcosting for hospital perspective and charges for payer perspective.
Types of cost
Overall, the types of costs included were aligned with the chosen perspective. In the 18 studies that estimated the cost from the provider perspective, in addition to the inpatient cost, capital and overhead costs, Reference Olsen, Chu-Ongsakul, Brandt, Dietz, Mayfield and Fraser35,Reference Jenks, Laurent, McQuarry and Watkins63–Reference González-Vélez, Romero-Martin, Villanueva-Orbaiz, Diaz-Agero-Pérez, Robustillo-Rodela and Monge-Jodra65 opportunity costs, Reference Ohno, Shimada, Satoh, Kojima, Sakamoto and Hori58,Reference Shepard, Ward and Milstone60,Reference Jenks, Laurent, McQuarry and Watkins63 and outpatient costs, Reference Abu-Sheasha, Yassine, Anwar and Bedwani30,Reference Olsen, Butler, Willers, Gross, Hamilton and Fraser34,Reference Koek, van der Kooi and Stigter50,Reference Daneman, Homenauth, Saskin, Ng, Ha and Wijeysundera55 were considered. Inpatient and outpatient costs Reference Kandilov, Coomer and Dalton33,Reference Olsen, Tian and Wallace43,Reference Parker, Petrou, Masters, Achana and Costa48,Reference Kuhns, Lubelski and Alvin66–Reference Chitnis, Vanderkarr, Sparks, McGlohorn and Holy69 as well as productivity losses Reference Ho, Lynch, Ranney, Magar, Kubus and Englesbe56,Reference Eagye and Nicolau57,Reference Kuhns, Lubelski and Alvin66 and out-of-pocket costs Reference Miletic, Taylor, Martin, Vaidya and Kaye47,Reference Miletic, Taylor, Martin, Vaidya and Kaye47,Reference Provenzano, Falowski, Xia and Doth68 were included in 13 studies in which the payer perspective was adopted. With patient perspective, Reference Abu-Sheasha, Yassine, Anwar and Bedwani30,Reference Lee, Morrison, Maeng, Ascherman and Rohde46 inpatient, outpatient and out-of-pocket costs were included. Also, opportunity costs were considered by Lee et al. Reference Lee, Morrison, Maeng, Ascherman and Rohde46
Time horizon and discounting
In total, 63 studies (90%) stated the duration over which cost was calculated, ranging from 1–3 months to lifetime (Table 4). Reference Alfonso, Pereperez, Canoves, Martinez, Martinez and Martin-Moreno70 Discounting was applicable when the time horizon was 1 year or more Reference Kandilov, Coomer and Dalton33,Reference Miletic, Taylor, Martin, Vaidya and Kaye47,Reference Metsemakers, Smeets, Nijs and Hoekstra54,Reference Rennert-May, Conly and Smith59,Reference Kuhns, Lubelski and Alvin66,Reference Chitnis, Vanderkarr, Sparks, McGlohorn and Holy69,Reference Blumberg, Woelber, Bellabarba, Bransford and Spina71 in 8 studies; however, costs were discounted only in 1 study, Reference Alfonso, Pereperez, Canoves, Martinez, Martinez and Martin-Moreno70 and 2 studies Reference Kaye, Anderson and Sloane32,Reference Anderson, Kaye and Chen51,Reference Alfonso, Pereperez, Canoves, Martinez, Martinez and Martin-Moreno70 discounted their costs although they were collected over 3 months only.
Table 4. Reporting Characteristics of the Cost Estimates of Surgical Site Infections in Published Studies Between 2007 and 2020
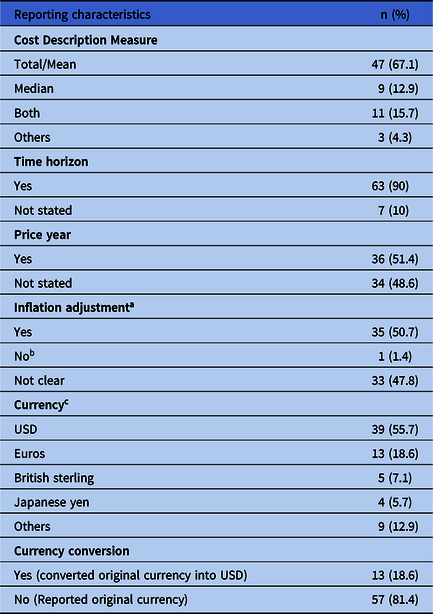
a 1 study Reference Parker, Petrou, Masters, Achana and Costa48 was not applicable for inflation adjustment because price year was same year over which the study was conducted.
b As mentioned by Ohno et al. Reference Wolters, Oelke and Lutze52
c Others in currency include Canadian dollars (n = 2 studies), Swiss francs (n = 2), Egyptian pound (n = 1), Australian dollars (n = 1), Jordanian dollars (n = 1), Danish kroner (n = 1), Real (Brazilian currency) (n = 1).
Price year and inflation adjustment
In 36 studies (51.4%), the price year was reported in which the cost was adjusted for inflation except for 1 study Reference Parker, Petrou, Masters, Achana and Costa48 in which inflation adjustment was not required because costs were reported in the same year (Table 4) (Supplementary Material 2 online).
Currency and currency conversion
The most commonly reported currency was USD (39 studies, 55.7%), converted from other currencies in 13 studies (18.6%) Reference Glied, Cohen, Liu, Neidell and Larson40,Reference Dal-Paz, Oliveira, Paula, Emerick, Pécora and Lima45,Reference Rennert-May, Conly and Smith59,Reference González-Vélez, Romero-Martin, Villanueva-Orbaiz, Diaz-Agero-Pérez, Robustillo-Rodela and Monge-Jodra65,Reference Alfonso, Pereperez, Canoves, Martinez, Martinez and Martin-Moreno70,Reference Penel, Lefebvre and Cazin72–Reference Olesen, Pedersen and Eckardt80 that reported the method of conversion and exchange rate. Exchange using purchasing power exchange was used in only 1 study (Table 4) (Supplementary Material 2 online). Reference González-Vélez, Romero-Martin, Villanueva-Orbaiz, Diaz-Agero-Pérez, Robustillo-Rodela and Monge-Jodra65
Cost description measure
Among these studies, 47 (67.1%) reported the mean or total cost. We included studies that reported the total cost with those that reported the mean cost because the total cost can be used to calculate the mean. Median cost was reported in 9 studies (12.9%). Also, 11 studies (15.7%) reported both median and total and mean cost. Other measures used for reporting were the ratio of the charges for infected versus noninfected, Reference Kurtz, Lau, Schmier, Ong, Zhao and Parvizi42 adjusted cost ratio, Reference Daneman, Homenauth, Saskin, Ng, Ha and Wijeysundera55 and odds ratio of logistic regression. Reference Mahmoud, Turpin, Yang and Saunders41 In a study in which logistic regression was used, Mahmoud et al Reference Mahmoud, Turpin, Yang and Saunders41 did not mention how they determined the cost threshold (Table 4).
Sensitivity analysis
Only 5 studies Reference Glied, Cohen, Liu, Neidell and Larson40,Reference Koek, van der Kooi and Stigter50,Reference Shepard, Ward and Milstone60,Reference Penel, Lefebvre and Cazin72,Reference Bohensky, Ademi and deSteiger77 undertook sensitivity analysis to explore the impact of the of variation in per diem cost of hospitalization and length of hospitalization, change of prevalence of SSI, imputation of missing cost data for cases, and excluding deaths during follow-up.
Citation analysis
Studies with high transferability were statistically significantly 1.4 times more likely to be cited than low transferability studies (95% CI, 1.15–1.58). Studies with a scope of costing A/B were statistically significantly 1.1 times more likely to be cited relative to D studies (95% CI, 1.032–1.257). Studies with a scope of costing C were as cited as D studies. Studies that used actual costing, ratio of costs to charges (RCC), or relative-value units (RVU) methods were 1.2 times more likely to be cited than studies with unknown costing method (95% CI, 1.031–1.319). Studies that used unmodified charges were 1.3 times more likely to be cited than those with an unknown costing method (95% CI, 1.12–1.43).
Discussion
Recently, many studies and reviews have focused on the impact of SSI on medical costs. Reference Kashimura, Kusachi and Konishi75 Accurate information on the cost of SSI is required to support decisions concerning the extent of resources hospitals devote to infection control. Reference Kilgore, Ghosh, Beavers, Wong, Hymel and Brossette4 Published cost estimates may not be transferable, and thus, the decision based on them to implement a program may result in undesirable consequences. Reference Fukuda and Imanaka13,Reference Sculpher, Pang, Manca and Drummond14 Also, these estimates are not necessarily comparable due to the variation in the costing scopes, cost accounting systems, unit costs, clinical practice, costing methods, statistical methods used to determine attributable costs, and duration of follow-up. Reference Kilgore, Ghosh, Beavers, Wong, Hymel and Brossette4,Reference Olsen, Chu-Ongsakul, Brandt, Dietz, Mayfield and Fraser35 Thus, it is crucial to assess the quality of the costing methods and the transferability of cost estimates before using them. In this review, we aimed to critically appraise published articles after the reviews made by Fukuda et al Reference Fukuda, Lee and Imanaka6,Reference Fukuda, Lee and Imanaka16 to explore whether researchers addressed their recommendations. However, most researchers did not address these recommendations that make their cost estimates unlikely to be transferable.
Matching and regression analysis represented 80% in our review. Both methods are easy to implement given the hospital information system’s availability. Matching on covariates, unlike regression analysis, does not require complicated statistical analysis. However, with many covariates, the proportion of unsuccessful matches increases. Reference Graves, Weinhold, Tong and Birrell12 Although it is easier to base matching on a propensity score (PS), one scalar that summarizes all covariates is still associated with unsuccessful matches. Thus, reporting the proportion of successful matches to measure the potential bias is recommended. Reference Fukuda, Lee and Imanaka6 Of the 31 studies that used matching on PS or covariates, only 10 (32.3%) had reported the proportion of successful matches. With a lack of controls matching to severely infected cases, the latter is likely to be excluded with subsequent underestimation of SSI cost (ie, selection bias). Reference Olsen, Butler, Willers, Gross, Hamilton and Fraser34
The whole study sample could only be preserved using regression analysis and PS-based weighting approaches as inverse probability weighting (IPW). Reference Desai and Franklin10,Reference Graves, Weinhold, Tong and Birrell12,Reference Allan, Ramagopalan and Mardekian81 This might explain why more studies used regression analysis than was reported by Fukuda et al (39% vs 26%). Also, regression analysis was used after matching to control for any remaining imbalances in 2 studies.
The impact of different analytical methods on estimated costs is unclear. In the current review, 2 studies compared matching with regression analyses. One study found no difference between them Reference Olsen, Chu-Ongsakul, Brandt, Dietz, Mayfield and Fraser35 , and the other revealed higher estimates with regression. Reference Olsen, Butler, Willers, Gross, Hamilton and Fraser34 A similar unclear pattern was observed by Fukuda et al. Reference Fukuda, Lee and Imanaka6
As reported by Fukuda et al, Reference Fukuda, Lee and Imanaka6 case review was the least used method to estimate the cost as it is labor intensive. Additionally, if the criteria for inclusion of SSI-related resources were unclear as in the AEP method, Reference Wakefield, Pfaller, Hammons and Massanari82 expert reviewers as physicians or nurses might be required to review records. Reference Wakefield, Pfaller, Ludke and Wenzel83
SSI increases total costs by extending the LOS. Concurrently, extended time to start of SSI (LOS before SSI) is by itself a cause of SSI. Thus, LOS is an endogenous variable because it simultaneously affects and is affected by SSI. Without adjustment for time to start of SSI, the cost of SSI is usually overestimated as the time to start of SSI is incorrectly assigned to the cost of SSI. Reference Kilgore, Ghosh, Beavers, Wong, Hymel and Brossette4,Reference Graves, Weinhold, Tong and Birrell12,Reference Lloyd-Smith84 Contrarily, adjustment for the “whole LOS” underestimated the cost of SSI. Reference Kilgore, Ghosh, Beavers, Wong, Hymel and Brossette4,Reference Kilgore and Brossette85 In the current review, only a few studies (13%) adjusted for time to start of SSI. None of them adjusted for the whole LOS. Even when the time to start of an SSI was unknown, researchers adjusted for only a part of this time, eg, adjusting for preoperative LOS.
Half of the studies did not report the type of perspective. In a recent systematic review, Sculpture et al Reference Sculpher, Pang, Manca and Drummond14 found that the perspective was defined in only 42% of the studies. When researchers neglect to report the perspective, decision-makers could not interpret if the relevant costs and selected costing methods are consistent with the objective of costing. This will affect the generalizability and transferability of the reported results.
Most of the studies which reported perspectives assigned the monetary values of resources according to the chosen perspective. Since hospital perspective was the most common, studies mainly included inpatient costs and excluded post-discharge costs, mainly borne by patients, caregivers, and the community health service. Excluding post-discharge costs might considerably underestimate the burden of SSI. Perencevich et al Reference Perencevich, Sands, Cosgrove, Guadagnoli, Meara and Platt88 found that the inclusion of post-discharge costs increased SSI cost by a factor of 3. Thus, the choice of hospital perspective should be considered carefully.
Although ICPs are implemented by and in hospitals, considering their perspective provides little incentive to implement ICP because hospitals might not bear the consequences of SSI. We recommend estimating the costs from the perspective of whoever bears the consequences, either the patients or the society. If it proves to be substantial, then legislation should be set to encourage hospitals to keep SSI rates low, even if the hospitals will not gain monetary benefit from reducing SSI.
Overall, researchers chose a perspective that aligns with the main source of health financing in their countries. In the United States, where private insurance dominates, 89 payer perspective was mainly adopted. In Europe, where universal health coverage predominates, 89 provider perspective was the most common.
Also, researchers were aware of how the chosen perspective affects the assigned costing method. Inconsistent methods of costing were observed in only 25% of the studies. Moreover, 80% of studies that took payer or patient perspective used unmodified charges. Unlike Fukuda et al, we believe that unmodified charges are not always less accurate than actual costs. In countries where out-of-pocket payments constitute the main sources of financing healthcare services, as in low-income countries, charges might be more realistic to evaluate the burden of illnesses or the impact of interventions.
As reported by Fukuda et al, Reference Fukuda, Lee and Imanaka16 few studies (10%) had a high transferability level, and D was the most common scope of costing. No increase in the percentage of studies was reported at the B level, the recommended level that achieves the balance between clarity (which is essential for transferability) and practicality when estimating the cost. Reference Fukuda and Imanaka13
Half of the studies we reviewed were multicenter studies. In contrast to single-setting studies, multicenter studies Reference Sculpher, Pang, Manca and Drummond14,Reference O’Brien90 generate comparable standardized and transferable cost estimates. Most of the studies were conducted in the United States and Europe, and few were conducted in developing countries. The underrepresentation of low-income countries hinders the transferability to similar countries.
All of the studies that converted currency reported the type of exchange rate used. Unfortunately, all but 1 study Reference González-Vélez, Romero-Martin, Villanueva-Orbaiz, Diaz-Agero-Pérez, Robustillo-Rodela and Monge-Jodra65 used the market exchange rate. The purchasing power parity exchange rate is superior to the market exchange rate because the former is determined by the relative cost of living and inflation rates in different countries. Thus, it allows for transferability and comparability of cost estimates.
In the current review, most studies reported the mean or total costs, and only 13% reported the median cost. Although cost data are known to be skewed, the use of median underestimates the burden of SSI. For decision making, the cost is best presented with the mean. Reference Mani, Lundkvist, Holmberg and Wanhainen91 Additionally, such studies should be accompanied by sensitivity analysis to evaluate the robustness of the estimated costs. Reference Sculpher, Basu, Kuntz and Meltzer92,Reference Briggs93 In this review, only 5 studies conducted sensitivity analyses.
Lack of reporting does not only hinder the transferability of the cost estimates, it also might hinder their usage in clinical support decisions in the setting where they were estimated. For example, without reporting the time horizon (observed in 10% of the studies), readers are left unable to check whether the cost of SSI was entirely captured and whether discounting should have been applied. Neglecting the price year, which was reported in half of the studies, hinders the comparability and transferability of cost estimates between different settings and times.
Unlike Fukuda et al, Reference Fukuda, Lee and Imanaka16 we found that researchers became more inclined to use transferable studies. We observed significantly higher numbers of citations of studies with high transferability as well as studies with a clear scope of costing (A/B) and studies that used actual costing/RCC/RVU.
Here, we updated the reviews by Fukuda et al. Reference Fukuda, Lee and Imanaka6,Reference Fukuda, Lee and Imanaka16 Although we confined our review to only 1 type of HAI, we broadened the criteria for critically appraising the included studies to enhance cost studies’ quality and transferability as economic perspective, types of cost (inpatient, outpatient, out of pocket, productivity losses, capital/overhead, opportunity), cost description measure, time horizon and discounting, price year and inflation adjustment, currency and currency conversion, and sensitivity analysis.
This study has several potential limitations. We limited our search to MEDLINE only via PubMed, included only published studies, and excluded studies in which evaluating intervention or ICPs was the primary aim, although they could have estimated the cost of SSI. The impact of these limitations might be minimal for the following reasons. MEDLINE was capable of identifying from 75% to 92% of relevant studies. Reference Hartling, Featherstone, Nuspl, Shave, Dryden and Vandermeer94,Reference Halladay, Trikalinos, Schmid, Schmid and Dahabreh95 Unpublished studies are less likely to be sources of SSI cost to support decision for implementing ICP. Exclusion of the studies evaluating the economic impact of ICP kept the included studies more homogenous in methodology and reporting. Another limitation is that we did not address other aspects of the costing methodology, for example, which confounding variables are important to include, and how to refer to the time to start of the infection. These factors might be topics for further research.
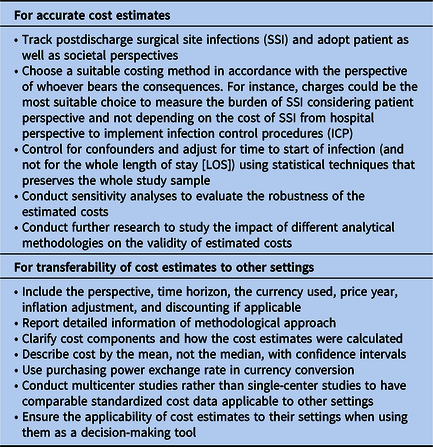
In conclusion, over the past 14 years, matching and regression analysis were more likely used to control for confounding factors to minimize bias. Although LOS adjustment has decreased, researchers started to correctly use “time to start of infection” instead of “whole LOS” for adjustment. Researchers mainly adopted a hospital perspective and neglected patient and societal perspectives in the postdischarge setting. After Fukuda et al article, we observed no significant improvement in the transferability of published studies; however, unlike Fukuda et al, transferable studies became more likely to be cited. Researchers became selective in using cost estimates derived from other settings, indicating increased awareness about fundamentals in costing methodologies.
Researchers were less likely to consider reporting recommendations made by Drummond et al Reference Drummond, Sculpher, Claxton, Stoddart and Torrance17 and the CHEERS checklist Reference Husereau, Drummond and Petrou18 when estimating the cost of SSI (Table 5). We believe that these recommendations, while not new, are unfortunately not well considered by researchers and should be used when conducting their economic evaluations to estimate the cost.
Table 5. Recommendations to Improve Costing Methodologies for Surgical Site Infections
Supplementary material
To view supplementary material for this article, please visit https://doi.org/10.1017/ice.2021.381
Acknowledgments
We acknowledge the contribution made by all authors of the articles included in this review.
Financial support
No financial support was provided relevant to this article.
Conflicts of interest
All authors report no conflicts of interest relevant to this article.


