For several years, point-prevalence surveys (PPSs) have been conducted in different countries to estimate the burden of healthcare-associated infections (HAIs). The European Centre for Disease Prevention and Control (ECDC), as part of its Antibiotic Resistance and Healthcare-Associated Infection (ARHAI) network, performed its last joint PPS in 2016 and 2017. Reference Suetens, Latour and Kärki1 Although Switzerland did not participate formally in this survey, its Federal Office of Public Health commissioned Swissnoso to carry out a national PPS on HAIs in Swiss acute-care hospitals. Swissnoso is a publicly funded association of experts in the field of infection prevention and control in Switzerland (www.swissnoso.ch). The aim of the survey was to estimate the burden of HAIs and the use of antimicrobials, applying the ECDC protocol, and to compare the results with other European countries. Reference Metsini, Vazquez and Sommerstein2–Reference Zingg, Metsini and Gardiol4
We estimated the HAI burden in terms of incidence and attributable length-of-stay (LOS) based on the national PPS data on HAIs in 2017. The incidence proportion refers to the proportion of patients who will suffer from an HAI during their hospital stay. This quantity is distinct from the prevalence proportion, which is the proportion of patients with an active HAI during any one point in time. Evaluation of incidence and attributable LOS usually requires prospectively collected data of a patient cohort. The PPS, however, was conducted on a single day in each participating hospital; thus, prospective patient data were available from admission to the survey date only. Follow-up data beyond that point were not reported by the PPS. However, we were able to obtain follow-up information for a subset of patients. Our aim was to develop an approach not previously applied to PPS data to infer follow-up information for the remaining patients.
The methodological challenge with prevalence data is the length-biased sampling design in which patients with prolonged LOS are overrepresented. In addition, in the analysis of attributable LOS, the time-dependent onset of HAI needs to be considered to avoid time-dependent bias. Reference Wolkewitz, Schumacher, Rücker, Harbarth and Beyersmann5 A number of methodological articles have shown that both types of bias (time-dependent bias and length bias) have an important impact on clinical epidemiology data. Reference Wolkewitz, Allignol, Harbarth, de Angelis, Schumacher and Beyersmann6–Reference Wolkewitz, von Cube and Schumacher8 Therefore, we explored a new approach that accounts for these biases, estimated incidence proportions, and attributable LOS when only partial follow-up data are available from a PPS.
Methods
Healthcare-associated infections
Patient data were collected by individual case report forms, and HAIs were defined as outlined in the ECDC protocol version 5.3. Reference Zingg, Metsini and Balmelli3,9 Healthcare-associated infections were stratified into bloodstream infections (BSIs), lower respiratory tract infections (LRIs), surgical site infections (SSIs), urinary tract infections (UTIs), and other HAIs. In case of multiple HAIs, only the first was considered because only this is required for the incidence proportion and because we were interested in length of stay (LOS) with versus without acquiring an HAI. We distinguished between HAI present at admission, HAI occurring during hospitalization and up to the PPS (prevalent HAI), and HAI occurring during hospitalization but after the PPS (incident HAI). HAIs present at admission (ie, previously acquired at a different healthcare facility) were modeled separately from HAIs that occurred during hospital stay because these events represent distinct at-risk populations.
Point-prevalence survey data
The Swiss 2017 PPS database collected data from April to June from 12,931 patients in 96 acute-care hospitals, including information on age, sex, date of hospital admission, date of HAI, type of HAI, patient specialty, surgery since admission, and McCabe score. Reference Zingg, Metsini and Balmelli3 Data at the hospital level included hospital size and provision type. Patients in long-term care, geriatrics, and rehabilitation were excluded, and length of stay was censored after 90 days to meet the definition of acute care.
Steady-state assumption
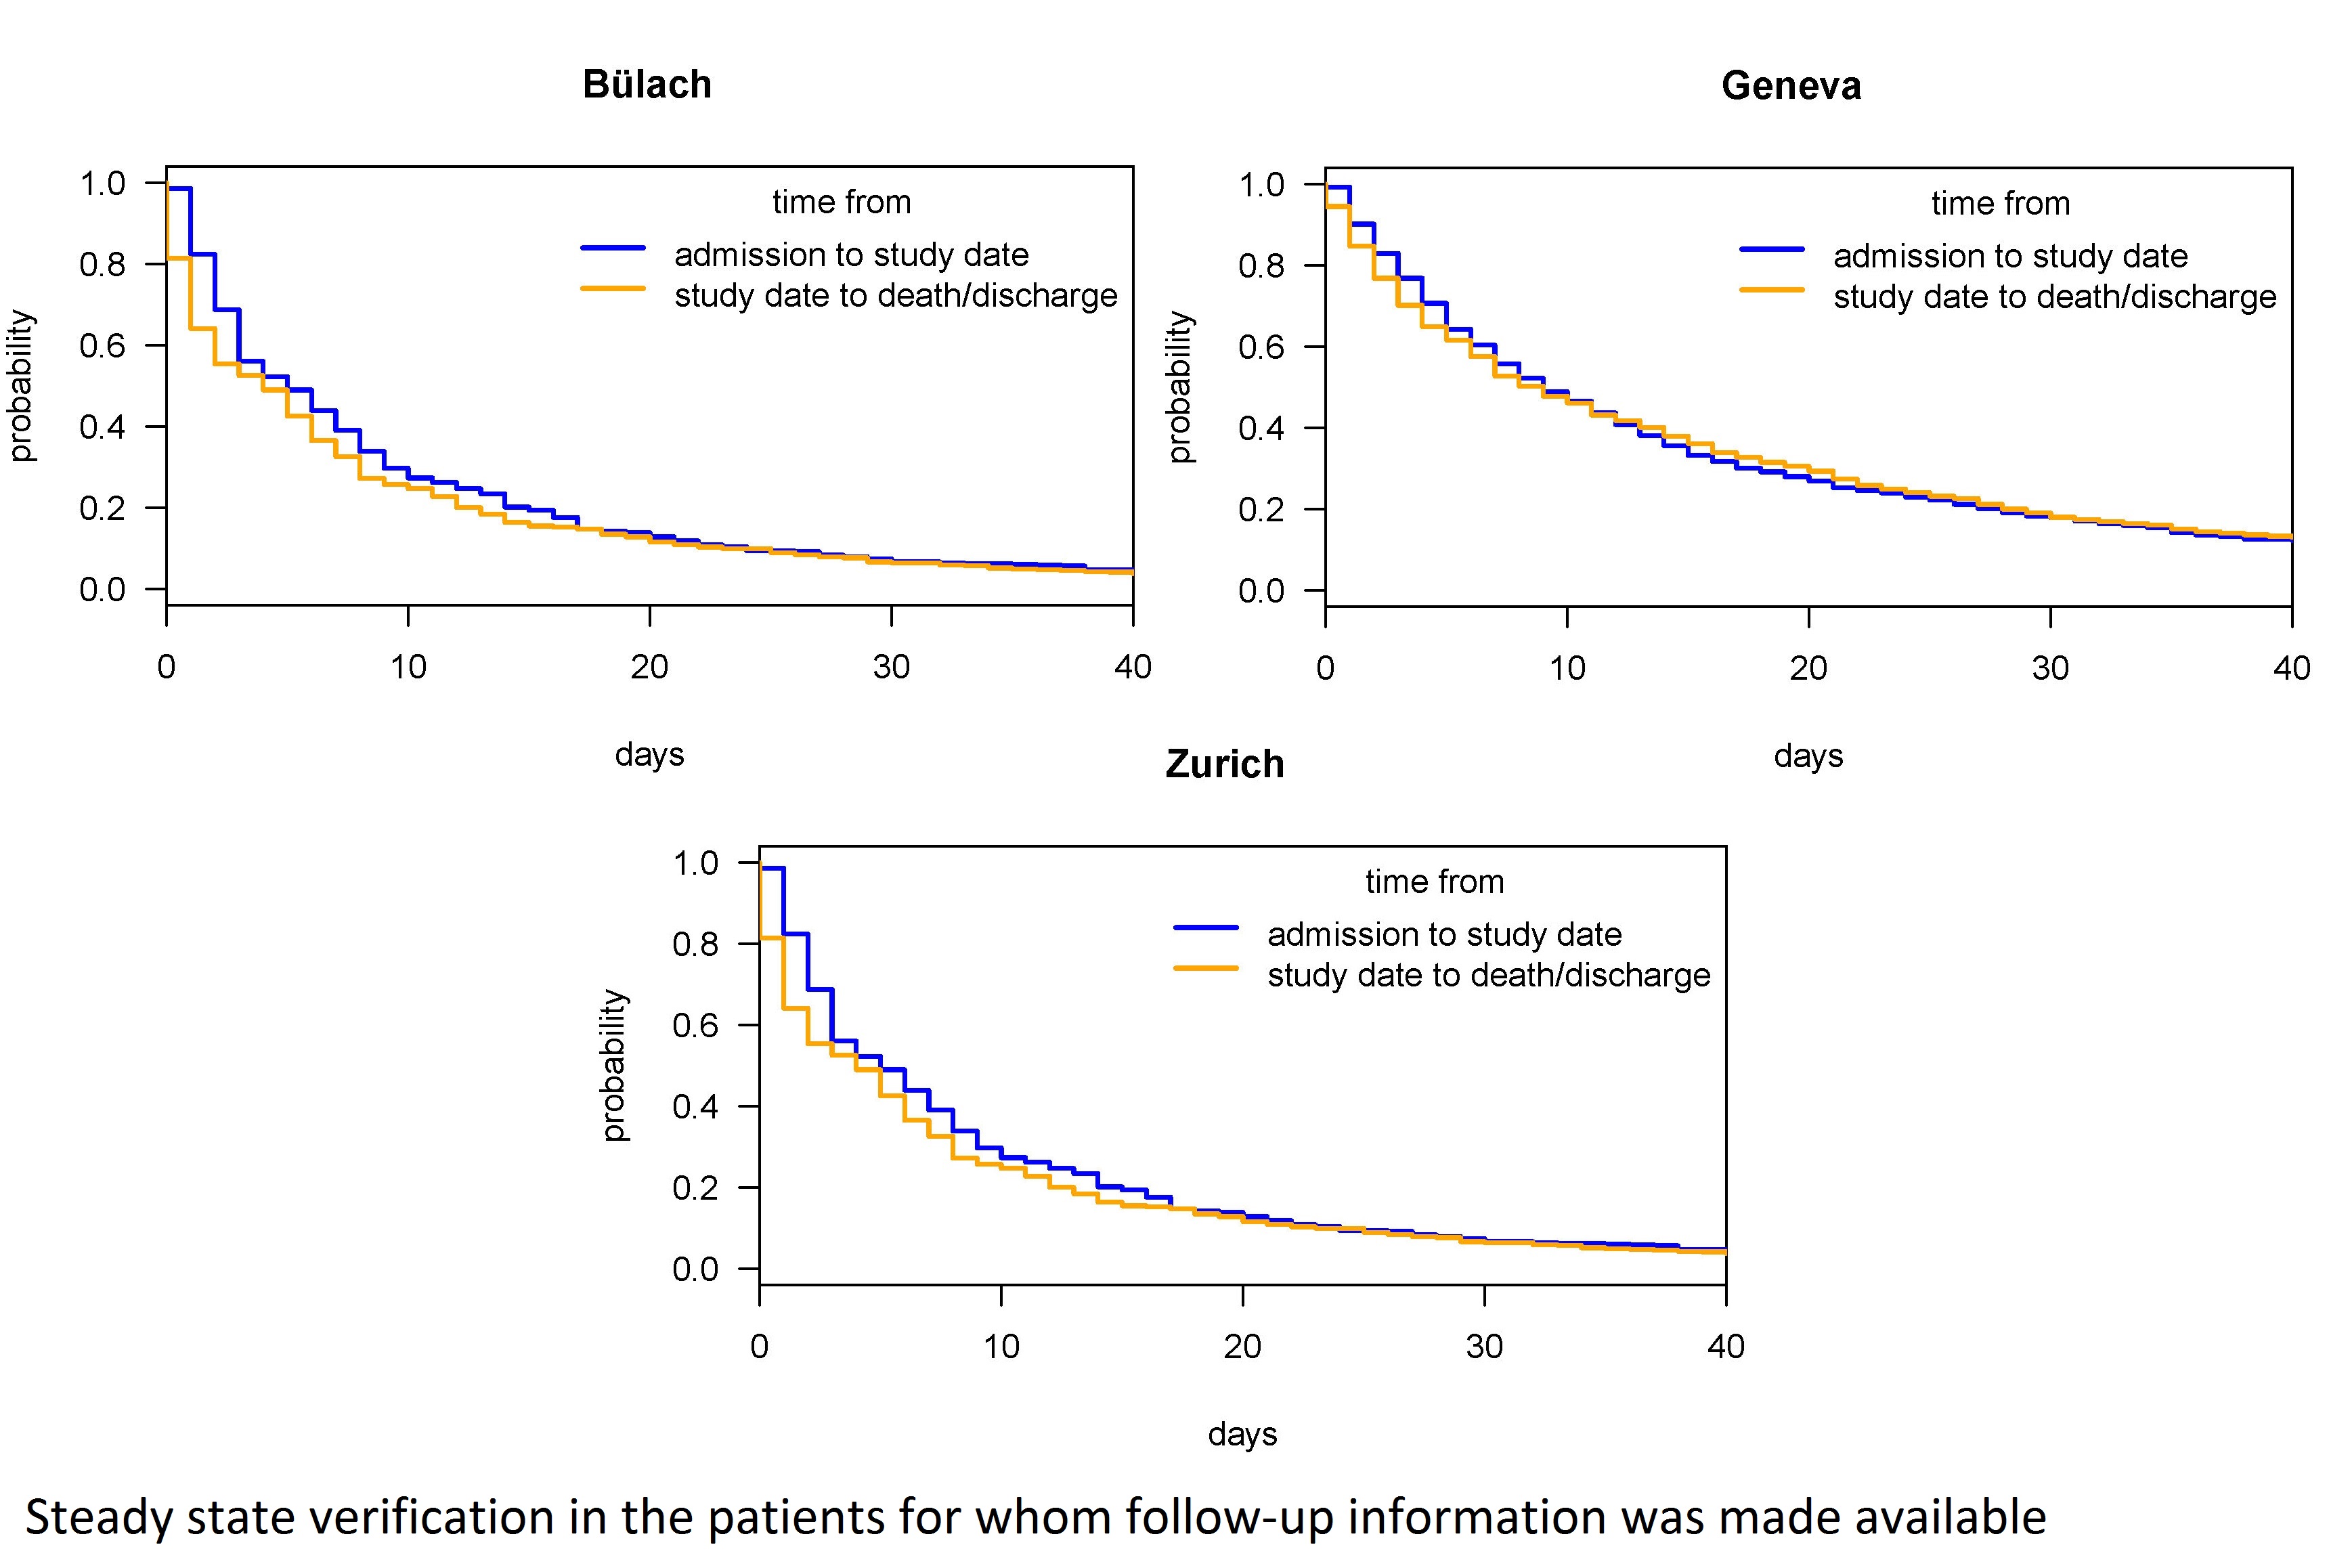
Our model makes use of the steady-state assumption, which, in broad terms, asserts that the number of patients entering and leaving a hospital is balanced at any period, and that the distribution of LOS does not change over time. The assumption should be confirmed, Reference Doerken, Mandel, Zingg and Wolkewitz10 which can be done by comparing the distribution time from admission to PPS to the distribution time from PPS to discharge. Reference Asgharian, Wolfson and Zhang11 Under a steady state, the distributions are the same. We confirmed that the steady-state assumption was met using the follow-up data (Supplementary Fig. 1 online).
Imputation
Follow-up information beyond the PPS was imputed using data for 1,714 patients from 3 hospitals that provided follow-up data sets of the patients beyond the date of the PPS (Bülach, Geneva, Zurich) (Fig. 1). Patients from Geneva and Zurich represented large Swiss hospitals, and patients from Bülach, a regional hospital, represented small to medium-sized hospitals (Table 1). Imputation was stratified by prevalent HAI type. For every patient with missing follow-up with a prevalent infection, we imputed the following:
-
1. Time from PPS to discharge
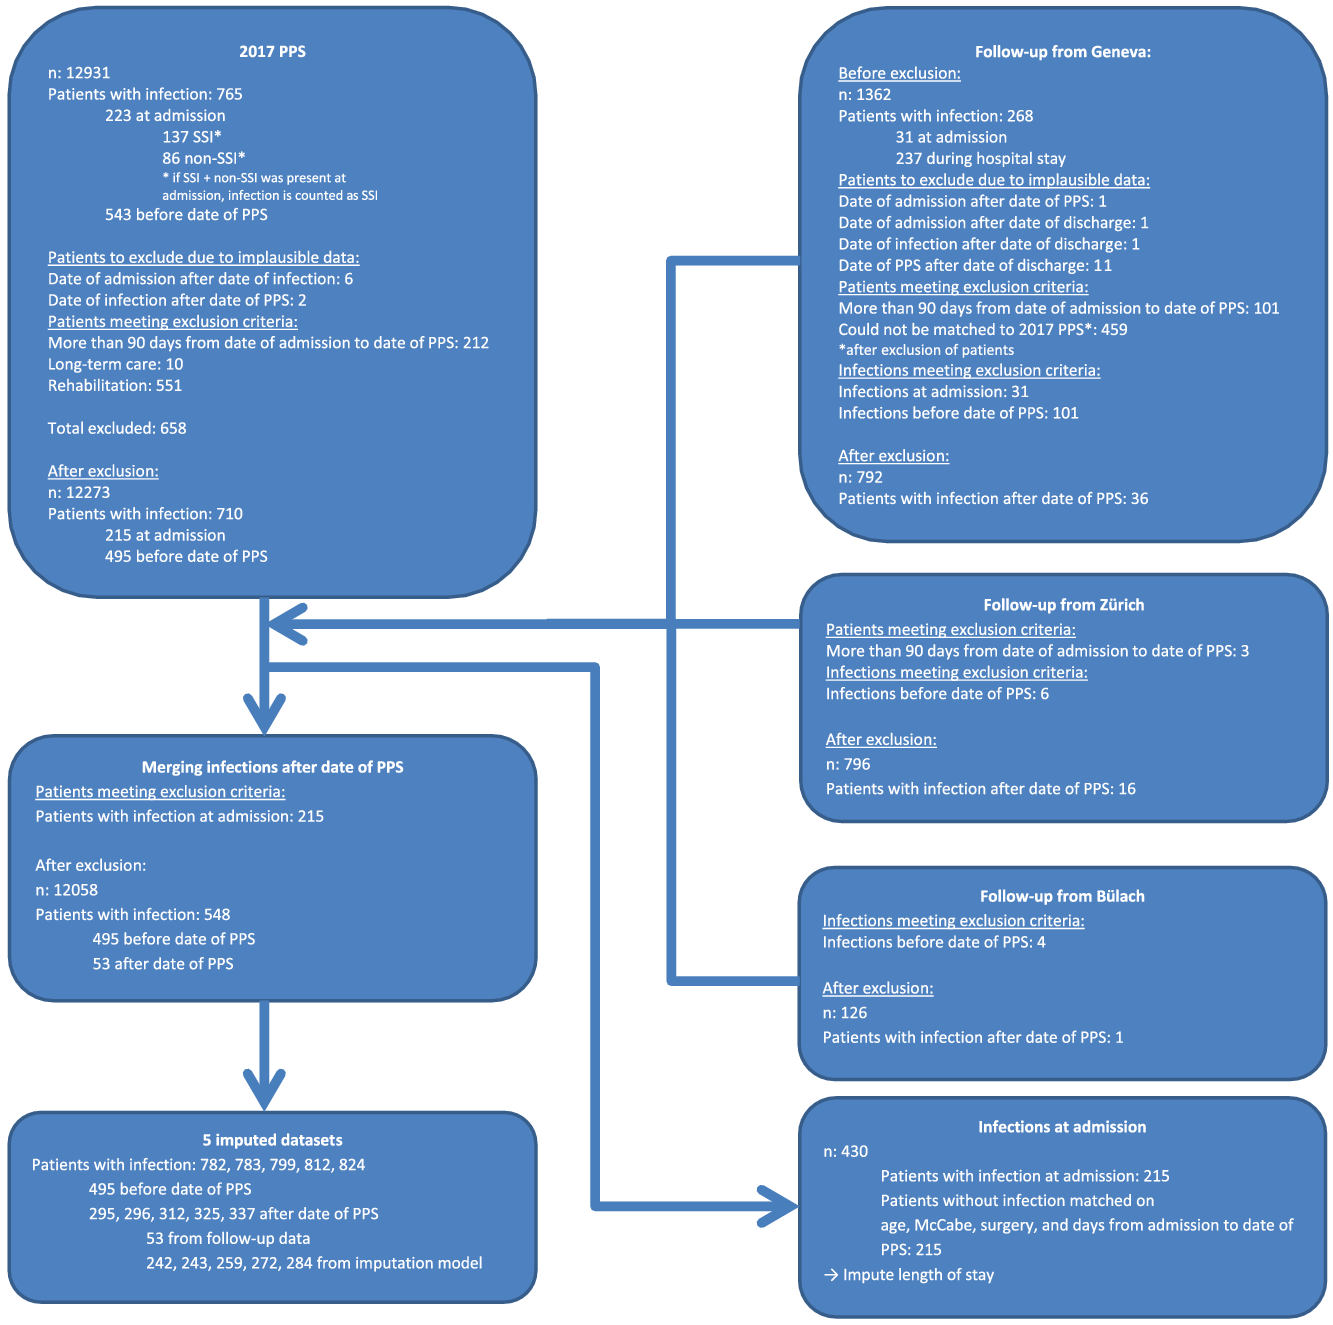
Fig. 1. Patient flow chart.
Table 1. Descriptive Patient Summary Per Hospital

Note. HAI, healthcare-associated infection; ICU, intensive care unit.
a Percentage of “ulimately fatal” or “rapidly fatal.”
For every patient with missing follow-up without a prevalent infection, we imputed the following:
-
1. Time from PPS to discharge
-
2. Time from PPS to incident infection
-
3. Time from incident infection to discharge:
-
If discharge (1) occurred before incident infection (2), the patient was considered infection free.
-
If discharge (1) occurred after incident infection (2), the patient was considered undergoing an infection and to remain in hospital with additional time from incident infection to discharge (3).
-
Time to event T was modeled using an accelerated failure time model with a Weibull link function,
 $T\sim Weibull\left( {\lambda,\sigma } \right)$
with shape parameter λ and scale parameters
$T\sim Weibull\left( {\lambda,\sigma } \right)$
with shape parameter λ and scale parameters
 $\sigma \left( x \right) = {\beta _0} + {\beta _1}{x_1} + \ldots + {\beta _p}{x_p}$
with covariate vector x.
Reference Kalbfleisch and Prentice12
$\sigma \left( x \right) = {\beta _0} + {\beta _1}{x_1} + \ldots + {\beta _p}{x_p}$
with covariate vector x.
Reference Kalbfleisch and Prentice12
Time from PPS to discharge
To obtain a model for time from PPS to discharge, we modeled time from admission to PPS. This method is valid under the steady-state assumption in which the distribution of LOS is symmetric around the time of the PPS. The advantage of this method was that the time from admission to PPS was available for all patients, not just those with follow-up available. Another advantage was that we could add a variable to capture the hospital-specific effects on LOS of the large hospitals (Basel, Bern, Brig, Geneva, Lausanne, St Gallen, and Zurich) using all remaining hospitals as a reference. Further covariates, such as age, McCabe score, surgery since admission, and prevalent HAIs, were added to the model.
Time from PPS to infection and time from infection to discharge
To determine the time from PPS to incident infection and the time from incident infection to discharge, we fitted models to the follow-up data that were available using age, McCabe score, surgery since admission, and time from admission to PPS as covariates.
We drew from the distributions of our imputation models 5 times for each patient to generate 5 augmented data sets. Reference Buuren and Groothuis-Oudshoorn13 Figure 2 is a depiction of the length of stay, showing both original and imputed data, of 1 augmented data set.
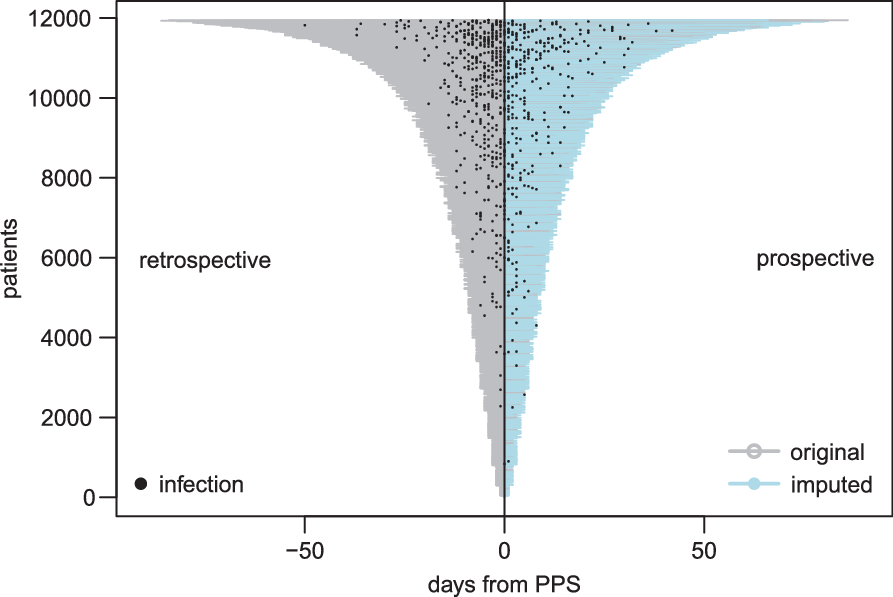
Fig. 2. Visualization of point-prevalence survey (PPS) data. As part of the PPS only retrospective information was available. For a subset of patients from Bülach, Geneva, and Zurich, prospective information beyond PPS date on date of infection and discharge was made available. From this information, we developed a model to impute prospective information for the remaining patients. Note that this figure depicts only 1of 5 imputed data sets.
Length bias and weighting
After creating an augmented data set with follow-up information, length bias was corrected by weighting patients inversely to the LOS: overrepresented long LOSs were adjusted downward, and underrepresented short LOSs were adjusted upward. These weights were included as probability weights in the logistic and Cox regression models. Reference Fluss, Mandel and Freedman14 Patients who were censored were given a weight of 0 because their LOS was not known; thus, they were effectively excluded from the model. Reference De Uña-Álvarez15 For analyzing attributable LOS, weight adjustments were conducted using a data set in which observations were duplicated inversely proportionally to their LOS.
Incidence proportion and hazard rates
The incidence proportion of HAI was estimated using a mixed-effects multivariable logistic regression model, including hospital as a random effect. Hazard rates were estimated in a multistate multivariable Cox model. Reference Wolkewitz, von Cube and Schumacher8 Patients were weighted to correct the length bias. Reference Wang, Armitage and Colton16 Models were fitted to each of the 5 augmented data sets and the 5 data sets were pooled to obtain results. Reference Buuren and Groothuis-Oudshoorn13 The confidence intervals of incidence proportions and hazard rates were calculated using robust estimates of the standard error.
Attributable length of stay
To evaluate the impact of HAIs on hospital stay, we compared the expected subsequent stay given infection status at day d Reference Schulgen and Schumacher17 : patients who acquired an infection after d days were compared to infection-free patients with at least d days of hospitalization. To account for the time-dynamic at-risk sets, we compared the LOS using the transition hazards in a multistate model with transitions from hospital admission to infection and discharge. Reference Allignol, Schumacher and Beyersmann18,Reference Allignol, Schumacher and Beyersmann19 Confidence intervals of attributable LOS were calculated by estimating the standard error by drawing 100 bootstrap samples in each of the 5 augmented data sets.
HAIs that were already present at admission had to be treated separately because the dates of onset were missing. To infer the attributable LOS for such patients, we matched patients with an HAI at admission to patients without an HAI at admission according to age, McCabe score, surgery, and time from admission to PPS.
We followed the STROBE guidelines for cross-sectional studies in reporting our findings. Reference Von Elm, Altman and Egger20
Simulations
Because the use of imputation for follow-up data and subsequent LOS-weighted regression are novel to the analysis of PPS data, we also applied our methods in an accompanying simulation study to confirm that they are appropriate (Supplementary Material online).
No institutional review board approval was deemed necessary, similar to the ECDC-PPS, given the quality-improvement nature of the survey. Only anonymous patient and ward data were collected and analyzed.
Results
Table 2 expresses the incidence proportions of HAIs, converted from the odds ratios of a pooled mixed-effects, logistic regression model. These proportions are considerably lower than the prevalence proportion of 5.9%. Reference Zingg, Metsini and Balmelli3 This is due to the fact that only HAIs occurring during hospital stay were modelled (prevalence of 4.1%). This excludes HAIs attributed to other hospitals and HAIs present at admission (Fig. 1). Furthermore, incidence proportions were expected to be lower than the prevalence proportions in hospital epidemiology reports. Reference Wolkewitz, Mandel, Palomar-Martinez, Alvarez-Lerma, Olaechea-Astigarraga and Schumacher7 Figure 3 is a geographical illustration of the estimated incidence proportion per hospital. Reference Cheng, Karambelkar and Xie21
Table 2. Incidence Proportions of HAIs

Note. CI, confidence interval; BSI, bloodstream infections; LRI, lower respiratory tract infections; SSI, surgical site infections; UTI, urinary tract infections. Infections are the observed infections, for incidence estimation there are also imputed infections, the number of which varies over the 5 imputed data sets.

Fig. 3. Incidence proportion per hospital. For better viewing see interactive figure in the online supplementary material.
Table 3 explains the etiology of risk factors for HAIs using a multistate model. These risk factors had little effect on the rate of discharge after infection (eg, hazard ratio [HR], 1.21; 95% CI, 0.89–1.63 for ultimately fatal McCabe score). Instead, they influenced the rate of acquiring infection (HR, 1.84; 95% CI, 1.39–2.43) as well as the discharge rate prior to infection (HR, 0.73; 95% CI, 0.66–0.82). These rates are the components that completely determine prevalence and incidence proportions. Reference Wolkewitz, Mandel, Palomar-Martinez, Alvarez-Lerma, Olaechea-Astigarraga and Schumacher7
Table 3. Risk Factor Analysis for the Different Outcomes of the Multistate Model

Note. CI, confidence interval.
Table 4 summarizes the attributable LOS due to HAI. For HAIs present at admission, attributable the LOS was generally shorter than for HAIs developed during hospital stay in our model (Table 5). Our results show that the incidence proportions of HAI increased with age (0.7% for age 0–17 years vs 3.6% for age ≥85 years), McCabe score (1.6% for nonfatal vs 7.8% for rapidly fatal), and hospital size (1.8% for small vs 3.3% for large) but that attributable LOS due to HAI is inversely correlated with the same variables: 4.6 for age 0–17 years vs 4.1 for age ≥85 years; 7.4 for nonfatal vs 5.2 for rapidly fatal McCabe score; 7.4 for small hospitals vs 4.8 for large hospitals.
Table 4. Attributable Length of Stay for HAI Occurring During Hospital Stay

Note. CI, confidence interval; BSI, bloodstream infection; LRI, lower respiratory tract infection; SSI, surgical site infection; UTI, urinary tract infection; NA: not available (model did not converge). Infections are the observed infections, for attributable length of stay estimation there are also imputed infections, the number of which varies over the 5 imputed data sets.
Table 5. Attributable Length of Stay for Healthcare-Associated Infections Present at Admission

Note. CI, confidence interval; BSI, bloodstream infection; LRI, lower respiratory tract infection; SSI, surgical site infection; UTI, urinary tract infection.
Discussion
Using data from the nationwide Swiss PPS in 2017, we estimated the incidence proportion of HAI as well as the attributable LOS in acute-care hospitals. Such estimations usually require complete follow-up information. However, follow-up data were only available for a subsample of patients. Therefore, we present novel statistical methods that allow estimation of these quantities in the PPS setting. To augment the missing follow-up data, we used the steady-state assumption and time-to-event imputation. We used weights in our regression models to account for the length bias inherent in PPS sampling. For inference on the etiology of HAI, we used multistate models to account for the time dynamic of HAI.
To obtain incidence proportions from prevalence data, the conversion formula by Rhame and Sudderth Reference Rhame and Sudderth22 is used most often. However, it is often misused when summary measures from the prevalence sample are taken when instead they should be taken from the underlying hospital population. Reference Mandel and Fluss23 Even when conversion formulas are used correctly, our regression models have the advantage of allowing multivariable adjustment of risk factors.
The largest source of uncertainty for our results stems from the imputation process for the missing follow-up data. Although imputation is a recommended procedure for missing information, here we make heavy use of it because the missing information is, in fact, our primary outcome of interest. To reduce the dependence on a parametric model, we used the distribution of time from admission to PPS to predict the time from PPS to discharge without infection. This method is valid under a steady state and these data were available for all patients in the PPS. To impute follow-up information on infections, we had to extrapolate the 1,714 patients from 3 hospitals (Bülach, Geneva and Zürich) for whom complete data sets were available. The case mix of patients from Bülach, Geneva, and Zürich represented that of the other Swiss hospitals participating in the Swiss PPS. Still, only limited patient data and hospital characteristics were available. However, variables for which data were unavailable, such as reason for hospitalization and treatment, may also be important predictors.
Because steady state is a useful but strong assumption, its applicability should be addressed. The PPS took place between April and June, which, in epidemiological terms, are steady-state periods in hospitals, that is, outside seasonal outbreaks and summer holidays. The ECDC surveillance report also suggests that PPSs should be conducted in May–June or September–October. 24 Furthermore, collecting data over a relatively short time gives further credibility that patient fluctuation as well as their LOS can be assumed to be stable during this period. Along with our visual inspection of the LOS in the follow-up data, we found this assumption to be reasonable.
The results of our study rely on our imputation model, which, like any other model, may be mis-specified. However, in our case it is sufficient for the imputations to be accurate only on average rather than to be accurate for every individual patient because we inferred only average quantities from the augmented data. Using imputation on missing follow-up data is a novel approach to PPS studies. However, our simulation study seems to confirm that this method is feasible for estimating the quantities of interest.
Regarding attributable length of stay, although HAIs generally have a prolonging effect on hospital LOS, they can also have a shortening effect if they lead to a patient dying in the hospital from HAI-related complications. In our analysis, these opposite effects are blended together. This blending does not affect the accuracy of our results; nevertheless, it would be desirable to have separate results dependent on vital status.
Our study has other limitations. First, HAIs at admission could not be considered in the overall model because the dates of infection were not available if the HAI at admission was the reason for hospitalization. Consequently, these infections had to be modeled differently and the resulting incidence was unexpectedly low. Future PPSs will take this shortcoming into account. Second, results for individual HAI types were not always reliable due to low patient numbers, as indicated by rather large confidence intervals. Nevertheless, taking the uncertainty into account, these results can be considered indicative of the burden and cost of each infection type.
We must stress that classical PPS data, as we have encountered here, are not designed to estimate incidence proportions. Rather, we advocate that PPSs collect follow-up information on the included patients. All that is additionally needed is the date of any incident HAI and the end-of-stay date. These 2 additional variables would remove the need for imputing such information as we have done.
We have described a new approach that blends different study designs for investigating HAIs. Classically, prevalence proportions are estimated using cross-sectional studies, but using them to estimate incidence proportions is challenging due to lacking prospective information and due to length-biased sampling. Prospective cohort designs, on the other hand, while suitable for incidence proportions estimation, are often unfeasible for hospital-wide HAI surveillance on all HAI types due to resource limitations. A strength of our approach is that the methods presented here are not entirely new; their application in the context of PPS data is novel, however. Therefore, these methods are readily available to other researchers. Our approach of taking a PPS data set, collecting prospective information of a subsample to augment the prospective data for the entire sample, is thus a useful approach for obtaining better estimations of incidence proportions and attributable LOS.
Supplementary material
To view supplementary material for this article, please visit https://doi.org/10.1017/ice.2021.295
Acknowledgments
Financial support
This work was supported by the Swissnoso network members: Carlo Balmelli,Marie-Christine Eisenring, Stephan Harbarth, Jonas Marschall, Didier Pittet, Hugo Sax, Matthias Schlegel, Alexander Schweiger, Laurence Senn, Nicolas Troillet, Andreas Widmer and Giorgio Zanetti.
Conflicts of interest
The authors declare no conflict of interest in the context of the content of this manuscript.