


Central line-associated bloodstream infection (CLABSI) is a serious healthcare-associated infection (HAI) that carries an attributable mortality of 12%–25%.Reference Scott 1 , Reference O’Grady, Alexander and Burns 2 Each CLABSI episode increases average hospital length of stay by an estimated 14 days and raises costs associated with hospitalization by US$32,000–$45,814.Reference Chopra, Olmsted, Safdar and Saint 3 – Reference Zimlichman, Henderson and Tamir 5 Given the clinical and economic burden of CLABSI, it has been the focus of scientific enquiry, public reporting, and national performance measurement. CLABSI is designated a tier 1 preventable infection by the US Department of Health and Human Services, a category denoting the highest prevention priority among HAIs. 6 Recent data suggest that much progress has been made in reducing national rates of CLABSI as a result of myriad efforts. 7
Despite this progress, success of an individual institution in reducing CLABSI remains highly variable.Reference Render, Hasselbeck and Freyberg 8 One reason for this inconsistency may relate to challenges in measuring CLABSI. Multiple studies have reported variation in CLABSI rates based solely on the definition used and measurement practices.Reference Cherifi, Mascart and Dediste 9 , Reference Worth, Brett, Bull, McBryde, Russo and Richards 10 With recent definition changes to CLABSI measurement, this variability is likely to persist.Reference Corley, Cantara, Gardner, Trexler, Rock and Maragakis 11 Importantly, inconsistency in performance measurement is not limited to CLABSI; rather, it is well described with a number of other quality metrics.Reference Austin, McGlynn and Pronovost 12 – Reference Ryan and Blustein 16 Unfortunately, the mechanisms for inconsistency in performance measurement, and how these can be improved, are not well understood.
A second explanation for variation in CLABSI reduction is limited comprehension of CLABSI-related data and reports. Indeed, methods of reporting quality metrics such as CLABSI have had little formal cognitive testing.Reference Austin, McGlynn and Pronovost 12 Thus, whether CLABSI data are interpreted correctly and are actionable by end users remains unknown. A recent Twitter-based study of clinicians found that understanding of CLABSI metrics was highly variable, with comprehension decreasing as risk-adjusted data and concepts related to implementing reports were introduced.Reference Govindan, Chopra and Iwashyna 17 If CLABSI experts experience similar difficulties, a stronger case to revisit data presentation and reporting may exist.
Therefore, we performed a survey-based study to evaluate (1) how well experts interpret CLABSI performance data and (2) opinions regarding reliability and challenges related to these metrics.
METHODS
The development of a CLABSI comprehension assessment has previously been described in detail.Reference Govindan, Chopra and Iwashyna 17 In brief, we utilized a broad, exploratory approach to develop a survey instrument to evaluate comprehension of CLABSI data. The methodology included literature review, survey development, and instrument refinement. Individual items within the assessment were constructed through an iterative process with pilot testing among clinicians. We divided questions into 2 categories: those pertaining to non–risk-adjusted data (eg, unadjusted metrics) and those pertaining to risk-adjusted outcomes (eg, adjusted metrics). For the survey, a contemporary, published CLABSI performance report was adapted from Rajwan et al,Reference Rajwan, Barclay, Lee, Sun, Passaretti and Lehmann 18 who qualitatively validated the format using physician feedback (see Supplement online). The assessment underwent cognitive testing within a cohort of 8 hospitalists and intensivists outside the sampling frame to ensure appropriate internal validity (eg, comprehension, retrieval, and judgment).Reference Collins 19 Feedback from infection prevention experts regarding the content of the assessment was also solicited to ensure external validity. The instrument was refined based on feedback and psychometric analysis to a 10-item assessment of CLABSI data comprehension.
Assessment of CLABSI Interpretation in Experts
The survey was deployed to members of the Society for Healthcare Epidemiology of America (SHEA) Research Network (SRN), an international consortium of more than 100 hospitals dedicated to preventing HAIs. Members of the SRN include infection prevention experts, hospital epidemiologists, and infectious disease physicians. We sent 3 email solicitations to the members for recruitment, and no incentives were provided. SurveyMonkey served as the electronic platform for survey distribution and data collection, and question order was randomized. The primary outcome was the percentage of correctly answered questions. Secondary outcomes included percent correct on questions related to unadjusted data and percent correct on question related to risk-adjusted data. A priori, information was collected regarding respondent education, years in practice and in the SRN, country of residence, and number of hospital beds in the respondent’s home institution.
Qualitative Assessment of Expert Opinions
In addition to quantitative assessment, we subjectively evaluated the perceptions of experts regarding CLABSI data. The first question asked, “In your opinion, how reliable are quality metric data about CLABSI?” The scale was 0 to 100 (0, never; 100, always). Experts were also asked, “In your opinion, what are the 3 biggest problems for reliability of quality metric data at your hospital?” Independently, 2 study authors (S.G. and B.W.) reviewed all responses and used inductive analysis to identify key themes gleaned from expert responses.Reference Boyatzis 20 A code book was created to identify themes that were then reconciled and ratified in a series of meetings by both authors. The reviewers coded 10% of the responses and resolved any differences to ensure consistency. The authors independently categorized all responses into 1 of 1 themes, allowing for a primary and secondary theme when deemed necessary. Any disagreements in coding were reconciled by a third author (V.C.). This ensured reliability through comparison of data coding by multiple members of the research team.Reference Silverman 21
Statistical Analysis
Descriptive statistics were calculated for all demographic variables. The primary outcome was evaluated as a dichotomous variable for each question (correct vs incorrect response) and as a continuous variable when assessing mean percent correct on the overall assessment. The Kolmogorov-Smirnov and Shapiro-Wilk tests were used to evaluate normality of continuous variables. We assessed for associations with demographics via t tests, Pearson correlations, or Spearman correlations. Comprehension of unadjusted data was compared to risk-adjusted data using Wilcoxon signed-rank test. We tested for an association between comprehension and perceived reliability of quality metric data using Pearson correlation coefficient.
Analyses were conducted in STATA MP software version 14.0 (StataCorp, College Station, TX); P<.05 was considered statistically significant. No adjustments were made for multiple comparisons. The study was designated exempt by the Institutional Review Board of University of Michigan (no. HUM0012090).
RESULTS
Of 132 eligible participants, 67 SHEA SRN members responded (response rate, 51%), and 54 respondents (41% of total sample) attempted all questions on the assessment. Doctors comprised 81% (n=48) of the cohort, while the remainder included infection control nurses and epidemiologists (Table 1).
TABLE 1 Respondent Characteristics and Associations with ComprehensionFootnote a

NOTE. SRN, Society for Healthcare Epidemiology of America (SHEA) Research Network; SE, standard deviation.
a N=67; not all respondents answered each demographic question.
b The 2-sample t test was used to measure associations regarding both country and profession. Continuous variables underwent testing to assess for normal distribution via Kolmogorov-Smirnov and Shapiro-Wilk tests. Based on these results, Spearman’s Rho or Pearson’s correlation assessed for an association with comprehension.
Interpretation of CLABSI Data
Overall, the mean percent correct on the assessment was 73% (95% CI, 69%–77%). No significant association was observed between performance on the survey and respondent demographics such as education, years in practice, and hospital size (Table 1). However, some questions were answered correctly more often than others—with a range of 38% to 92% for correct answers (Table 2).
TABLE 2 Complete List of Questions with Respondent Performance
When evaluating responses to questions that presented unadjusted data, mean percent correct was 86% (95% CI, 81%–90%). There were 4 questions in this category, with a performance range of 73%–92%. For example, when presented with data regarding CLABSI incidence and asked, “Which hospital has the lowest CLABSI rate?” 90% of respondents answered correctly. Conversely, when asked, “If hospital A doubled its central-line use but other practice patterns remained the same, how many actual infections would hospital A expect to have?” only 73% of respondents answered correctly.
For questions related to interpretation of risk-adjusted data, the average percent correct was significantly lower than for unadjusted data (65%; 95% CI, 60%–70%; P<.001) (Figure 1). The range of percent correct responses for risk-adjusted data varied from 38% to as high as 85%. For example, when asked, “If hospital B had its number of projected infection halved, what is its SIR?” 70% of respondents answered correctly. However, when asked, “Suppose hospitals A and H have the exact same CLABSI prevention practices. Which hospital will have the higher number of CLABSI?” only 48% of respondents answered correctly. Responses and explanations for each question can be found in the Supplement online.
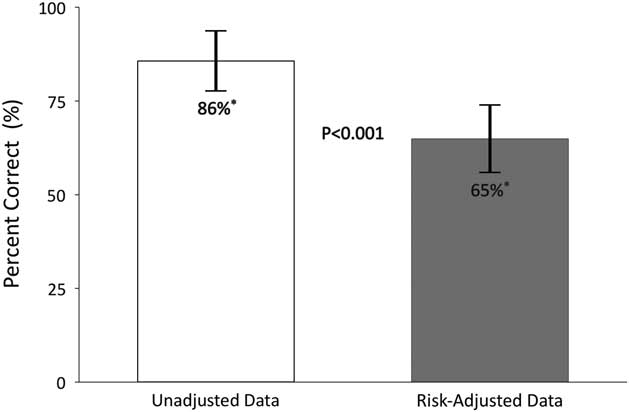
FIGURE 1 Performance of experts on risk-adjusted versus unadjusted CLABSI data. Questions are divided into 2 categories: Unadjusted data (those pertaining to non-risk-adjusted data, eg, unadjusted metrics) and risk-adjusted data (those pertaining to risk-adjusted data, eg, adjusted metrics). CLABSI, 73% (95% CI, 69%–77%); unadjusted, 86% (95% CI, 81%–90%); risk adjusted, 65% (95% CI, 60%–70%).
Perceptions Regarding CLABSI Data
When asked, “In your opinion, how reliable are quality metric data about CLABSI?” the average score was 61 (0, never; 100, always; 95% CI, 56–67). While no respondent demographics were statistically associated with this response, perceived reliability showed a significant, inverse relationship with comprehension (r=−0.28 P=.03). That is, the better a respondent appeared to comprehend the data, the less likely they thought the data were reliable (Figure 2).
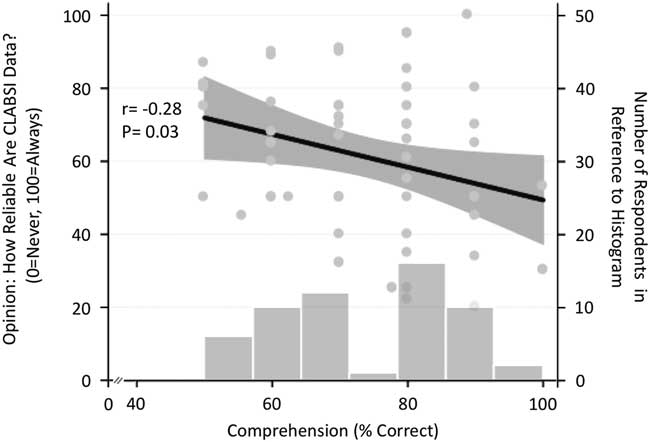
FIGURE 2 Comprehension of CLABSI data is associated with perceptions on how reliable CLABSI data are. A histogram of comprehension is also shown. Respondents were asked: “In your opinion, how reliable are quality metric data about CLABSI?” 95% confidence intervals are shown in grey.
A total of 131 responses to the question, “In your opinion, what are the 3 biggest problems for reliability of quality metric data at your hospital?” were provided. Overall, 51 experts provided at least 1 response, 45 experts provided 2 responses, and 35 experts provided 3 responses. A full listing of the responses can be found in the Supplement online. Each response was categorized into 8 themes related to concerns about quality metric data (Table 3). Experts listed definition defects as the most common theme. For example, many respondents expressed “difficulty with applying surveillance definitions” as a main problem. In order of frequency, the next 2 recurring themes were information bias, such as errors in counting central line days, and concerns regarding risk-adjustment, including “inadequate risk-adjustment” or “risk-stratification.”
TABLE 3 Concerns for Experts Regarding Quality Metric Data: Themes and Example ResponsesFootnote a
a Total no. of responses, 131.
DISCUSSION
This survey of SRN members found significant variability in how infection control experts performed when asked to evaluate and interpret CLABSI metrics. As in the case of nonexperts,Reference Govindan, Chopra and Iwashyna 17 expert respondents in this study also performed significantly lower when presented with risk-adjusted data versus unadjusted data. While no measured demographic factors were associated with performance, we noted that perceived reliability of CLABSI metrics was inversely correlated with performance. Experts also expressed concerns regarding the reliability of quality metric data, principal among them difficulties in understanding and applying definitions to cases, as well as concerns regarding adequacy or transparency of risk adjustment. These findings have important implications for public policy efforts that seek to leverage quality metric data to preventing HAIs such as CLABSI.
While substantial progress in CLABSI has been made, 7 thousands of cases still occur in the United States each year. 22 Despite being one of the most costly HAIs,Reference Zimlichman, Henderson and Tamir 5 between 65% and 70% of cases of CLABSI are potentially preventable.Reference Umscheid, Mitchell, Doshi, Agarwal, Williams and Brennan 23 In an effort to move the needle, CLABSI outcomes continue to be publicly reported, linked to performance measurement, and tied to reimbursement.Reference Pronovost, Goeschel and Wachter 24 However, inconsistent interpretation of data within an expert population should cause concern about this paradigm. The inherent complexity of how the data are shared, presented, and interpreted might weaken the usefulness of CLABSI reporting in its current state. Supportively, the top 3 categories of expert concerns, accounting for >82% of all responses, highlighted complexities and/or deficiencies of the data fed back to hospitals. Future studies are needed to define which aspects of quality metric data are most challenging and how these may be mitigated. With ongoing changes to definitions and recalibration of what may or may not “count” as an infection,Reference Corley, Cantara, Gardner, Trexler, Rock and Maragakis 11 , 25 this issue should be prioritized among policy makers.
Given that performance measures like CLABSI are increasing in influence,Reference Austin, McGlynn and Pronovost 12 experts should not ignore the challenge associated with summarizing, sharing, and acting on data. Data collection and processing is perhaps only half the battle; data delivery and messaging must also be considered. In this context, important lessons from the patient decision-making literature are relevant.Reference Fagerlin, Zikmund-Fisher and Ubel 26 , Reference Hesse, Beckjord, Rutten, Fagerlin and Cameron 27 The method of delivering data to patients has been shown to impact both objective decision-making and subjective perceptions.Reference Fagerlin, Wang and Ubel 28 – Reference Hawley, Zikmund-Fisher, Ubel, Jancovic, Lucas and Fagerlin 30 For instance, Halvorsen et al.Reference Halvorsen, Selmer and Kristiansen 29 showed a 24% difference in patient consent rates to receive a cardiovascular medication based only on altering how the data are displayed. Hawley et alReference Hawley, Zikmund-Fisher, Ubel, Jancovic, Lucas and Fagerlin 30 demonstrated that data presentation impacts patient knowledge of clinical information, and that increased knowledge was associated with making a superior treatment choice. It is plausible, then, that similar effects may also apply to stakeholders within the performance measurement world.Reference Austin, McGlynn and Pronovost 12 Future studies to test different modalities of data delivery and messaging related to performance measurement are needed.
Our study has several limitations. First, this is a survey-based project limited to a select group of expert providers; thus, generalizability to other quality measures, conditions, or providers may be limited. As with all surveys, nonrespondent bias may have influenced our findings. However, our response rate is comparable to other surveys within this sample of medical experts.Reference Drees, Pineles, Harris and Morgan 31 , Reference Masnick, Morgan and Wright 32 Second, we are unable to assess whether differences in interpretation are related to the survey instrument and how data were shown or to factors such as provider knowledge or experience. As the instrument underwent rigorous development, pilot testing, dissemination to other physicians and input from experts, we believe our results reflect clinician uncertainty when interpreting these data.Reference Govindan, Chopra and Iwashyna 17 Finally, we could not evaluate whether interpretation or subjective perceptions of CLABSI data affect downstream outcomes, such as CLABSI rates. Only future studies that measure these outcomes can assess this perspective.
However, our study has several strengths. First, we drew a sample from a population of infection prevention experts. Although we expected experts to consistently interpret CLABSI data across a range of questions, we did not find this to be the case. These findings are not only relevant not only to CLABSI but also to other quality improvement initiatives where deficiencies in data interpretation and application may blunt impact. Second, we employed both quantitative and qualitative methods to assess performance and impressions related to CLABSI reporting. This approach allows for a deeper perspective in defining barriers to understanding CLABSI data.Reference Creswell, Plano Clark and Smith 33 Finally, our results are novel and indicate that cognitive decision making might be highly relevant in the quest to make performance measures more effective. Future studies that test different methods to deliver these data and outcomes appear necessary.
Performance measurement is a fundamental component of quality improvement. Without effective performance feedback, stakeholders are flying blind as they combat HAIs such as CLABSI.Reference Purbey and Bha 34 , Reference Alvero, Bucklin and Austin 35 However, these measures have grown increasingly complex because of the efforts to standardize performance via risk adjustment.Reference Loeb 36 It is now unclear whether these painstakingly collected measures actually provide actionable feedback for decision makers.Reference Austin, McGlynn and Pronovost 12 , Reference Chassin, Loeb, Schmaltz and Wachter 37 It is vital that policy experts understand how to account for data complexity in the delivery of quality measures as feedback agents. Without attention to such change, performance measures may remain unreliable or ineffective in motivating clinicians to change practice.
ACKNOWLEDGMENTS
The views expressed here are the authors’ own and do not necessarily represent the view of the US Government or the Department of Veterans Affairs.
Financial support: This work was supported by the Veterans Affairs Health Services Research and Development Service (grant no. IIR-13-079 to T.J.I.) and the National Institutes of Health (grant no. T32-HL007749 (S.G.). V.C. is supported by a career development award from the Agency of Healthcare Research and Quality (grant no. 1-K08-HS022835-01).
Potential conflicts of interest: All authors report no conflicts of interest relevant to this article.
SUPPLEMENTARY MATERIAL
To view supplementary material for this article, please visit https://doi.org/10.1017/ice.2017.243


