Antimicrobial stewardship programs (ASPs) aim to optimize antibiotic prescribing to improve patient outcomes and reduce unnecessary antimicrobial use. 1 Measuring antimicrobial use is central to evaluating an ASP’s effectiveness and identifying targets for intervention.Reference Barlam, Cosgrove and Abbo 2
Antimicrobial use in hospitalized patients is typically assessed by volume, most commonly using days of therapy per 1,000 patient days (DOT/1,000 PD).Reference Moehring, Anderson, Cochran, Hicks, Srinivasan and Dodds Ashley 3 DOT, however, does not assign value to the antimicrobial spectrum of drug exposure. For example, a hospital whose patients receive 500 DOT/1,000 PD of mostly narrow-spectrum antibiotics (eg, ampicillin for pneumonia) would appear the same as a hospital using 500 DOT/1,000 PD dominated by broader-spectrum agents (eg, cefepime for pneumonia). Similarly, a quality improvement initiative that narrows the spectrum of coverage for perforated appendicitis from meropenem to ceftriaxone plus metronidazole would result in higher DOT/1,000 PD. Because volume of prescribing and spectrum might not be highly correlated, a complementary metric capable of assessing the antimicrobial spectrum of composite antimicrobial use would provide an additional dimension to the evaluation of ASP activities and their impact.
To address this gap, we developed an antibiotic spectrum index (ASI) designed to measure and compare the relative breadth of antibiotic spectrum used in hospitals. We then applied this novel metric, in conjunction with DOT, to characterize and compare antibiotic use across US children’s hospitals.
METHODS
Development of Antibiotic Spectrum Index
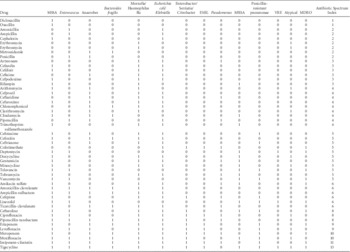
A group of 4 infectious diseases clinicians with expertise in antimicrobial stewardship practice and research (J.S.G., A.L.H., M.P.K., J.G.N.) and 1 ASP clinical pharmacist (T.A.M.) independently classified antibiotics, assigning each a point value based on spectrum of activity against clinically relevant pathogens (Table 1). Discrepancies between raters were resolved through review of published data, pharmacy databases (eg, Lexicomp), and iterative discussion until consensus was achieved. One point was given for activity against each of the following pathogens: methicillin-sensitive Staphylococcus aureus (MSSA), methicillin-resistant S. aureus (MRSA), Enterococcus faecalis, vancomycin-resistant Enterococcus faecalis (VRE), Escherichia coli and Klebsiella, ampC producers, extended-spectrum β-lactamase (ESBL) E. coli/Klebsiella, Pseudomonas aeruginosa, penicillin-resistant pneumococcus (PRP), Moraxella and Haemophilus influenzae, Mycoplasma and Chlamydophila, anaerobes (1 point; 2 points for Bacteriodes fragilis). Multidrug-resistant organism (MDRO)–active agents received an additional point, so the overall ASI for each agent could range from 0 to 14 points. For example, vancomycin received 1 point each for MSSA, MRSA, E. faecalis, PRP, and MDRO (ASI=5), whereas oxacillin received 1 point only for MSSA (ASI=1). To obtain an aggregate ASI for a patient on a single day, the ASI of all antibiotics prescribed were summed. Thus, a patient receiving both vancomycin and piperacillin-tazobactam (ASI=8) on the same day results in a total daily ASI=13.
TABLE 1 Antibiotic Spectrum Index Matrix

NOTE. MSSA, methicillin-sensitive staphylococcus aureus; ESBL, extended-spectrum β-lactam; MRSA, methicillin-resistant staphylococcus aureus; VRE, vancomycin-resistant enterococci; MDRO, multidrug-resistant organism.
Antibiotic Spectrum Index by Condition
To illustrate how the index can vary by condition and identify conditions for potential stewardship intervention, we summarized ASI by condition using all patient refined-diagnosis related groups (APR-DRG). Data were obtained from the Pediatric Health Information System (PHIS), a database of freestanding US children’s hospitals and included inpatient and observation patients <18 years old, discharged in 2013 from 1 of 44 hospitals, who also received a systemic antibiotic. We calculated the ASI per patient day among patients who received any antibiotic.
Application to Community-Acquired Pneumonia (CAP)
Our goal was to develop a metric capable of measuring the variability in antibiotic use across institutions as well as the potential impact of interventions to improve antibiotic use. Therefore, we applied the metric in 2 different ways, using CAP as an example because it is the most common indication for antibiotics in US children’s hospitals.Reference Gerber, Kronman and Ross 4 Using the PHIS database, we included children 6 months to 17 years old treated with systemic antibiotics for CAP.Reference Ross, Hersh and Kronman 5
First, we conducted a cross-sectional analysis of children discharged in 2013 to illustrate how the ASI can be used to characterize antibiotic use for pneumonia by hospital and to compare the ASI per antibiotic day to DOT/1,000 PD. To obtain estimates standardized by sex and age category (ie, <5 years old, 5–11 years old, ≥12 years old), we fit Poisson models with offset of patient days or antibiotic days as appropriate with hospitals included as fixed effects.
Second, we conducted a longitudinal analysis to examine how the ASI was impacted by a stewardship intervention specifically designed to address overuse of broader-spectrum antibiotics. We used a previously published intervention designed to increase ampicillin prescribing instead of broader-spectrum agents (eg, ceftriaxone) for CAP, implemented by an ASP at a freestanding children’s hospital.Reference Newman, Hedican, Herigon, Williams, Williams and Newland 6 Using a longitudinal piecewise Poisson model with a knot at the intervention, we modeled the trajectory of prescribing (DOT/1,000 PD and ASI per antibiotic day) before and after the intervention, controlling for sex and age category.Reference Fitzmaurice and Laird 7
RESULTS
Antibiotic Spectrum Index by Condition
In 2013, 352,396 children received systemic antibiotics on 1,626,071 patient days (antibiotic days). The mean ASI per antibiotic day was 5.7 (standard deviation, 3.0). Among conditions previously identified with high antibiotic DOT,Reference Gerber, Kronman and Ross 4 the mean ASI per antibiotic day distinguished conditions by type of use (narrow: 5.6 SSTI, 6.3 pneumonia; medium: 7.9 appendectomy; broad: 10.3 bone marrow transplant, 13.8 cystic fibrosis).
Application to Community-Acquired Pneumonia
We identified 9,602 children with CAP discharged in 2013. Plotting ASI per antibiotic day with DOT/1,000 patient days revealed an added dimension of the variability in antibiotic use across hospitals (Figure 1A). Here, DOT/1,000 PD and ASI were poorly correlated (r=0.16). Examining the impact of an ASP intervention targeting children with CAP revealed no change in the DOT/1,000 PD, but a change in ASI per antibiotic day was observed (Figure 1B).

FIGURE 1 Comparison of days of therapy (DOT) and antibiotic spectrum index (ASI) of antibiotic use for treatment of community-acquired pneumonia (CAP). Panel A: Comparison across 44 hospitals. Each dot is a hospital. Dashed lines represent median hospital value. An antibiotic day is a patient day with a systemic antibiotic. Panel B: Impact of an antimicrobial stewardship intervention on antibiotic treatment at a single hospital. On the left y-axis, black line and black dots represent the fitted and raw values, respectively, ASI per antibiotic day. On the right y-axis, dashed line and white diamonds represent the fitted and raw values, respectively, DOT per 1,000 PD. Abbreviation: PD, patient days.
DISCUSSION
We classified systemic antibiotics using an index based on spectrum of activity against clinically relevant pathogens. The ASI revealed variability in antibiotic use across hospitals and was sensitive to changes in antibiotic selection in ways not detectable using the standard ASP metric, DOT/1,000 PD. The ASI highlights a new opportunity to benchmark antibiotic use and to assess the impact of ASP interventions alongside the more commonly used DOT/1,000 PD.
The ASI addressed elements of the more complex algorithm developed by Madras-Kelly et al,Reference Madaras-Kelly, Jones, Remington, Hill, Huttner and Samore 8 the pragmatic 5-category approach taken by Stenehjem et al,Reference Stenehjem, Hersh and Sheng 9 and the antibiotic groupings in the CDC AUR module 10 to generate a novel scoring system that is simple, objective, and discriminatory. When plotted alongside DOT, ASI revealed an added dimension of variability in composite antibiotic use across hospitals. When applied to a specific inpatient ASP intervention (narrowing therapy for CAP),Reference Newman, Hedican, Herigon, Williams, Williams and Newland 6 the ASI revealed a change in prescribing behavior not evident using DOT. Similarly, in the previously described change of appendicitis therapy from meropenem to ceftriaxone/metronidazole, the DOT doubled while the ASI dropped from 10 to 7. Thus, the ASI can be applied to a specific diagnosis, patient population, or an entire center to assess antibiotic use.
The ASI has limitations. This approach scores coverage of different pathogens similarly (eg, mycoplasma and MRSA each receive 1 point) and dichotomously (“yes” or “no” instead of specific proportion). Furthermore, the ASI has not been validated to reflect adverse clinical outcomes that drive the preference for using narrower-spectrum agents, including antibiotic resistance, Clostridium difficile infection, and disruption of the host microbiome. Lastly, the analysis focused on antibiotic prescribing in children’s hospitals; however, this metric can be applied broadly to all settings and populations.
In conclusion, the application of an antibiotic spectrum index generates expected patterns based on antibiotic choices across conditions, facilitates interhospital benchmarking and comparisons, and can be used in conjunction with DOT/1,000 PD to identify important clinical targets for antimicrobial stewardship.
ACKNOWLEDGMENTS
Financial support: No financial support was provided relevant to this article.
Potential conflicts of interest: All authors report no conflicts of interest relevant to this article.