


National reimbursement policies seek to align quality and cost and reduce preventable harm, including healthcare-associated infections (HAIs). The success of these policies depends on reliable metrics. Administrative claims data are commonly used to track HAIs and other healthcare-associated conditions given their convenience, but they are limited by variable coding practices and the potential influence of changing reimbursement policies.Reference Stevenson, Khan and Dickman 1 As a result, federal value-based incentive programs (VBIPs) incorporate HAI rates reported to the National Healthcare Safety Network (NHSN) in determinations of hospital performance.
However, the Centers for Medicare and Medicaid Services (CMS) Hospital-Acquired Conditions Present-on-Admission programs still rely on claims-based billing codes. Furthermore, public reporting and VBIPs continue to depend on claims-based metrics for non-HAI outcomes. In 2019, VBIPs and the Hospital Inpatient Quality Reporting program will incorporate 5 and 31 claims-based metrics, respectively. 2
Examining HAI data can provide an important window into the strengths and limitations of using administrative data to determine hospital performance given the presence of an alternate, prospectively collected data source. Although prior work has suggested poor concordance between HAIs identified by administrative data and NHSN case definitions,Reference Stevenson, Khan and Dickman 1 , Reference Zhan, Elixhauser and Richards 3 , Reference Harris, Gay, Neff, Patrick and Sedman 4 little is known about the potential impact of these different surveillance methods on calculated hospital rankings.
In this study, we examined differences in hospital rankings computed using claims versus NHSN data. We focused on surgical site infection following colon surgery (SSI-colon) as a case example to maximize power given that surgical volume and SSI incidence are higher for SSI-colon than for other procedures. We used data from 2012–2014 to ensure a time window free from the influence of reimbursement policies or NHSN case definition changes. We hypothesized that concordance would be poor between the 2 data sources, which could underscore the challenges in measuring hospital quality using administrative data.
Methods
This retrospective cohort study included adult patients admitted to 155 non-federal acute-care hospitals in 7 states that shared NHSN data through the Preventing Avoidable Infectious Complications by Adjusting Payment (PAICAP) study. We included admissions in calendar years 2012–2014 from PAICAP hospitals that could be linked to administrative data from the State Inpatient Databases, Healthcare Cost and Utilization Project. Hospital characteristics were obtained from the 2011 American Hospital Association Annual Survey.
We identified colon surgery procedures and SSIs using NHSN data, or using claims data with the following previously validated International Classification of Diseases, Ninth Revision, Clinical Modification (ICD-9-CM) codes: 54.0, 54.11, 54.19, 86.04, 86.22, 86.28, 567.21, 567.22, 567.29, 567.38, 569.5, 569.61, 569.81, 682.2, 879.9, 998.31, 998.32, 998.51, 998.59, and 998.6.Reference Letourneau, Calderwood, Huang, Bratzler, Ma and Yokoe 5 The NHSN limits SSI reporting to 30 days post procedure. For claims, we included SSI codes not present-on-admission (POA) from the index surgical hospitalization, or from any subsequent hospitalizations within the same or following month (POA or non-POA). We aggregated hospital annual SSI rates and performed reliability adjustment to account for differential surgical volumes across hospitals using random-effects logistic regression.Reference Dimick, Staiger and Birkmeyer 6
We examined the agreement of hospital rankings using Kendall’s τ coefficient, which tests the ordinal association between 2 measures, and we compared quartiles of hospital rankings using billing or NHSN data. We considered a τ of < 0.40 as poor agreement, 0.41–0.75 as fair–good agreement, and >0.75 as excellent agreement.
We explored the association of hospital characteristics with a ≥2 quartile difference in NHSN versus claims-based rankings using a generalized linear mixed model. This model included the following data: region, urbanicity, number of beds, teaching status, nurse-to-patient ratio, hospital ownership, percentage of admissions covered by Medicaid or Medicare, and colon surgery volume.
Analyses were completed using SAS version 9.4 software (SAS Institute, Cary, NC) and R version 3.3.1 software (r-project.org). We considered P values < .05 to be significant. The Harvard Pilgrim Health Care Institutional Review Board approved this study.
Results
The study cohort included 6.2 million adult admissions from 2012 to 2014 in 155 hospitals. The hospital characteristics are shown in Table 1. There were 63,541 colon surgeries (median, 116 per hospital-year; interquartile range [IQR], 64–195) with 7,197 claims-based SSIs (median, 12 per hospital-year; IQR, 5–23) and 3,283 NHSN-reported SSIs (median, 5 per hospital-year; IQR, 1–10).
Table 1 Study Hospital Characteristics

Note. IQR, interquartile range.
a Teaching status was classified as per the American Hospital Association survey: major teaching hospitals (those that are members of the Council of Teaching Hospitals [COTH]), graduate teaching hospitals (non-COTH members with a residency training program approved by the Accreditation Council for Graduate Medical Education), minor teaching hospitals (non-COTH members with a medical school affiliation reported to the American Medical Association), and nonteaching hospitals (all other institutions).
Hospital annual SSI rates were higher with claims versus NHSN data (median, 10.5% vs 4.3%). There was poor agreement between hospital claims versus NHSN-based SSI rankings (Kendall’s τ, 0.21). Over the 3-year period, 64 of 99 hospitals (65%) in the best quartile by claims data were ranked in worse quartiles by NHSN data; similarly, 60 of 99 hospitals (61%) in the worst quartile by claims data were ranked in better quartiles by NHSN data (Figure 1).
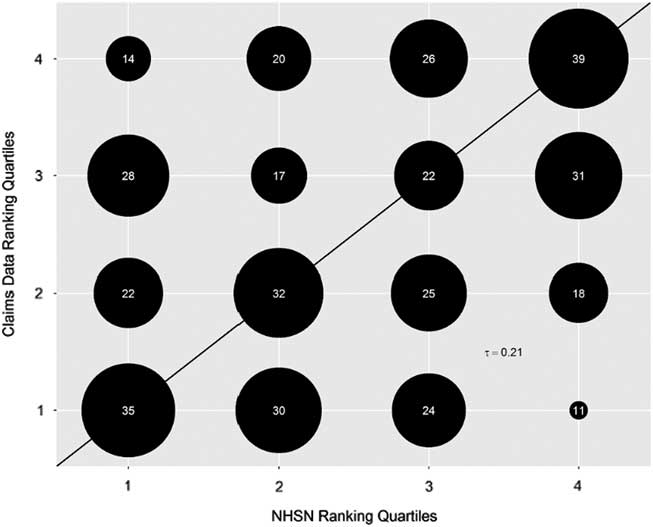
Fig. 1 Bubble plot of hospital rankings by quartiles for rates of surgical site infection after colon surgery by National Healthcare Safety Network data versus claims billing data (2012–2014 combined). Bubble sizes are proportional to the number of hospitals in each matched quartile. The actual number of hospitals in each category is denoted within the bubbles. The cohort included 155 hospitals; the total number of hospitals reflected in the graph equals the number of unique hospital years (N = 394) during the study period. Lower quartiles indicate better performance (ie, quartile 1 = lowest SSI rates and quartile 4 = highest SSI rates). The solid line indicates where all hospitals or bubbles would lie if concordance was perfect between claims and NHSN data. Bubbles above the solid line indicate quartiles that are worse by claims versus NHSN data. Bubbles below the dotted line indicate quartiles that are better by claims data versus NHSN data. τ = Kendall’s τ, a measure of the ordinal association between 2 measures (in this case, hospital rankings using NHSN vs claims data). We considered a τ < 0.40 as poor agreement, 0.41–0.75 as fair–good agreement, and >0.75 as excellent agreement.
On multivariate analysis, the only hospital characteristics associated with a difference of ≥2 ranked quartiles between claims versus NHSN rates were higher Medicaid percentage (P = .041) and southern region (P = .038).
Discussion
We found that claims-based rates of SSI-colon were significantly higher than NHSN-based rates. There was poor agreement between hospital rankings derived from the 2 data sources, with >50% of hospitals ranked in the best or worst quartile by claims falling into more moderate quartiles by NHSN data.
The higher SSI rates seen with claims data likely reflects their higher sensitivity compared to NHSN surveillance.Reference Letourneau, Calderwood, Huang, Bratzler, Ma and Yokoe 5 However, claims have lower specificity and may also capture complications, such as cellulitis or suture abscesses, that would not meet NHSN criteria. Other limitations of claims data include variable coding practices, changes in response to reimbursement policies, and misclassification of present-on-admission status.Reference Stevenson, Khan and Dickman 1 , Reference Lee, Hartmann and Graham 7 Prospective NHSN SSI surveillance is more rigorous but can also incorporate subjective criteria and may miss SSIs clinically diagnosed at the bedside.Reference Letourneau, Calderwood, Huang, Bratzler, Ma and Yokoe 5 , Reference Keller, Linkin, Fishman and Lautenbach 8 Prior work suggests that routine surveillance can be enhanced using claims and/or inpatient antibiotic prescribing data.Reference Perdiz, Yokoe, Furtado and Medeiros 9 Automating surveillance using electronic data could also reduce interobserver variation and provide more precise HAI rates.Reference Klompas and Yokoe 10
Hospitals in the southern United States tended to have more discrepancies in SSI rankings, suggesting regional differences in coding or hospital-based surveillance methods. Caring for more Medicaid patients was also associated with ranking discordance, perhaps reflecting differential billing practices or fewer resources to devote to infection surveillance and prevention in hospitals caring for low-income patients.
Our study has several limitations. Our findings on a single outcome in a subset of US acute-care hospitals may not be generalizable. However, the hospitals were diverse with respect to region, size, and teaching status, and the relatively high rates of SSI-colon compared to other HAIs may mitigate the contribution of random variation to discordant claims versus NHSN hospital rankings. We used ICD-9-CM codes, and the degree to which our findings hold true with ICD-10 codes is unknown. We were unable to exactly match the 30-day NHSN SSI time window with claims data because claims data were constrained by month. This limitation may have contributed to some of the discordance between the 2 data sources. We were unable to determine how well NHSN SSIs matched claims codes on a patient-level basis. Lastly, we examined hospital rankings prior to reimbursement policies targeting SSI-colon; additional work is needed to determine whether and how the relationship between claims and NHSN data changes after VBIP implementation.
In conclusion, determinations of hospital SSI-colon rates using claims vs NHSN data are poorly concordant. This underscores the challenges in evaluating hospital quality by administrative data and the need to optimize surveillance methods in the age of public reporting and value-based payment.
Acknowledgements
We thank the hospitals for participating in the Preventing Avoidable Infectious Complications by Adjusting Payment (PAICAP) study that provided data for this analysis: Florida Hospital (Tampa, FL), Mayo Clinic (Jacksonville, FL), Boston Medical Center (Boston, MA), Cooley Dickinson Hospital (Northampton, MA), UMass Memorial HealthAlliance Hospital (Leominster, MA), Cortland Regional Medical Center (Cortland, NY), Kaleida Health (Buffalo, NY), Mohawk Valley Health System (Utica, NY), Norwell Health (New Hyde Park, NY), South Nassau Communities Hospital (Oceanside, NY), Strong Memorial Hospital (Rochester, NY), White Plains Hospital (White Plains, NY), Allenmore Hospital (Tacoma, WA), and Tacoma General Hospital (Tacoma, WA). All other hospitals contributing data wished to remain anonymous. Additionally, we are grateful to the members of the PAICAP Scientific Advisory Board for their guidance and input, including Neil Fishman, MD; Patricia Grant, RN, BSN, MS, CIC, FAPIC; Richard Platt, MD, MSc; and Donald Goldmann, MD.
Financial support
This project was supported by the Agency for Healthcare Research and Quality (grant nos. K08HS025008 to C.R., T32HS000063 to H.E.H., and 2R01HS018414-06 \ to G.M.L). The content is solely the responsibility of the authors and does not necessarily represent the official views of the Agency for Healthcare Research and Quality.
Conflicts of interest
None of the authors have any conflicts to disclose.


