


Healthcare-associated infections (HAIs) represent major patient safety problems, especially in intensive care units (ICUs). The use of invasive procedures, such as intubation or the placement of central venous catheters, always involves some risk of infection. Reference Edwardson and Cairns1 Although a wide range of strategies is available to minimize this risk, Reference Li, Cao, Ge, Jiang, Zhou and Zheng2,Reference Ramsamy, Hardcastle and Muckart3 once an infection by antibiotic-resistant bacteria occurs, difficulties in adequately treating it can have a significant impact on both patient and economic outcomes. Reference Roberts, Hota and Ahmad4–Reference Lambert, Suetens and Savey10
Multiple studies have investigated the association between ICU-acquired infections and mortality or excess length of stay (LOS) of patients. Reference Fernández-Barat, Ferrer and De Rosa7,Reference Martin-Loeches, Torres and Rinaudo11–Reference Magira, Islam and Niederman13 Given that ICU LOS is the best predictor of resource utilization and cost of care, special attention has been given to this outcome. Reference Vrijens, Hulstaert, Devriese and Van de Sande14–Reference Graves, Weinhold and Tong16
However, estimating the attributable LOS of patients with resistant versus susceptible strains of ICU-acquired infections presents several methodological Reference Cassini, Högberg and Plachouras17 and logistic challenges. Reference Serra-Burriel, Keys and Campillo-Artero18 Several well-known biases arise when analyzing the association between multidrug resistance and prolonged LOS outcomes. Reference Nelson, Samore and Jones19–Reference Nelson, Slayton and Stevens22
The time-dependent bias of infection has been suggested to inflate estimates around when time to occurrence is not considered. Furthermore, significant confounding in the form of differential observable and unobservable baseline prognostic factors between patients infected with susceptible and resistant organisms have been reported, which poses a threat to the correct assessment of attributable effects.
The objective of the present study was to estimate the effect of multidrug resistance on excess LOS of ICU-acquired bacterial infections. We emulated an unfeasible target trial Reference Dickerman, García-Albéniz, Logan, Denaxas and Hernán23,Reference Hernán and Robins24 in a sample of southern European ICUs to measure the attributable economic burden associated with an excess of resource utilisation. To overcome the aforementioned biases, we made use of complementary analytical approaches, multivariable regressions, and matching methods. Reference Harrell, Lee and Mark25,Reference Dodd, Bassi, Bodger and Williamson26
Methods
The present study is a multicentric retrospective cohort study of ICU-admitted patients that developed an HAI, combined with economic modelling. Our main hypothesis was that patients infected with resistant organisms have an associated longer LOS thereafter, which often entails increased utilization of resources. Our study also compared different analytical strategies of estimating this association as means to approximate the causal effect of antimicrobial resistance and to explore the potential biases inherent to each model. Reference Nelson, Samore and Jones19 This manuscript was prepared in accordance with the STROBE guidelines for reporting observational studies. The study was approved by the Ethics Committee “Catania 1”, Catania, Italy (protocol nos. 111/2018/PO and 295/2019/EMPO).
Patient population and data source
A cohort based on data from The European Surveillance System (TESSy), provided by Spain, Italy (SPIN-UTI network Reference Agodi, Auxilia and Barchitta27–Reference Agodi, Auxilia and Barchitta29 ), and Portugal and released by European Centre for Disease Prevention and Control (ECDC), was used. Reference Monnet30 The cohort consisted of adult patients admitted to ICUs who developed a HAI during the surveillance period between 2008 and 2016.
Our patient population included adult patients with at least 1 confirmed HAI (ie, bloodstream, catheter-related infection, pneumonia, or urinary tract infection) diagnosed at least 48 hours after ICU admission and with at least 1 of 4 potential invasive procedures performed: central venous catheter (CVC), intubation (INT), parenteral nutrition (PNUT) or a urinary catheter (UC). Only adult patients with confirmed susceptibility testing to selected antimicrobial agents and microorganisms were included in the analysis.
Microbiology and susceptibility definitions
The antibiotic-resistant condition of bacteria was drawn from a 2019 study by Cassini et al, Reference Cassini, Högberg and Plachouras17 which selects specific microorganisms and antibiotic resistance profiles based on public health importance. The microorganism–antibiotic resistance pairings were as follows: third-generation cephalosporin-resistant Escherichia coli, methicillin-resistant Staphylococcus aureus, carbapenem-resistant Pseudomonas aeruginosa, third-generation cephalosporin-resistant Klebsiella pneumoniae, carbapenem-resistant Acinetobacter spp, carbapenem-resistant K. pneumoniae, colistin-resistant K. pneumoniae, vancomycin-resistant Enterococcus faecalis and Enterococcus faecium, colistin-resistant E. coli, penicillin-resistant Streptococcus pneumoniae, penicillin-resistant and macrolide-resistant Streptococcus pneumoniae, carbapenem-resistant E. coli, colistin-resistant Acinetobacter spp, and colistin-resistant P. aeruginosa.
Patients infected by >1 microorganism were classified as resistant if at least 1 of the isolated microorganisms was deemed resistant to at least 1 of the selected antibiotics.
Statistical and economic analyses
Balance across baseline patient characteristics of susceptible and resistant infections was analyzed using unadjusted univariate comparisons. For that purpose, t tests for continuous variables and Fisher exact tests were used with a 2-tailed design, and a statistical significance level of 0.05 was prespecified.
We followed 3 complimentary multivariable estimation strategies with (1) an unadjusted linear specification, Reference Hahn, Carvalho, Puelz and He31 (2) adjusted linear specification, Reference Bithell, Dutton, Neary and Vincent32 (3) genetic 1:1 matching Reference Diamond and Sekhon33 as well as adjusted Cox regression. Reference Lin and Ying34 Genetic 1:1 matching automates a combination of propensity scores and Mahalanobis distance matching for each covariate such that the a version of optimal balance is achieved after matching. Reference Abadie and Imbens35 The selection of control variables was driven by availability of data regarding patient, procedure, and contextual characteristics associated with both resistance and LOS. Variables included in the matching process included: age, sex, time to infection, procedures, and infection site. Each other estimation strategy was replicated with an incremental set of control variables (ie, age, sex, bacteria fixed effects, ICU fixed effects, and time to infection) to assess coefficient stability to assess unobservable selection to resistance. Reference Oster36 Our study included deidentified fixed effects, country, hospital, and ICU. Relevant patient parameters included age, sex, type of exposure, type of infection, and type of microorganism. Moreover, to assess the magnitude of time-dependent bias, Reference van Walraven, Davis, Forster and Wells37 all estimation strategies included at least 1 model specification controlling or matching for time to infection. Uncertainty of estimates was constructed with Huber-White robust standard errors clustered at the ICU level. Reference Freedman38 To assess the robustness of the estimates to resistance unobservable selection, we performed a quantitative bias analysis. Reference Oster36 We also estimated the linear model for the number of antimicrobial-resistant organisms present at the time of infection.
To approximate the attributable economic burden of ICU-acquired resistant infections, we developed a simple economic model relating the excess LOS estimates to direct hospitalization costs. Direct costs were obtained from national price lists and standardized costing methods for ICU stays. Reference Rodrigues and Sousa39–Reference Tan, Bakker and Hoogendoorn41 Costs were adjusted to 2019 euros with country-specific healthcare price indices. 42 All analyses were performed in R version 3.6.2 software (2019). Reference Team43
The study was approved by the Ethics Committee “Catania 1,” Catania, Italy (protocol nos. 111/2018/PO and 295/2019/EMPO).
Results
In total, 18,773 patients with ICU-acquired bacterial infections were assessed for eligibility, and 13,441 were included in the analysis after meeting eligibility criteria: 9,335 patients (69.5%) were infected with antimicrobial-susceptible microorganisms and 4,106 patients (30.5%) were infected with resistant ones. Figure 1 depicts the patient selection flow chart.

Fig. 1. Patient flowchart diagram. *Included microorganisms: Acinetobacter baumannii, Enterobacter cloacae, Enterococcus faecalis, Enterococcus faecium, Escherichia coli, Klebsiella pneumoniae, Pseudomonas aeruginosa, Staphylococcus aureus, and Staphylococcus epidermidis. **Included antimicrobial agents: third-generation cephalosporins (cefotaxim, cetriaxone, ceftazidim), carbapenems (imipenem, meropenem, doripenem), methicillin, and vancomycin.
The mean age of the patients was 62 years (SD ±15.6). Moreover, 65% of patients were from Spanish ICUs, 20% were from Italian ICUs, and 15% were from Portuguese ICUs. In total, 66% of patients were male, and most patients (84%) stayed in mixed ICUs. The most prevalent invasive procedures involved were central venous catheter (97.5% of patients) and intubation (94% of patients). Table 1 shows patient characteristics by the resistance status of bacteria isolated from ICU-acquired infections. On average, patient characteristics, including the type of infection and invasive procedures performed, were different regarding their susceptibility classification. Supplementary Table S1 (online) presents the empirical propensity distribution of organisms by type of infection and antibiotic resistance level in kernel density estimates. After genetic 1:1 matching, 4,106 susceptible patients were included, whereas 5,229 were dropped from the matched analysis. Balance across baseline prognostic factors greatly improved, and only 3 baseline variables were statistically significant different across groups. The right panel of Table 1 presents the distribution of variables after matching. Supplementary Figures S1 and S2 (online) present the propensity score distributions and the standardized bias plots before and after matching.
Table 1. Patient Characteristics by Resistance Status of Bacteria Isolated From ICU-Acquired Infections, Full and Matched Samples

Note. ICU, intensive care unit; SD, standard deviation. To calculate P value, the Fisher exact test was used for categorical variables and the Student t test was used for continuous variables.
The association between resistance status and excess LOS of unadjusted models was 6.998 days (95% CI, 6.130–7.866; P < .001) in the linear regression model, it was 4.076 days (95% CI, 3.001–5.151; P < .001) in the matched analysis, and the hazard ratio (HR) was 1.278 (95% CI, 1.232–1.308; P < .001) in the Cox regression model. Table 2 presents all 3 model estimates. The inclusion of additional control variables (specifications b to d: age, gender, bacteria fixed-effects, hospital-ICU fixed effects, infection site, invasive procedures, and time to infection) yielded a decrease in the association between resistance and excess LOS by 30% for the linear regression model, 20% in the matched model, and 9% in the Cox model. However, the greatest estimate change resulted from the inclusion of time to infection confounding control. Fully adjusted estimates were 2.756 days (95% CI, 1.977–3.535; P < .001) in the linear model and 2.604 days (95% CI, 1.661–3.548; P < .001) in the matched model, and HR was 1.146 (95% CI, 1.101–1.178; P < .001) in the Cox model. Thus, the inclusion of time-to-infection controls reduced the estimates by 61% in the linear model, 35% in the matched model, and 11% in the Cox model.
Table 2. Regression, Matching and Time-to-Event Results

Note. CI, confidence interval, LOS, length of stay; ICU, intensive care unit. Significance:
*** 0.01; ** 0.05; *0.10.
In terms of time to discharge or death, Figure 2 displays the Kaplan-Meier estimates of cumulative incidence. During the first 5 days after ICU admission, no significant differences between resistant and susceptible infection groups were detected. After day 6, the estimates started to diverge, leading to a difference of 2.7 days at median cumulative incidence.

Fig. 2. Kaplan-Meier estimates cumulative time to discharge.
Figure 3 presents the fully adjusted country-specific cumulative incidence estimates of the Cox regression models in the upper panel, while the lower panel illustrates the unadjusted and adjusted cost estimates by country. Adjusting the estimates reduces the attributable burden in all included countries. Unadjusted direct cost estimates (2019) per resistant infection for Spain are 13,855€ [16,008USD] (95% CI, 12,148–15,562), 6,518€ [7,531USD] (95% CI, 3,903–9,133) for Italy, and 7,301€ [8,435USD] (95% CI, 4,053–10,548) for Portugal. However, when fully adjusted for all baseline characteristics, all estimates are reduced, with 5,224€ [6,036USD] per resistant infection (95% CI, 3,691–6,756) for Spain, 4,461€ [5,154USD] (95% CI, 1,948–6,973) for Portugal, and 4,320€ [4,991USD] (95% CI, 1,662–6,977) for Italy.
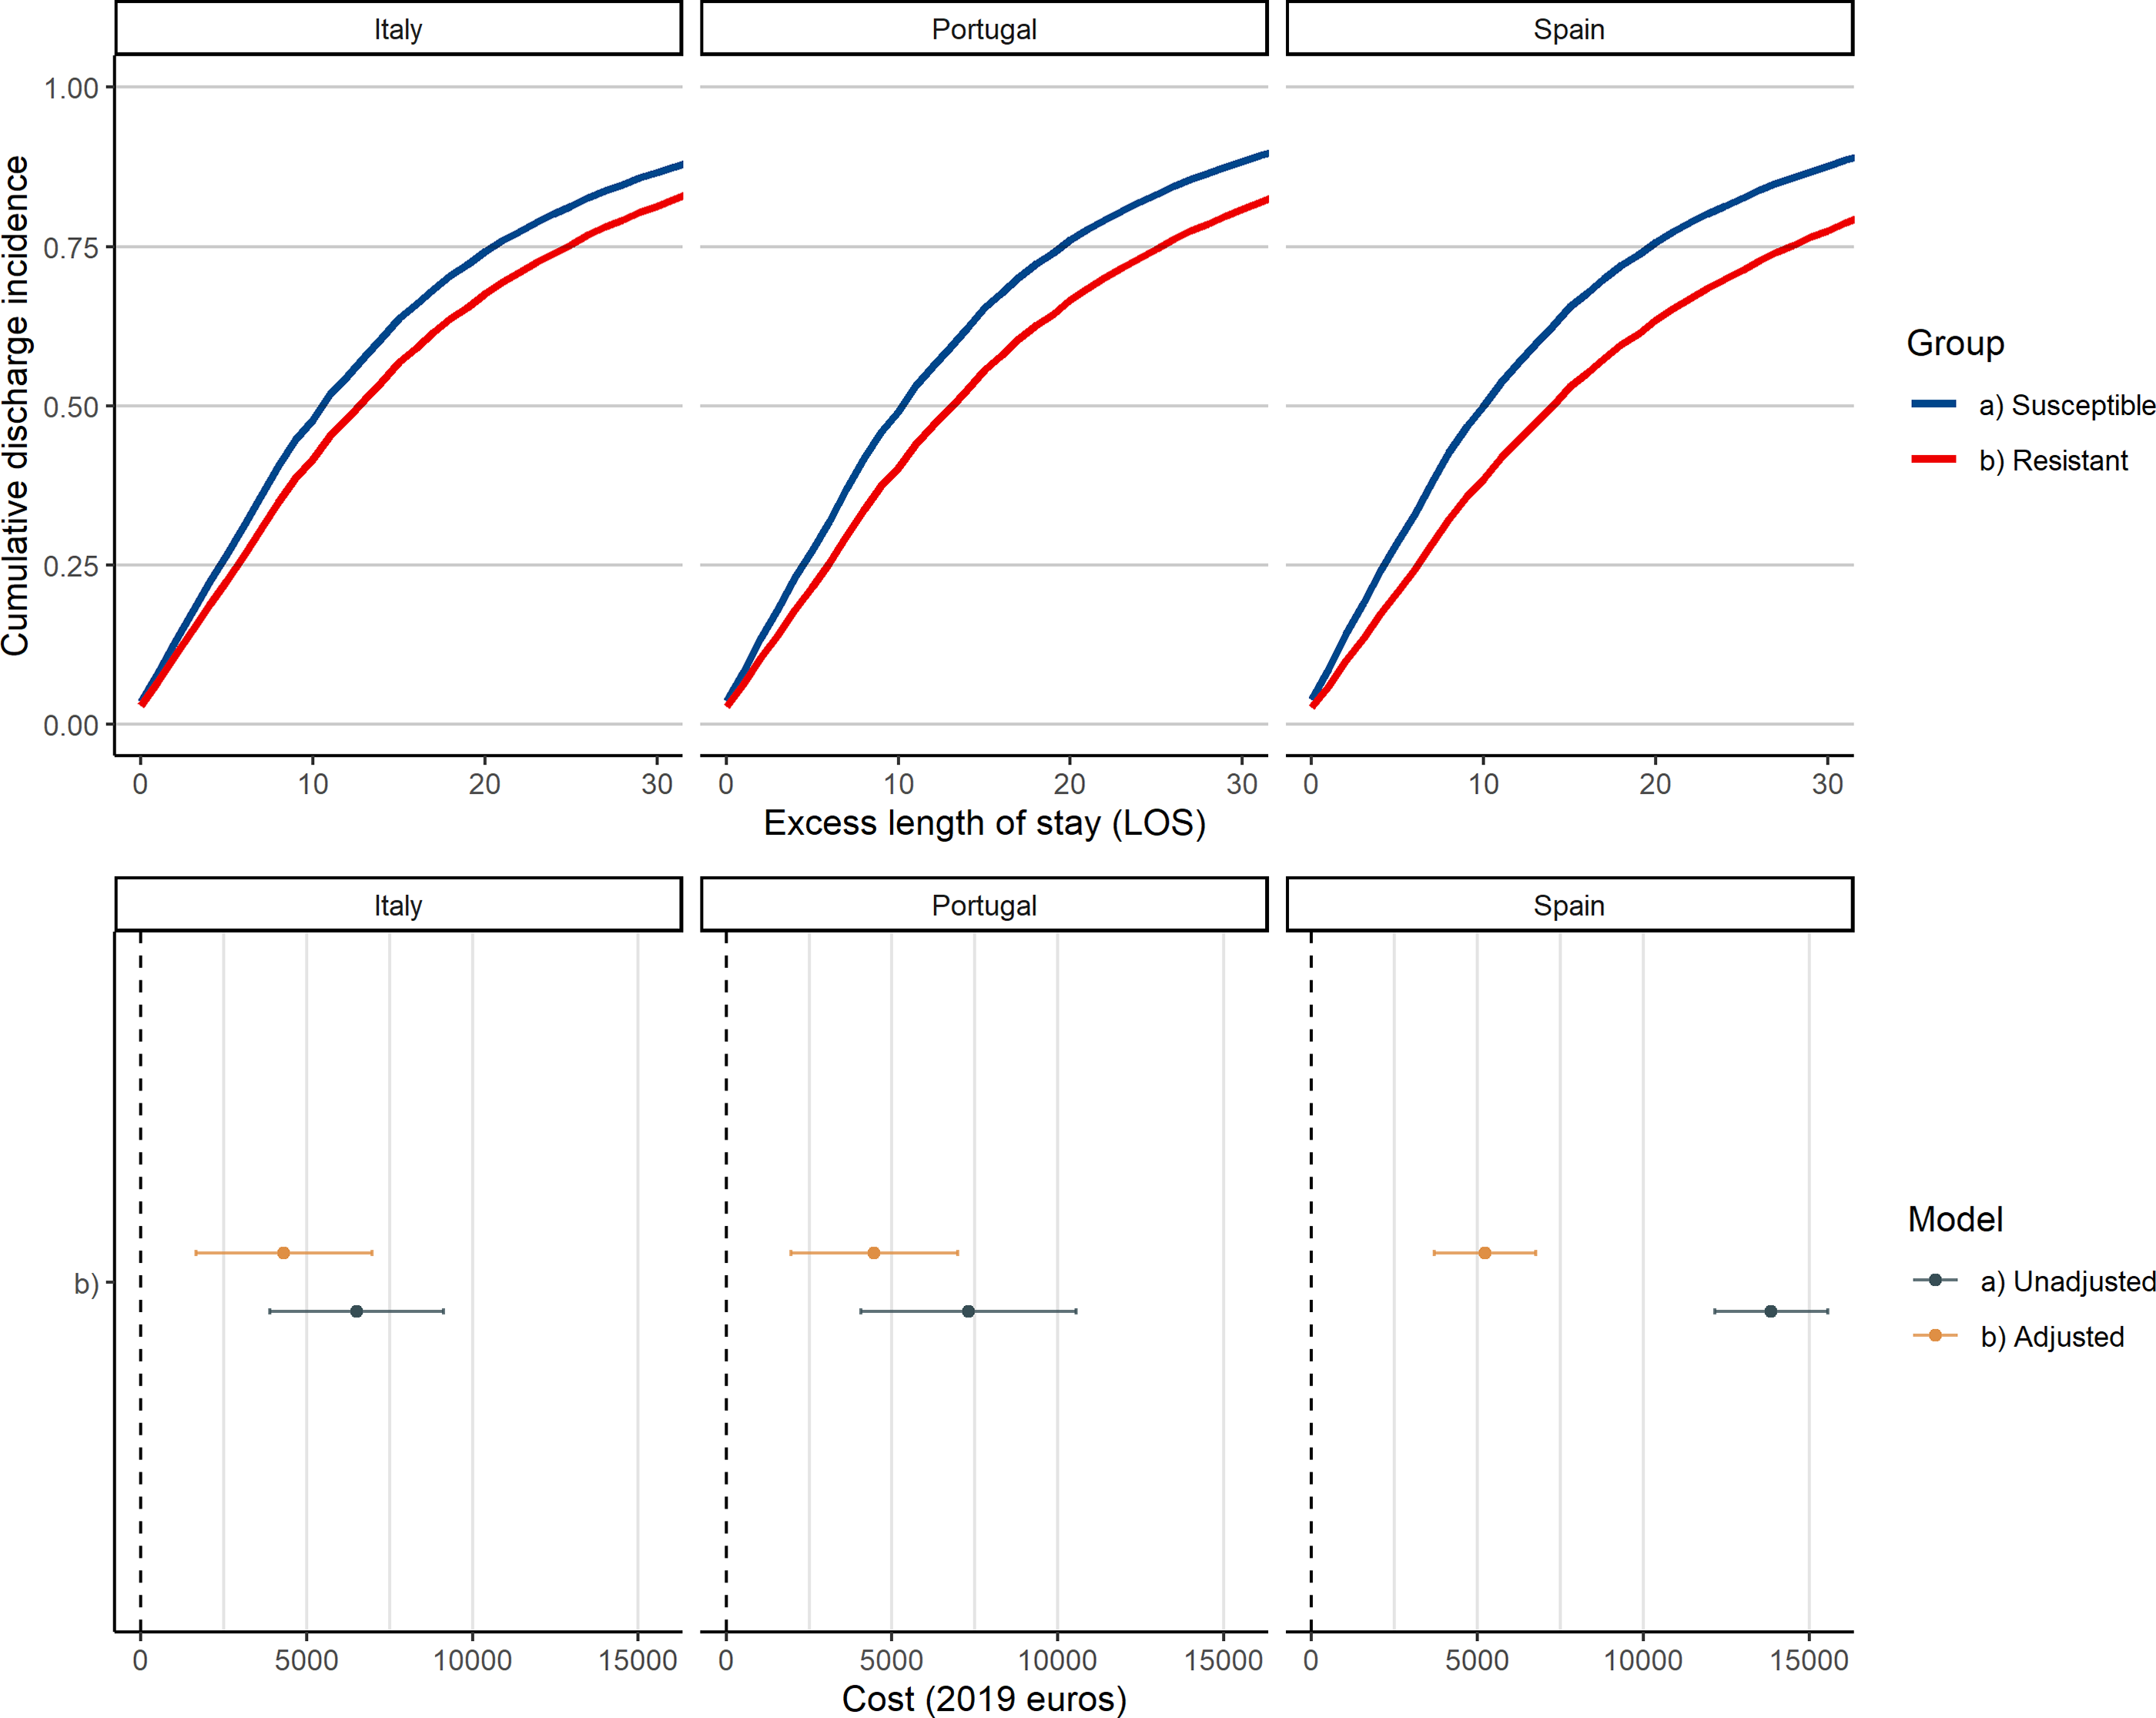
Fig. 3. Adjusted cumulative discharge incidence Cox estimates and cost estimates by resistance status and country.
The estimates from the quantitative bias analysis show a 30% increase in R Reference Li, Cao, Ge, Jiang, Zhou and Zheng2 alongside a δ = 1, meaning equal importance of unobservable to current specification to drive resistance estimates to 0 (Supplementary Fig. S3 online). Furthermore, the results of the sensitivity analysis breaking down the estimate of the number of resistant organisms at the time of infection showed that having 2 resistant organisms at the time of infection was associated with an increase in LOS of 5.787 days (95% CI, 4.548–7.025; P < .001) and that having 3 or more resistant organisms at the time of infection is associated with an increase in LOS of 15.249 days (95% CI, 12.911–17.587; P < .001).
Discussion
In this study, we approximated the causal effect of antimicrobial resistance on excess LOS and direct in-hospital economic cost in the ICU setting. We approached the research question using complementary methodologies alongside variations in confounding control. Reference Kurth, Walker and Glynn44 Moreover, we estimated a significant burden of resistance ranging from 2 to 3.5 extra days, resulting in a plausible economic effect ranging from 1,600€ to 7,000€ per resistant infection. These results contribute significantly to the antimicrobial resistance literature that explores the consequences of resistance on health and economic outcomes.
Notably, given that all patients in the sample had a relatively long mean and median LOS (29–23 days), the relative size of estimated effects ranges from 10% to 20% of the total LOS. Considering that each invasive procedure increases the patient’s chances of HAI by itself, the inclusion of confounding controls did not substantially change the estimates except for time-to-infection adjustments, which shrunk estimates between one-third and one-half. Our findings are consistent with previous studies that have explored the magnitude of time-dependent bias. Reference Nelson, Samore and Jones19,Reference Nelson, Schweizer and Perencevich20,Reference Nelson, Slayton and Stevens22 However, we report an even larger reduction in the attributable association, up to 60% compared to the 33% previously reported upward bias. Our results suggest that within southern European ICU settings, the extent of this bias could be magnified. There are several potential explanations: an older population on average, a historically higher level of antimicrobial resistance, and a relatively lower economic endowment in all areas of healthcare compared to the overall European average. Compared to other international settings, in our study, antimicrobial resistance levels fall below those of South America and Asia/Middle East (45% and 44%, respectively). Reference Vincent, Sakr and Singer45 However, when compared to North America and Australasia (19% and 21%, respectively), prevalence is much higher in our setting, representing a relative increase of ∼50%. Our results should be interpreted within high prevalence contexts in developed countries.
The strengths of the analyses performed here relate to (1) the validity of our analysis for southern European countries, and by extension, to developed countries with a high level of antimicrobial resistance, (2) the extensive use of complementary methodological approaches including multivariate and matching strategies alongside differential confounding control strategies, and (3) the use of a large and potentially representative sample of patients with ICU-acquired infections.
This study also had several limitations. We were not able to meet international definitions of antimicrobial resistance due to limited antimicrobial reporting (although this likely reflects clinical practice). The lack of observability in the use of inappropriate antimicrobial therapy, could have had an independent effect over LOS, alongside its independent economic effect. Potential unmeasured confounding could represent a bias that moved our estimates upward. We lacked information regarding severity of illness upon initial presentation, comorbidities, and immune status. Finally, no follow-up data were available after ICU discharge.
In conclusion, ICU-acquired HAI has been associated with clinically important outcomes and significant healthcare costs. Consequently, the prevention of HAI, particularly regarding those associated with invasive procedures, is essential to reduce the burden of HAI, Reference Agodi, Barchitta and Quattrocchi46 including those caused by antibiotic-resistant microorganisms. Overall, we observed a significant overall excess LOS and a substantial economic burden of resistant ICU-acquired infections compared to their susceptible counterparts. A relative increase of ∼14% in excess LOS was estimated when time to infection was introduced in the models. Failure to account for or match for HAI timing rendered an upward bias in the estimates between 10% to 60%, slightly alleviated by the inclusion of other confounding factors in line with Nelson et al. Reference Nelson, Samore and Jones19 Further studies estimating the attributable burden of antimicrobial-resistant infections in the ICU should be aware of the timing of infection.
Supplementary material
To view supplementary material for this article, please visit https://doi.org/10.1017/ice.2021.429
Acknowledgments
The authors thank all colleagues, physicians and nurses in the participating hospitals, ICUs and networks for providing surveillance data. We acknowledge Victor Paradis for his assistance with language editing. The views and opinions of the authors expressed herein do not necessarily state or reflect those of the ECDC. The accuracy of the authors’ statistical analysis and the findings they report are not the responsibility of the ECDC. The ECDC is not responsible for conclusions or opinions are drawn from the data provided. The ECDC is not responsible for the correctness of the data and data management, data merging, and data collation after the provision of the data. ECDC shall not be held liable for improper or incorrect use of the data.
Financial support
This study was funded by an unrestricted grant for the study of the consequences of antimicrobial resistance by Angelini SpA. The funders had no role in study design, data collection, and analysis, decision to publish, or preparation of the manuscript.
Conflicts of interest
M.S.B. acknowledges research grants from Horizon2020, EIT Health and ISCIII programs outside the submitted work. All other authors report no conflicts of interest relevant to this article.


