


Catheter-associated urinary tract infections (CAUTIs) are publicly reportable events. More recently, the incidence of CAUTIs in acute-care hospitals has declined,Reference Magill, O’Leary and Janelle1 but urinary catheters continue to be used widely. These catheters are associated with both infectious and noninfectious complications.Reference Saint, Trautner and Fowler2 The standardized infection ratio (SIR), or the ratio of observed to predicted infections, is the primary metric used by the National Healthcare Safety Network (NHSN) to track and compare healthcare associated infections (HAIs) over time.3 Despite its widespread use, the SIR may not be suitable for all settings and does not capture overall catheter harm.Reference Advani and Fakih4 Other metrics have been proposed to track catheter harm and preventable CAUTI events. The device utilization ratio (DUR) is the proportion of total patient days during which a urinary catheter is in place.Reference Fakih, Gould and Trautner5 The standardized utilization ratio (SUR) is the ratio of observed to predicted device days, adjusted for hospital- and unit-level factors.6 The cumulative attributable difference (CAD) is the number of excess infections that need to be prevented to reach a goal SIR, which is set by the end user.Reference Soe, Gould, Pollock and Edwards7 The CAD is used in the Centers for Disease Control and Prevention’s (CDC) Targeted Assessment for Prevention (TAP) strategy to target prevention efforts by identifying hospitals or areas within hospitals with the highest excess HAIs.Reference Soe, Gould, Pollock and Edwards7 To understand how to utilize these metrics to target prevention efforts, we assessed different catheter-associated metrics across acute-care hospitals in Connecticut.
Methods
We generated a CAUTI TAP report using NHSN data for all acute-care hospitals across Connecticut from January 1, 2018, to December 31, 2018. The SIR goal used to calculate the CAD in the TAP report was 0.75, based on the US Department of Health and Human Services 2019 target for CAUTI.8 We stratified Connecticut hospitals by bed size into large (≥425 beds), medium (250–424 beds), and small (≤249 beds) hospitals, based on the Healthcare Cost and Utilization Project National (Nationwide) Inpatient Sample Description of Data Elements, created by Agency for Healthcare Research and Quality (AHRQ) for urban teaching hospitals in the northeast region.9 We compared CAUTI events, SIR, SUR, DUR, and CAD across acute-care hospitals stratified by hospital size.
Results
A comparison of CAUTI metrics for 29 acute-care hospitals in Connecticut is shown in Table 1. Of these 29 hospitals in Connecticut, 20 (69%) were considered small hospitals. Of these 20 small hospitals, 5 were unable to generate an SIR because their number of predicted infections was <1. However, 1–3 CAUTI events occurred in these small hospitals. Two small hospitals could generate an SIR of zero because they had no observed infections during the observation period. For large, medium, and small hospitals, the median SIRs were 1.0, 1.0, and 0.8, median SURs were 0.9, 0.8, and 0.8, and median DURs were 22%, 14%, and 14.5%, respectively. The median hospital-wide CADs were 6.2 for large hospitals, 1.3 for medium hospitals, and 0.3 for small hospitals. Of the 20 small hospitals, 8 (40%) had a negative CAD, meaning they exceeded their prevention target based on the current SIR goal. However, 4 of these hospitals with a negative CAD had a SUR ≥1, suggesting that device utilization was high.
Table 1. Comparison of CAUTI Metrics Across Acute-Care Hospitals in Connecticut
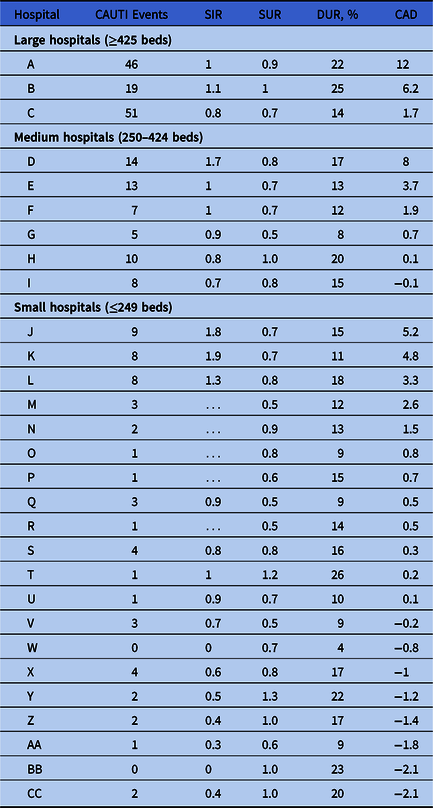
Note. CAUTI, catheter associated urinary tract infection; SIR, standardized infection ratio; SUR, standardized utilization ratio; DUR, device utilization ratio; CAD, cumulative attributable difference; …, SIR could not be calculated.
Discussion
Based on our Connecticut statewide data, the utility of current metrics varied by hospital size. For larger hospitals or hospitals with more CAUTI events, the CAD or SIR was a meaningful metric for assessing hospital-wide CAUTI prevention efforts. However, most hospitals in Connecticut are small hospitals, for which we were either not able to calculate an SIR or reported an SIR of 0 because their predicted number of infections was very low. The CDC recommends against calculating an SIR for hospitals with smaller denominators.3 As a result, small hospitals with high number of CAUTI events may not be identified. Additionally, 40% of small hospitals had a negative CAD, despite at least half of these hospitals reporting high device utilization, likely because the SIR does not adjust adequately to smaller hospitals due to lower exposure. In the absence of a reportable performance metric, these small hospitals may not be incentivized to reduce catheter harm. Similarly, it is difficult to calculate CAD at the unit level for larger hospitals with lower exposure. In such cases, using SUR or DUR may incentivize units to decrease utilization. Because SUR also adjusts for hospital- and unit-level factors, it is a more attractive measure for smaller hospitals and facilities with rare CAUTI events.Reference Advani and Fakih4 Additionally, small hospitals may benefit from locally reporting days from the last CAUTI event.
We found that examining different metrics collectively may be a more useful strategy for targeting prevention efforts. For example, hospitals with low SIRs and high SURs may represent low-risk catheter use, better maintenance and care of indwelling catheters, or strict urine-culturing practices. In these scenarios, focusing prevention efforts on decreasing device utilization should be considered to account for noninfectious catheter harm as well. Alternatively, hospitals that have high SIRs and low SURs may represent a population with more high-risk catheter use (ie, catheters in high-risk patients), inadequate catheter care, or indiscriminate urine-culturing practices. These hospitals may benefit from focusing on catheter maintenance and stewardship of culturing. Thus, using a combination of metrics may help hospitals direct their prevention strategies toward reducing overall catheter harm. These data may also be helpful to state HAI programs to target CAUTI prevention efforts on a larger scale.
Acknowledgments
None.
Financial support
Dr. Pepe was supported by the Centers for Disease Control and Prevention (CDC)’s Leadership in Epidemiology, Antimicrobial Stewardship and Public Health (LEAP) Fellowship sponsored by Infectious Diseases Society of America (IDSA), the Society of Healthcare Epidemiology of America (SHEA) and the Pediatric Infectious Diseases Society (PIDS).
Conflicts of interest
All authors report no disclosures relevant to this article.

