Since the late 1980s, enzyme immunoassay (EIA) for toxins A and B have been the primary method for laboratory detection of C. difficile.Reference McDonald, Gerding and Johnson1 EIA offered laboratories a relatively rapid test compared to older cell cytotoxicity assays.Reference Burnham and Carroll2 However, toxin A and B EIAs were plagued by variable detection sensitivity; reports indicate that the sensitivity varies from 47% to 83%.Reference De Jong, De Jong and Bartels3,Reference Eastwood, Else, Charlett and Wilcox4 These variable sensitivities in testing make it difficult for hospitals to determine the number of true C. difficile infections (CDIs).Reference Planche, Aghaizu and Holliman5
To overcome the relative insensitivity of toxin EIAs, many clinical microbiology laboratories adopted a multistep algorithm. A glutamate dehydrogenase (GDH) assay was added as the initial screening test in combination with toxin A and B EIAs. GDH has a much higher sensitivity as a common antigen found in all C. difficile isolates (toxigenic and non-toxigenic), but it lacks the specificity of the toxin EIA.Reference Burnham and Carroll2,Reference Eastwood, Else, Charlett and Wilcox4 In combination, GDH testing and toxin A and B EIA resulted in increased sensitivity and specificity for C. difficile diagnosis.Reference Burnham and Carroll2,Reference Eastwood, Else, Charlett and Wilcox4,Reference Planche, Aghaizu and Holliman5 In 2009, C. difficile detection via nucleic acid amplification testing (NAAT) became commercially available.Reference Burnham and Carroll2 The most commonly used gene target for testing is tcdB, which corresponds with the potential for toxin B production.Reference Burnham and Carroll2,Reference Voth and Ballard6,Reference Denève, Janoir, Poilane, Fantinato and Collignon7 In a study comparing 9 toxin detection assays, tcdB NAAT had similar specificity compared to cell cytotoxicity assay and cytotoxigenic culture.Reference Eastwood, Else, Charlett and Wilcox4 However, because of the increased sensitivity with NAAT, it has a limited capacity to differentiate between CDI and asymptomatic carriage of C. difficile.Reference Koo, Van and Zhao8
As C. difficile testing strategies continue to evolve, data regarding the impact these different testing strategies have on C. difficile strain diversity detection are limited. In this study, we investigated the impact that testing strategy changes had on C. difficile detection as well as the strain diversity of the C. difficile isolates detected.
Methods
In 2010 and 2012, the Edward Hines, Jr, Veterans’ Affairs Hospital underwent sequential changes to C. difficile testing protocols. Prior to December 2010, C. difficile was detected via toxin A and B EIAs (Vidas, bioMèrieux, Marcy-l’Étoile, France). In December 2010 a multistep approach (MST) was adopted for the detection of C. difficile. GDH and toxin A/B EIA (C. diff Quick Chek Complete, Techlab/Wampole, Blacksburg, VA) were used as initial screening tests. Specimens that were positive for C. difficile by GDH but negative by toxin EIA were further analyzed by molecular testing for tcdB by polymerase chain reaction (PCR, GeneXpert, Cepheid, Sunnyvale CA). Notably, in December 2010, testing was further restricted by no longer allowing >1 stool specimen per patient per week to be tested for C. difficile. Another change in testing strategy took place in June 2012, with the introduction of NAAT-only testing (GeneXpert, Cepheid) to replace the MST protocol.
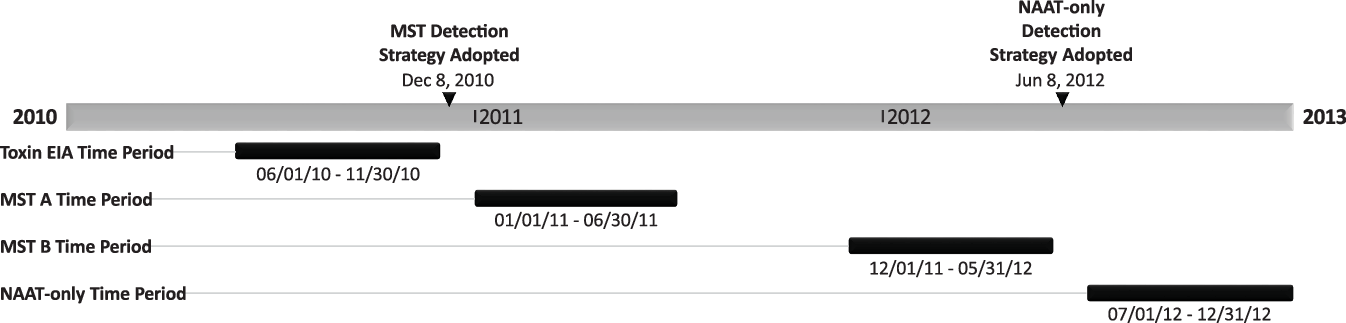
We conducted a retrospective analysis of C. difficile positive stool specimens comparing the 6 months prior to and the 6 months after testing protocols were changed (Fig. 1). The 6-month periods were labeled by testing modality: (1) the toxin EIA period (June 1, 2010, through November 30, 2010), (2) the MST-A period (January 1, 2011, through June 30, 2011), (3) the MST-B period (December 1, 2011, through May 31, 2012), and (4) the NAAT-only period (July 1, 2012, through December 31, 2012). The 1-month washout periods between both testing changes, December 2010 and June 2012, were excluded from analysis.

Fig. 1. Graphical representation of the periods analyzed and when the C. difficile testing strategies were implemented. Note. EIA, enzyme immunoassay; MST, multistep testing; NAAT, nucleic-acid amplification test.
All stool samples that tested positive for C. difficile in the clinical laboratory were frozen for subsequent testing. In the 6-month period in which toxin EIA was the only method of detection, there were 79 positive C. difficile tests and 57 specimens were available with sufficient amount of stool for further analysis. In the 6-month study period after the implementation of MST, there were 121 positive C. difficile tests. Of these 121 positive tests, 91 specimens had adequate stool for further analysis. In the 6 months prior to changing from the MST strategy to a NAAT-only testing strategy, there were 80 positive C. difficile tests, of which 49 specimens had sufficient stool for further analysis. During the 6 months after the NAAT-only testing strategy was adopted, there were 67 positive C. difficile tests with 39 specimens available for further testing. Patients with recurrent episodes of C. difficile within the study period were excluded from further analysis.
Culture
Frozen stool samples from patients that tested positive for C. difficile were thawed and inoculated on taurocholate-cefoxitin-cycloserine-fructose agar plates (TCCFA) and were incubated for 48–72 hours in an anaerobic chamber. After incubation, distinct colonies with typical C. difficile morphology were subcultured onto BBL anaerobic blood agar and were incubated anaerobically for 48–72 hours. After duplicate stool specimens were excluded, C. difficile was recovered from 39 of 46 stools prior to the MST testing algorithm, from 67 of 70 stools after the addition of the multistep testing, from 49 of 80 stools prior to NAAT-only testing, and from 39 of 67 of stools after changing to the NAAT-only testing strategy. The C. difficile isolates were frozen at −80°C prior to subsequent analysis.
Restriction endonuclease analysis typing
Restriction endonuclease analysis (REA) typing was performed on the recovered C. difficile isolates by HindIII digestion of total cellular DNA.Reference Clabots, Johnson and Bettin9 DNA fragments were separated by electrophoresis on a 0.7% agarose gel, as previously described.Reference Clabots, Johnson and Bettin9 The resulting HindIII restriction patterns were compared with previously characterized strains. Patterns showing a 90% similarity index were placed in the same REA group (letter designations). Identical patterns were given specific REA type (subgroup) number designations (eg, BI 12, BI 11, etc). The most common BI group pattern includes 3 very closely related patterns and is designated as BI 6/8/17.
Quantitative in vitro toxin production
One isolate from each non-BI group and 1 isolate from each BI subgroup were selected during each 6-month period for quantitative toxin production. The C. difficile isolates were incubated on BBL anaerobic blood agar for 48 hours. Colonies of C. difficile were then placed into brain heart infusion (BHI) broth and incubated anaerobically for 48 hours. The samples were then centrifuged, and the supernatants were separated. The supernatants were tested for total toxin concentrations using a toxin A/B kit (TechLab, Blacksburg, VA) as recommended by the manufacturer. Concentrations were extrapolated from a standard curve created using purified toxin A of known concentrations. Low toxin levels were arbitrarily defined as <log10 2.5 ng/mL (316 ng/mL), and very low toxin levels were arbitrarily defined as <log10 1.1 ng/mL (12.6 ng/mL).
Results
Change from toxin EIA to MST diagnostic testing
From June 1, 2010, to November 30, 2010 (toxin EIA period), 708 stool specimens were tested and 79 specimens tested positive for C. difficile by toxin EIA (11%; 95% confidence interval [CI], 9%–14%) (Table 1). During this time, the average number of positive C. difficile tests was 13 and the average total number of tests was 116.7 per month (Table 1). From January 1, 2011, to June 30, 2011 (MST-A period), 121 of 517 total stool specimens tested were positive for C. difficile (23%; 95% CI, 20%–27%; P < .0001 for the toxin EIA period vs MST-A period comparison). During the MST-A period, toxin EIA was positive for 68 specimens of 121 positive tests. (56.2%; 95% CI, 47%–65%). The remaining 53 positive tests were determined by NAAT to resolve discrepant GDH–EIA results. Positive C. difficile tests were more frequent during the MST-A period, with 20.2 per month, but the total number of tests performed also decreased (Table 1).
Table 1. Number of Tests Performed and Results During Sequential Toxin EIA, Multistep Testing (MST), and Nucleic Acid Amplification (NAAT) Testing Periods

a The rate of positive stool tests increased significantly between Toxin EIA and MST-A periods.
b The rate of positive stool tests did not increased significantly between MST-B and NAAT-only periods.
In total, 105 C. difficile isolates were strain typed by REA; 39 isolates prior to MST (toxin EIA period) and 65 isolates after MST(MST-A period). During the toxin EIA period, a total of 8 different REA group strains were identified (Fig. 2). During the MST-A period, 13 different REA groups were detected. In addition, an organism other than C. difficile was identified in 2 of the 66 stool specimens that tested positive by the MST protocol.

Fig. 2. Frequency and distribution of C. difficile REA group strains during 4 separate periods. Toxin EIA period represents the 6 months prior changing to a multistep testing (MST) diagnostic algorithm using EIA toxin as the sole diagnostic method. MST-A period represent the 6 months after changing to an MST algorithm. MST-B period represents and the final 6 months of using the MST algorithm. NAAT-only period represents the 6 months after the test CDI testing strategy changed to nucleic acid amplification testing only.
Overall, 18 isolates (46.2%) from the toxin EIA period and 36 isolates (55.4%) from the MST-A period belonged to the epidemic REA BI group. The BI 6/8/17 subgroup was the most frequently identified BI subgroup before and after the change in testing, consistent with previous epidemiological studies at our institution.Reference Wieczorkiewicz, Lopansri and Cheknis10
Representative C. difficile isolates from each REA group before and after the implementation of MST were analyzed for quantitative toxin production in vitro (Fig. 3). The average log10 toxin concentration during the toxin EIA period and MST-A period were 2.08 ng/mL and 1.88 ng/mL, respectively (Fig. 3). The largest range of toxin production occurred during the MST-A period (0–3.69 ng/mL) (Fig. 3). The BI group strains had the highest toxin levels throughout the study (Fig. 4). Prior to the MST protocol, 5 of 8 REA strain groups had low toxin production (<log10 2.5 ng/mL), and after the change to an MST algorithm, 9 of 13 REA strain groups demonstrated low toxin levels. Of these low toxin producers, 1 REA strain group was deemed a very low toxin producer (<log10 1.1 ng/mL) during the toxin EIA period, and 2 REA strain groups were deemed as such during the MST-A period.

Fig. 3. A box-and-whisker plot of the log10 total toxin A/B concentration (ng/mL) of each representative REA group strain from each period. The X indicates the mean during each period. Outliers represented by 0. During MST-A period, 2 isolates had no toxin production by in vitro analysis which were identified as a nontoxigenic REA group M and a non-specific REA pattern strain.

Fig. 4. A box-and-whisker plot of the in vitro Log10 total toxin A/B concentration (ng/mL) of REA group BI strains and Non-BI group strains. The X indicates the mean during each period. Outliers represented by 0.
Change from MST to NAAT-only diagnostic testing
From December 1, 2011, to May 31, 2012 (MST-B period) 490 stool specimens were tested by MST, yielding 80 positive C. difficile tests (16%; 95% CI, 13%–20%). Toxin EIA was positive in 34 tests, and the remaining 46 were detected by NAAT. From July 1, 2012, to December 31, 2012 (NAAT-only period) 368 stool specimens were tested, yielding 67 positive tests (18%; 95% CI, 15%–23%; P = .52). Compared to the MST-B period, the total number of tests per month during the NAAT-only period decreased from 80.3 to 60 tests.
In total, 88 C. difficile isolates underwent REA typing during these 2 periods: 49 isolates from the MST-B period and 39 isolates from the NAAT-only period. Moreover, 13 different REA groups were detected during the MST-B period and 10 REA groups were detected in the NAAT-only period (Fig. 2).
Of the isolates that underwent REA typing, 19 isolates (38.8%) were typed as REA group BI during the MST-B period and 8 isolates (20.5%) were classified as REA group BI during the NAAT-only period. This reflects a 47.2% decrease in REA BI group isolates from MST-B period to the NAAT-only period (P = .10). REA BI 6/8/17 accounted for 16 of 19 and 4 of 8 BI isolates during the MST-B period and NAAT-only period, respectively.
Representative C. difficile isolates from each REA group before and after the implementation of NAAT-only test strategy were analyzed for quantitative toxin production in vitro (Fig. 3). During the MST-B period and the NAAT-only period, REA BI isolates were the only strain group not to be labeled as a low-toxin group. The average log10 toxin concentrations were 1.20 ng/mL and 1.55 ng/mL during the MST-B period and the NAAT-only period. In the final 6 months of the MST testing protocol, 12 of 13 REA group strains were classified as low toxin producers, and after the change to a NAAT-only testing strategy, 9 of 10 REA group strains were classified as low toxin producers. These findings are reflected in a narrower distribution of in vitro toxin quantification (Fig. 3). Of these low toxin-producing strains, 6 were very low toxin producers during the MST-B period and 2 strain were labeled as such during the NAAT-only period.
Twelve-month epidemiologic comparison
When comparing the first 12 months (toxin EIA period and MST-A period) to the second 12 months (MST-B period and NAAT-only period), REA group BI C. difficile isolates decreased from 51.9% to 30.7% (P = .0034) and REA group J decreased from 12.5% to 1.1% (P = .002). Conversely, REA group Y and nonspecific REA groups increased from 8.7% to 18.2% (P = .056) and from 0.96% to 9.1% (P = .0124), respectively.
Discussion
From 2010 to 2012, our hospital underwent sequential methodologic changes for detecting C. difficile, similar to the changes made in clinical laboratories across the United States during this period.Reference Gould, Edwards and Cohen11,Reference Moehring, Lofgren and Anderson12 After incorporating diagnostic testing strategies with increased sensitivity, we noted an increased detection rate of C. difficile that was associated with a trend toward increased strain diversity. These changes were most notable after switching to the MST algorithm where NAAT was used to resolve discrepancies between discordant GDH and toxin EIA results. After changing from an MST algorithm to a NAAT-only testing protocol, the detection rate and strain diversity did not change appreciably.
These data revealing increased detection rates are consistent with previous findings that MST algorithms and NAAT-only testing are much more sensitive in the detection of C. difficile.Reference Burnham and Carroll2–Reference Planche, Aghaizu and Holliman5 The implementation of both the MST and the NAAT testing protocols at our hospital led to an increase in the rate at which C. difficile was detected despite a decrease in the number of stools tested, further validating the increased sensitivity of these tests. Our findings suggest that the higher detection rate was driven by the detection of additional C. difficile strains not recovered by toxin testing alone.
After the implementation of high-sensitivity testing strategies, strain diversity nearly doubled and remained elevated throughout the remainder of our study. The trend toward increased strain diversity corresponded with an increase in the detection of isolates that we characterized as low and very low toxin producing. After the implementation of the MST algorithm and the eventual transition to a NAAT-only protocol, low-toxin strains accounted for the majority of isolates recovered.
Changes in the epidemiology of CDI may have influenced the findings our study. The epidemic REA group BI was the most common strain at our hospital 3 to 4 years prior to this study accounting for 72% of first CDI episodes.Reference Wieczorkiewicz, Lopansri and Cheknis10 We noted a progressive decrease in the percentage of BI during the transition from MST testing to NAAT testing in this study. After MST had been in place for nearly a year, the number of stools tested were nearly identical (85.7 and 80.3 per month for MST-A and -B periods, respectively), but the number of positive C. difficile decreased by 30.3% (P = .005). We postulate that this decrease in detection is linked to the decrease in REA group BI isolates, which decreased by 40.8% between the two 12-month intervals. REA group BI, which corresponds to PCR ribotype 027 and NAP1 by PFGE, has notable high levels of toxins A and B in vitro and was responsible for multiple hospital outbreaks of severe disease in the early 2000s.Reference Warny, Pepin and Fang13,Reference Killgore, Thompson and Johnson14
Following the decrease of REA group BI in the latter half of our study, most isolates recovered were low and very low toxin-producing strains (Fig. 3). We postulate that detection of low toxin-producing strains accounted for the increased sensitivity of testing during the MST periods when nearly 66% of the positive test results required NAAT to settle a discordant GDH-positive/toxin EIA-negative test result.
The second most common group strain in this study was REA group Y, which is historically among the more common strains identified in North America.Reference Cheknis, Johnson and Chesnel15 Our data show that toxin production in this strain group was variable, ranging from high toxin to very low toxin production in vitro. Although they are not typically associated with significant morbidity and mortality, REA group Y is a fully toxigenic strain carrying both tcdA and tcdB genes and is associated with clinical disease.Reference Warny, Pepin and Fang13,Reference Vohra and Poxton16–Reference Knight, Squire, Collins and Riley18
The MST algorithm and the NAAT-only testing strategy were both more sensitive than toxin EIA testing, but they do have potential drawbacks. As with any test, as sensitivity increases, the chance for a false-positive test increases as well.Reference Lalkhen and McCluskey19 The presence of the tcdB gene does not always correlate with active C. difficile infection and could indicate colonization with C. difficile and diarrhea due to another cause.Reference Planche, Davies and Coen20–Reference Bartlett and Gerding23
For these reasons, the IDSA/SHEA CDI guidelines recommend using NAAT-only testing when there is an institutional agreement to limit testing to patients not on laxatives who have new onset of significant diarrhea.Reference McDonald, Gerding and Johnson24 In addition, limiting testing for outpatients to those with risk factors such as antibiotic and healthcare-associated exposures should improve specificity.
Recently, increasing evidence has supported toxin EIA testing in conjunction with NAAT testing.Reference Guh, Hatfield and Winston25 A recent study of close to 5,000 patients found that stools that test positive by GDH and toxin EIA reflexed to NAAT for discrepant results were associated with increased risk for recurrence as well as greater severity of disease compared to NAAT alone.Reference Guh, Hatfield and Winston25 Since this study by Guh et al, some hospitals have implemented the use of C. difficile toxin testing to confirm a positive C. difficile NAAT test.
The limitations of our study include potential confounding by the changing epidemiology of C. difficile over time as noted above for strain REA group BI. Other limitations include potential confounding by changes in clinical testing practice, such as the limitation on the number of stool tests submitted per week between the toxin EIA and MST-A periods. The number of positive tests decreased significantly between the MST-A and MST-B periods, suggesting a possible population bias. We tried to minimize this bias by focusing our analysis on the immediate periods before and after changes in diagnostic tests.
In conclusion, our results confirm that toxin EIA testing alone lacks optimal sensitivity to detect C. difficile when compared to high-sensitivity testing strategies such as MST and NAAT-only protocols. More notably, our results reveal a possible increase in C. difficile strain diversity when changing from a toxin EIA strategy to an MST algorithm. In contrast, the change from MST to NAAT-only testing was not associated with any significant change in detection rate for C. difficile or change in strain diversity suggesting that MST algorithms that use NAAT for resolution of discrepant GDH/toxin EIA results are comparable in sensitivity to NAAT-only testing if they are used in the appropriate clinical setting. The increased sensitivity of these test may be related to the detection of low toxin-producing isolates. Further investigation is needed to determine whether detection of these low toxin-producing strains correlate with clinical infection or colonization.
Acknowledgments
We thank Stacey Spadoni and Bruce Dunn from the Hines VA clinical microbiology laboratory and the VISN12 pathology service line for their help and for facilitating this study. We also thank Susan Sambol for help with the in vitro toxin testing and David Lyerly for supplying the toxin A standard for the quantitative toxin assay.
Financial support
Dr Stuart Johnson and Dr Dale Gerding are supported by the US Department of Veterans’ Affairs Research Service.
Conflicts of interest
All authors report no conflicts of interest relevant to this article.