


Human papillomavirus (HPV) is the most common sexually transmitted infection (STI) in the US with approximately 79 million persons currently infected and 14 million new infections every year (Satterwhite et al., Reference Satterwhite, Torrone, Meites, Dunne, Mahajan, Bañez Ocfemia, Su, Xu and Weinstock2013). While the majority of HPV infections resolve on their own with no sequelae, HPV infection can persist and cause disease. HPV has been associated with cancer at several anatomic sites: cervical, vaginal, and vulvar cancer in females; penile cancer in males; and anal and oropharyngeal cancer in both sexes. HPV can also cause cervical precancers, anogenital warts and recurrent respiratory papillomatosis (Petrosky et al., Reference Petrosky, Bocchini, Hariri, Chesson, Robinette Curtis, Saraiya, Unger and Markowitz2015). Currently, three HPV vaccines have been approved for use in the US: bivalent (Food and Drug Administration, 2009), quadrivalent (Food and Drug Administration, 2006) and nonavalent (Food and Drug Administration, 2014). These vaccines differ in the number of HPV types, or serotypes, that are prevented. All three vaccines prevent HPV types 16 and 18, which cause the majority of HPV-related cancers (Meites et al., Reference Meites, Kempe and Markowitz2016). For the nonavalent vaccine, recommendations were updated in 2016 to a two-dose series for those who initiate vaccination before their 15th birthday (Meites et al., Reference Meites, Kempe and Markowitz2016). Routine HPV vaccination at 11–12 years of age has been recommended in the US for females since 2006 and males since 2011 (Markowitz et al., Reference Markowitz, Dunne, Saraiya, Chesson, Robinette Curtis, Gee, Bocchini and Unger2014).
Despite the health benefits of HPV vaccination, coverage rates are short of the Healthy People 2020 target of 80% coverage for three or more doses of HPV vaccine (Stokley et al., Reference Stokley, Jeyarajah, Yankey, Cano, Gee, Roark, Robinette Curtis and Markowitz2014). Coverage rates for HPV vaccination also lag behind coverage rates for other adolescent vaccines (Stokley et al., Reference Stokley, Jeyarajah, Yankey, Cano, Gee, Roark, Robinette Curtis and Markowitz2014). As of 2015, 3-dose HPV vaccine coverage rates among 13–15-year-olds in the US were estimated at 37% for females and 27% for males (Reagan-Steiner et al., Reference Reagan-Steiner, Yankey, Jeyarajah, Elam-Evans, Curtis, MacNeil, Markowitz and Singleton2016). Factors associated with HPV vaccine uptake include the strength of physician recommendation (Rosenthal et al., Reference Rosenthal, Weiss, Zimet, Ma, Good and Vichnin2011), parent preferences (Brown et al., Reference Brown, Reed Johnson, Poulos and Messonnier2010; Freed et al., Reference Freed, Clark, Butchart, Singer and Davis2010) and child preferences (Brown et al., Reference Brown, Poulos, Reed Johnson, Chamiec-Case and Messonnier2014). In the President's Cancer Panel, one of the major goals that was discussed was to increase HPV vaccine coverage in the US. This goal is supported by the strategy of increasing acceptance of HPV vaccines among parents, caregivers, and adolescents (Rimer et al., Reference Rimer, Harper and Witte2014).
A related reason that has been suggested for relatively low HPV vaccine coverage is the perception that HPV vaccination might promote risky sexual behavior through mechanisms such as risk compensation, behavioral disinhibition, or perceived endorsement of sexual activity. These concerns are consistent to some degree with economic theory, where lowering the cost of risky sex (such as with HPV vaccination) would be expected to increase the demand for risky sex. Previous public health researchers have found little evidence to support this claim (Bednarczyk et al., Reference Bednarczyk, Davis, Ault, Orenstein and Omer2012; Liddon et al., Reference Liddon, Leichliter and Markowitz2012; Mayhew et al., Reference Mayhew, Kowalczyk Mullins, Ding, Rosenthal, Zimet, Morrow and Kahn2014; Smith et al., Reference Smith, Kaufman, Strumpf and Lévesque2014; Jena et al., Reference Jena, Goldman and Seabury2015). Our study investigates this claim using a methodological approach and dataset that are new to this issue. In particular, this is the first study we are aware of that implements a propensity score-based approach to investigate the relationship between vaccination status and sexual behavior. We also investigate relatively subtle changes in sexual behavior, including frequency of condom usage and frequency of sexual intercourse, available from the National Health and Nutrition Examination Survey (NHANES) dataset, which has not been used to investigate the issue of HPV vaccination status and risky sexual behavior.
1. Relevant background and literature
The benefits and costs of HPV vaccination have been an object of discussion in the research literature (Goldie et al., Reference Goldie, Kohli, Grima, Weinstein, Wright, Xavier Bosch and Franco2004; Chesson et al., Reference Chesson, Ekwueme, Saraiya and Markowitz2008) as well as in the popular media (Brody, Reference Brody2007), with a fair amount of attention paid to aspects of sexual behavior and sexual activity (Bednarczyk et al., Reference Bednarczyk, Davis, Ault, Orenstein and Omer2012; Liddon et al., Reference Liddon, Leichliter and Markowitz2012; Mullins et al., Reference Mullins, Zimet, Rosenthal, Morrow, Ding, Shew, Dennis Fortenberry, Bernstein and Kahn2012; Mayhew et al., Reference Mayhew, Kowalczyk Mullins, Ding, Rosenthal, Zimet, Morrow and Kahn2014; Offit, Reference Offit2014; Smith et al., Reference Smith, Kaufman, Strumpf and Lévesque2014; Jena et al., Reference Jena, Goldman and Seabury2015). Several studies investigate the relationship between vaccination status and medical conditions that are related to sexual behavior, such as the diagnosis of other STIs, as captured by electronic health record databases (Bednarczyk et al., Reference Bednarczyk, Davis, Ault, Orenstein and Omer2012; Smith et al., Reference Smith, Kaufman, Strumpf and Lévesque2014; Jena et al., Reference Jena, Goldman and Seabury2015). Other studies use surveys to estimate the relationship between vaccination status and levels of specific sexual behaviors, such as a number of sexual partners and condom usage (Liddon et al., Reference Liddon, Leichliter and Markowitz2012; Mayhew et al., Reference Mayhew, Kowalczyk Mullins, Ding, Rosenthal, Zimet, Morrow and Kahn2014). While the majority of studies in this area have been narrow in geographic scope, focusing on a single (Bednarczyk et al., Reference Bednarczyk, Davis, Ault, Orenstein and Omer2012; Mayhew et al., Reference Mayhew, Kowalczyk Mullins, Ding, Rosenthal, Zimet, Morrow and Kahn2014; Jena et al., Reference Jena, Goldman and Seabury2015) or regional health system (Smith et al., Reference Smith, Kaufman, Strumpf and Lévesque2014), at least one recent study analyzed a nationally-representative sample, using the National Center for Health Statistics' (NCHS’) National Survey of Family Growth (Liddon et al., Reference Liddon, Leichliter and Markowitz2012). Recent prevalence assessments of HPV in the US came from NCHS’ NHANES (Markowitz et al., Reference Markowitz, Hariri, Lin, Dunne, Steinau, McQuillan and Unger2013, Reference Markowitz, Liu, Hariri, Steinau, Dunne and Unger2016), the data source used in our study. The prevalence study found decreasing rates of HPV associated with HPV vaccination status but did not investigate into all of the sexual behaviors reported in NHANES (i.e., frequency of condom use and frequency of sexual encounters) (Markowitz et al., Reference Markowitz, Hariri, Lin, Dunne, Steinau, McQuillan and Unger2013).
In contexts other than HPV vaccination, changes in sexual behaviors have been noted in response to changes in factors that affect the potential risks, or ‘costs’, of sexual activity. For example, the availability of long-acting reversible contraception can lead to reductions in condom use (Steiner et al., Reference Steiner, Liddon, Swartzendruber, Rasberry and Sales2016). As another example, substantial reductions in risky behavior in response to the HIV/AIDS epidemic have been well-documented (Stolte et al., Reference Stolte, Dukers, Geskus, Coutinho and Wit2004). The emergence of highly active anti-retroviral therapy for HIV, which could lower the perceived consequences of acquiring HIV, was associated with increased frequency of unprotected sex and outbreaks of syphilis among men who have sex with men (Chesson and Gift, Reference Chesson and Gift2008). Concerns about risk compensation and behavioral change complicate many prevention efforts of HIV/AIDS (Cassell et al., Reference Cassell, Halperin, Shelton and Stanton2006). While we acknowledge that improvements in the prevention and treatment of HIV/AIDS are likely to have much greater impacts on the perceived health-risks of sexual activity than would improvements in the prevention of HPV, the possibility that the HPV vaccine may change some level of perception, attitude, or incentive regarding sexual behavior seems plausible.
Two recent studies (Smith et al., Reference Smith, Kaufman, Strumpf and Lévesque2014; Moghtaderi and Dor, Reference Moghtaderi and Dor2016) have investigated the effects that the receipt of the HPV vaccine may have on the subsequent health-risk perceptions and health-related behaviors of young women. Both of these studies measured subsequent health behaviors by encounters with the health care system related to Pap tests (Moghtaderi and Dor, Reference Moghtaderi and Dor2016) and related to non-HPV STIs or pregnancy (Smith et al., Reference Smith, Kaufman, Strumpf and Lévesque2014). The Pap test is a cervical screening test used to detect precancers and cancers, which can be related to specific types of HPV (Moghtaderi and Dor, Reference Moghtaderi and Dor2016). Both of these studies implemented regression discontinuity research designs that utilized the adoption of age-specific HPV vaccination policy as a treatment assignment variable.
While these empirical approaches rely on the plausibly exogenous assignment of treatment (i.e., exposure to HPV vaccination) due to the age threshold of vaccination recommendations, the approach used in our study relies on minimizing confounder bias through propensity score weighting. Our contribution to this literature includes (1) the application of a new methodological approach to this problem, propensity score-based empirical approach, and (2) assessment of relatively subtle, or marginal, changes in health risk-related behavior including frequency of sexual intercourse and frequency of condom usage.
2. Methods
This study assembles an analytical dataset using data from NHANES (Johnson et al., Reference Johnson, Paulose-Ram, Ogden, Carroll, Kruszan-Moran, Dohrmann and Curtin2013; Centers for Disease Control and Prevention, 2015). NHANES is a repeated cross-sectional questionnaire survey and medical examination. NHANES respondents are from a probability-based sample that is drawn to be nationally representative. The survey questionnaire component of NHANES elicits a multitude of factors related to demographics, behavioral characteristics and health insurance and utilization, including whether or not a respondent received selected vaccinations; see Data section, below, for more information.
For this study, we estimate the probability of an individual receiving an HPV vaccine, measured in our data as having received at least one dose of the vaccine. Then using the predicted probabilities of vaccination, we construct inverse probability of treatment weights (IPTWs). Using an IPTW-balanced sample, we estimate an outcomes model. This estimation procedure is said to be doubly robust due to the characteristic that if either the propensity model or the outcome model is properly specified, the procedure yields unbiased estimates for an average treatment effect (ATE) (Funk et al., Reference Funk, Westreich, Wiesen, Stürmer, Alan Brookhart and Davidian2011; Kaiser and Schmid, Reference Kaiser and Schmid2014). Generally, this approach is based on the potential-outcomes framework (Rubin, Reference Rubin1974).
2.1 Conceptual approach
Estimating causal effects using propensity models has been described in detail in the literature many times (Hirano and Imbens, Reference Hirano and Imbens2001; Imbens, Reference Imbens2004; Kaiser and Schmid, Reference Kaiser and Schmid2014). Propensity score-based methods have been used in the economic and health research literature for many years, investigating critical health issues such issues as cardiovascular disease (Deb et al., Reference Deb, Austin, Tu, Ko, David Mazer, Kiss and Fremes2016), drug addiction (Griffin et al., Reference Griffin, Ramchand, Almirall, Slaughter, Burgette and McCaffery2014), health communications (Leidner, Reference Leidner2014) and cancer treatment (Fujii et al., Reference Fujii, Yamada, Murotani, Kanda, Sugimoto, Nakao and Kodera2015; Jung et al., Reference Jung, Kim, Lee, Park, Suh, Kim, Kim, Kim and Nam2015). Researchers have investigated a variety of issues utilizing methods that combine both propensity score-based methods and data from NHANES, such as lead exposure among children (Ahrens et al., Reference Ahrens, Haley, Rossen, Lloyd and Aoki2016), obesity (Goossens et al., Reference Goossens, Hoshida, Song, Jung, Morel, Nakagawa, Zhang, Frossard, Spahr, Friedman, Negro, Rubbia-Brandt and Giostra2015; Ahrens et al., Reference Ahrens, Haley, Rossen, Lloyd and Aoki2016), cancer-related health behavior (Jabson et al., Reference Jabson, Farmer and Bowen2015) and oral health (Murphy et al., Reference Murphy, Harrell, Fintzy, Belin, Gutierrez, Vitero and Shetty2014). Using the predicted probability of vaccination as an observation weight, two samples are constructed that are comparable across all the variables in the model except for vaccination status. Because the only observable difference between the two constructed samples is in the treatment variable, this approach can illustrate potentially causal associations. The ATE estimates are computed following the estimation of an outcomes regression model that controls for a variety of relevant individual characteristics, many of which are also used to estimate the propensity model. The major limitation of this approach is that the similarities or balance between the two constructed samples among attributes that are unmeasurable cannot be assessed. The balance between the two constructed samples and the effect estimates depends on the specifications of the propensity score model and the outcomes model. To further ensure our estimates are robust to specification choice, we estimate two propensity score models and several outcomes models. Another complication of our study is that NHANES data are collected from a complex survey design. Building on the work of other propensity-score-based studies that use complex survey data (DuGoff et al., Reference DuGoff, Schuler and Stuart2014; Ridgeway et al., Reference Ridgeway, Kovalchik, Griffin and Kabeto2015), both the propensity model and the outcomes model are adjusted for the complex survey design of NHANES.
2.1.1 Propensity model
The treatment assignment variable in this study is whether or not an NHANES respondent reported ever receiving at least one dose of HPV vaccine. This variable is represented by z i, where z i = 1 indicates that individual i was a vaccine recipient and z i = 0 indicates no vaccine was received. The vector X i contains the individual characteristics that predict the probability of treatment assignment. In the regression models, these individuals are weighted to represent a national sample, using the medical exam weights from NHANES. In general, the propensity score (p i(X i)), or the probability of individual i receiving a vaccine conditional on the individual's characteristics, can be represented with the following equations:
 $$p_i(X_i) = Pr(z_i = 1 \vert X_i)$$
where
 $$0\; \lt p_i(X_i) \lt 1.$$
 The probability of treatment assignment is a function of the vector of covariates X i and the vector of estimated coefficients  ${\rm {\rm A}}$, as in the following:
 $$Pr(z_i = 1 \vert X_i) = \alpha _0 + \alpha _1x_{1,i} + \alpha _2x_{2,i} + \cdots + \alpha _kx_{k,i}$$
where k is the number of covariates in X i. After estimating the propensity model, the predicted values for each individual ( $\hat{p}_i$, predictions are denoted with a hat) are used to construct the IPTWs (
 $w_i^p $) (Hirano and Imbens, Reference Hirano and Imbens2001). This construction of the IPTWs corresponds to the estimation of an ATE.
 $$w_i^p = \displaystyle{{z_i} \over {{\hat{\,p}}_i}} + \displaystyle{{1-z_i} \over {1-{\hat{\,p}}_i}}$$
 The final analytical weight (w i) for each individual that is used in the final outcomes regression model is the sampling weight from the complex survey design ( $w_i^s $) multiplied by the IPTW (
 $w_i^p $) (Ridgeway et al., Reference Ridgeway, Kovalchik, Griffin and Kabeto2015):
 $$w_i = w_i^s \times w_i^p $$
2.1.2 Doubly robust estimator
The outcomes model estimates the relationship between the outcomes of interest (Y j) and the treatment variable (z i). In addition to the treatment variable, a vector of other covariates, denoted as V i, are also included the outcomes model:
 $$Pr(Y_{\,j,\zeta} = 1 \vert z_i,V_i) = \beta _{0,j,\zeta} + \beta _{1,j,\zeta} v_{1,i} + \beta _{2,j,\zeta} v_{2,i} + \cdots + \beta _{k,j,\zeta} v_{k,i} = m_\zeta (V_i,{\rm B}_\zeta )$$
where ζ = 0 for controls and ζ = 1 for treated, and j is the index for each outcome we investigated. The predicted values from the outcomes model are represented by the term  $\hat{m}_\zeta (V_i,{\rm B}_\zeta )$, with either treatment or control imposed on the model. The complete specification of the doubly robust estimator (
 ${\hat{\rm \Delta}} _{DR}$) is as follows:
 $$\eqalign{{\hat{{\rm \Delta}}} _{DR} & = \displaystyle{1 \over n}\mathop \sum \limits_{i = 1}^n \displaystyle{{z_iy_i-(z_i-{\hat{\,p}}_i){\hat{m}}_1(V_i,{\rm B}_1)} \over {{\hat{\,p}}_i}} \cr & -\displaystyle{1 \over n}\mathop \sum \limits_{i = 1}^n \displaystyle{{(1-z_i)Y_i-(z_i-{\hat{\,p}}_i){\hat{m}}_0(V_i,{\rm B}_0)} \over {1-{\hat{\,p}}_i}}} $$
where n is the sample size;  $\hat{p}_i$ is the predicted propensity score;
  $\hat{m}_\zeta (V_i,{\rm B}_\zeta )\; $ are the predictions from the outcome model with the treatment variable ζ set to 0 or 1 for the entire sample; V i is the set of covariates; and Bζ are the estimated coefficients from the outcome model with the treatment variable ζ set to 0 or 1 (Funk et al., Reference Funk, Westreich, Wiesen, Stürmer, Alan Brookhart and Davidian2011).
2.2 Empirical approach
The dependent variables in the propensity model and outcomes model are all binary. So both sets of models can be estimated with any binary limited dependent statistical regression, such as a logit or probit. For this study, we use a logit model.
2.2.1 Potential causation model
The general relationships between factors and outcomes that are assumed by our empirical specifications are depicted in a conceptual diagram (Figure 1). One issue of particular relevance to this study is the relationship between prior sexual behavior, HPV vaccination, and sexual behaviors that occur after a vaccination is received. For some young women, the decision to receive an HPV vaccination might depend on whether or not she is sexually active. For sexually active women, past sexual activity is likely correlated to present sexual activity, independent of vaccination status. For this reason, we include age at first sexual encounter, intended to control for past sexual activity, as a covariate in the propensity model. Other variables, such as having ever taken an HIV test and having ever taken birth control pills, are included in health system utilization section of Figure 1, but these may also be considered as indicators of sexual behavior. In the IPTW samples, the treated and controls are balanced with respect to age at first sexual encounter, having taken an HIV test, and having taken birth control pills. The propensity model also includes several variables that we believe are plausibly unrelated to sexual behavior decisions, but would likely impact the probability of an individual receiving the HPV vaccine. These variables include an indicator variable for the past receipt of additional vaccines, including hepatitis A and hepatitis B. While it is possible that hepatitis A and B can be transmitted sexually, these are not particularly common events and likely constitute a smaller influence on the perceived health risks of sexual activity than would an HPV vaccination or concerns over other STIs.
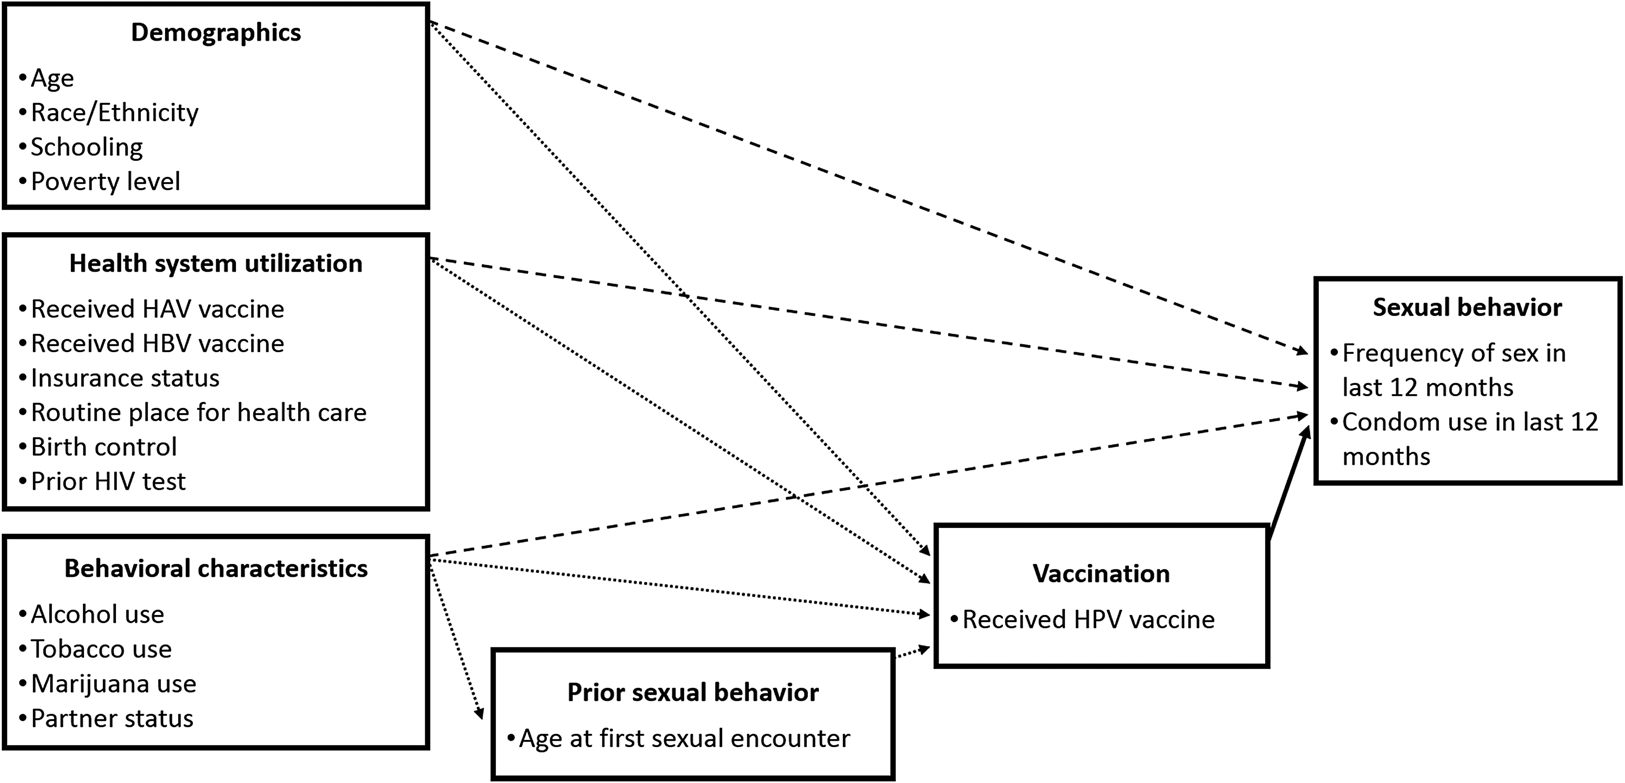
Figure 1. Conceptual diagram of HPV vaccination and risky behavior model.
2.2.2 Model specifications
To address the potential for mis-specification, we select two specifications for the propensity model (equation (3)) and three or four specifications for the outcomes model (equation (6)), depending on the outcome variable. Therefore, for each outcome variable, we estimate six or eight regressions, two different propensity models and three or four different outcomes models. We refer to the two specifications of the propensity model as ‘basic’ and ‘expanded’. In the basic propensity model, the covariate vector X i contains characteristics about each respondent. These characteristics include race/ethnicity indicators, age in years at the time of the survey, high school completion status, marital status, household poverty-line status, health insurance status, history of taking birth control pills, vaccination history for hepatitis A and hepatitis B, history of being tested for HIV, smoking status, alcohol consumption status, age in years at time of first sexual experience and a time trend. All variables are defined in Table 1. In the expanded propensity model, the covariate vector X i contains the same conceptual components as the basic propensity model, but with more refined resolution in some of the variables, where such data are available. As one example, the behavioral variables in the basic propensity model include if a respondent has ever drank alcohol or ever smoked 100 cigarettes. In the expanded propensity models, additional variables, which in this example captured the number of alcohol drinks consumed by a respondent per day and if a respondent currently smokes cigarettes every day, are also included. Additional details on the model specifications are given in the Supplemental Appendix.
Table 1. Description of data compiled from the National Health and Nutrition Examination Surveys from 2007 to 2014
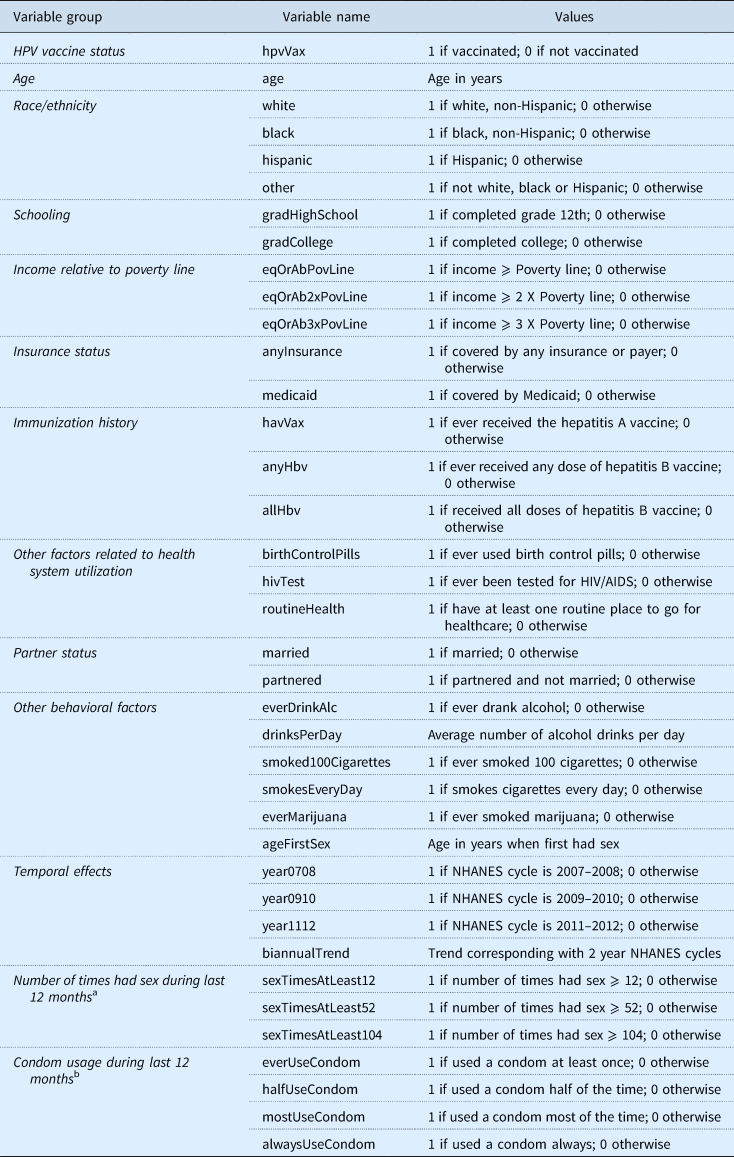
a Verbatim question from NHANES: ‘In the past 12 months, about how many times have you had (vaginal or anal/vaginal/anal) sex?’ Possible responses to this question were categorical: ‘Never’, ‘Once’, ‘2–11 times’, ‘12–51 times’, ‘52–103 times’, ‘104–364 times’, ‘365 times or more’, ‘Refused’ to give a response, and ‘Don't know'.
b Verbatim question from NHANES: ‘In the past 12 months, about how often have you had (vaginal or anal/vaginal/anal) sex without using a condom?’ Possible responses to this question were categorical: ‘Never’, ‘Less than half of the time’, ‘About half of the time’, ‘Not always, but more than half of the time’, ‘Always’, ‘Refused’ to give a response, and ‘Don't know’. To simplify interpretation, the responses for this question were converted to values indicating the portion of times the respondent had sex with a condom, as opposed to without a condom.
HPV refers to human papillomavirus.
We implement up to four specifications of the outcomes model. The labels we give to these specifications are ‘basic’, ‘expanded’, ‘basic with sex frequency’, and ‘basic with age fixed effects’. Due to limited degrees of freedom, we could not implement the expanded outcomes model with sex frequency or with age fixed effects (Table 1). As with the expanded propensity model, the expanded outcomes model contains many of the same conceptual components as the basic outcomes model but several variables are structured to capture a more detailed resolution. The full specification of the basic and expanded models is presented in the Supplemental Appendix. Additional specifications of the outcomes model include the basic model with sex frequency and the basic model with age fixed effects. The basic model with sex frequency includes all the covariates from the basic outcomes model with the addition of the three sex frequency indicator variables. The basic model with age fixed effects includes indicator variables for every age level.
2.2.3 Inference
Inference for these models is based on 500 bootstrapped replications (Wooldridge, Reference Wooldridge2009), with a replication method based on a rescaled bootstrap procedure described in previous studies (Rao et al., Reference Rao, Wu and Yue1992; Cheng et al., Reference Cheng, Han and Gansky2008) and recently used to analyze NHANES data (Talih, Reference Talih2013, Reference Talih2015). The upper and lower 95% confidence intervals were estimated using the 97.5th and the 2.5th percentiles of the bootstrapped estimates' distribution, respectively. Standard errors were computed directly using the square root of the sample variance of the bootstrapped estimates.
3. Data
NHANES is a cross-sectional, complex, multistage probability sampling survey. The survey is designed to assess the health and nutritional status of noninstitutionalized civilian US residents through interviews and physical examinations. The survey examines a nationally representative sample of about 5000 persons each year, and data are released in 2-year cycles (Johnson et al., Reference Johnson, Paulose-Ram, Ogden, Carroll, Kruszan-Moran, Dohrmann and Curtin2013). The dataset used in this study comes from four NHANES cycles, 2007–2008, 2009–2010, 2011–2012 and 2013–2014. This study looks at a subset of the NHANES sample designed to include individuals who would have been targeted by the ACIP recommendations for an HPV catch-up vaccine among females aged 13–26 years. This recommendation was adopted in the June 2006 meeting of the ACIP (Markowitz et al., Reference Markowitz, Dunne, Saraiya, Lawson, Chesson and Unger2007). Our sample includes females who were age 27 years or younger in 2007–2008 NHANES cycle, 29 or younger in 2009–2010, 31 or younger in 2011–2012, 33 or younger 2013–2014, and who were also at least 18-years-old at the time of the survey.
Starting from an initial adult sample size of 24,113, restricting our sample to include only females yields a smaller sample size of 12,370. Further restrictions based on the NHANES cycles and age groups described above yields an even smaller sample of 2355. Finally, we excluded observations of individuals who did not have sex in the last 12 months and who did not remember or did not report necessary characteristics for the model such as their immunization status, their age of first sexual experience, risky behaviors such as smoking and alcohol consumption, or other. These steps resulted in a final sample that contains 991 individuals with 767 (77%) non-vaccinated and 224 (23%) vaccinated for HPV. This corresponds to observation counts from the NHANES cycles of 2007–2008, 2009–2010, 2011–2012, and 2013–2014 that are equal to 157 individuals with 16 vaccinated and 141 non-vaccinated, 257 individuals with 46 vaccinated and 211 non-vaccinated, 273 individuals with 78 vaccinated and 195 non-vaccinated, and 304 individuals with 84 vaccinated and 220 non-vaccinated, respectively. The outcomes under consideration are the number of times a respondent had sex in the last 12 months and the frequency of condom usage during the last 12 months. These outcomes were elicited from respondents in a private room using a self-administered computer-based questionnaire, the Audio Computer Assisted Self Interview system. We focus on these outcomes because they represent relatively minor, or marginal, changes in sexual behavior when compared to other markers of sexual behavior such as acquiring an STI or changing sex partners. In addition, other outcome variables that we considered, such as the number of sex partners and the status of any STIs, were not selected because including them yielded an even more limited analytical sample size.
3.1 Common support
Treatment effects should only be estimated using the subsample of observations where the estimated propensity score overlaps between the treated and control groups (Crump et al., Reference Crump, Joseph Hotz, Imbens and Mitnik2009; Kaiser and Schmid, Reference Kaiser and Schmid2014). These observations are defined as being from the region of common support,  $\hat{p}\in [\hat{\gamma}, 1-\hat{\gamma} ]$. We use an established procedure (Crump et al., Reference Crump, Joseph Hotz, Imbens and Mitnik2009) to estimate the optimal value for
  $\hat{\gamma} $. Since our empirical approach implements two propensity score models, we identify two different values for
  $\hat{\gamma} $, which is 0.085 for the basic propensity model and 0.084 for the expanded propensity model. After dropping observations that did not have common support, the basic propensity model yields a sample that contains 589 (73%) non-vaccinated and 213 (27%) vaccinated individuals (Table 2). The expanded propensity model yields a slightly smaller sample that contains 569 (73%) non-vaccinated and 209 (27%) vaccinated individuals (Table 2).
Table 2. Weighted summary statisticsa of individual characteristics among common support observations from a sample of young women, National Health and Nutrition Examination Surveys 2007–2014

a Summary statistics are weighted to adjust for complex survey design of NHANES and are weighted by inverse probability of treatment weights that correspond to either the Basic or the Expanded propensity model.
IPT refers to inverse probability of treatment; SE refers to standard error.
3.2 Sample balance
Covariate balance between the treatment and control groups is assessed using the normalized difference of means (Table 3). The normalized difference of means is the difference of means across the treatment and control groups divided by the standard deviation of the pooled treatment and control groups. A normalized difference >0.25 can be used as a threshold to identify excessive imbalance across treatment and control groups (Imbens and Wooldridge, Reference Imbens and Wooldridge2009). The sample balance is acceptable for both propensity models. The greatest (absolute value) normalized difference among covariates after balancing with the basic propensity model and the expanded propensity model was 0.042 and 0.106, respectively (Table 3). An acceptable sample balance means that the observed characteristics of the treated and control groups are similar, which makes the inference of an effect of vaccination more plausible.
Table 3. Balance table results after weighting for the inverse probability of treatment, using two propensity models, Basic and Expanded

a Normalized difference is the difference between vaccinated and not vaccinated means, divided by the pooled standard deviation.
b Differences in means between the weighted vaccinated and unvaccinated samples were tested using t-test with p values reported.
REF refers the referent variable of the categorical group of variables.
4. Results
We find no evidence that at least one dose of HPV vaccination contributes to changes in condom usage among young sexually-active women. Looking at the results for condom usage, the estimated ATE is not found to be statistically significant for any of the model specifications considered (Table 4). The direction of the estimated ATE, while not statistically significant, is negative among higher levels of condom usage and among the lowest reported level of condom usage, i.e., for respondents who reported ever using a condom, using a condom more than half of the time, or every time they had sex. Among respondents who reported condom usage half of the time they had sex, the direction of the ATE is less consistent as well as not being found to be statistically significant.
Table 4. Estimated effects on HPV vaccination status with respect to outcome variables on condom usage from a doubly robust estimation procedure
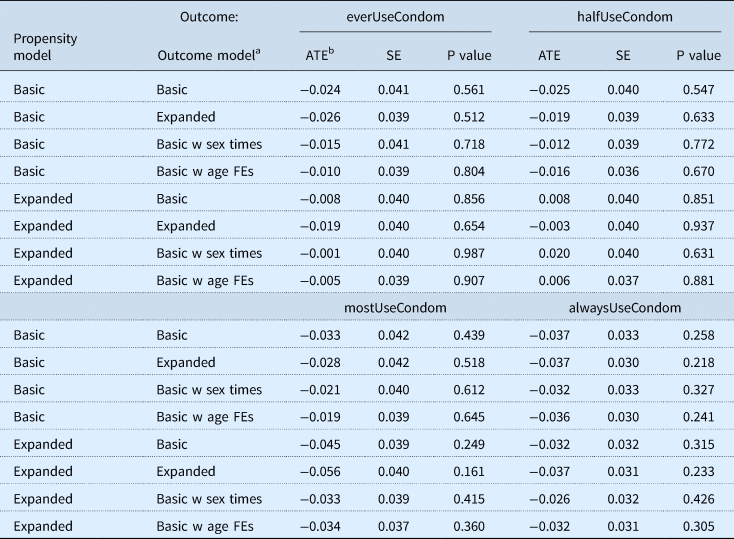
a The basic outcome model includes as covariates: black, hispanic, other, age, gradHighSchool, married, eqOrAbPovLine, anyInsurance, birthControlPills, hivTest, everDrinkAlc, drinksPerDay, smoked100Cigarettes, smokesEveryDay, ageFirstSex, biannualTrend. The expanded outcome model includes as covariates: black, hispanic, other, age, gradHighSchool, gradCollege, married, partnered, eqOrAbPovLine, eqOrAb2xPovLine, eqOrAb3xPovLine, anyInsurance, routineHealth, birthControlPills, hivTest, everDrinkAlc, drinksPerDay, smoked100Cigarettes, smokesEveryDay, everMarijuana, ageFirstSex, year0708, year0910. The basic w sex times outcome model includes all the covariates of the basic model and the following: sexTimesAtLeast12, sexTimesAtLeast52, sexTimesAtLeast104. The basic w age FEs outcome model includes all the covariates of the basic model and indicator variables for each age level in years.
b The average treatment effects were calculated using doubly robust estimator.
HPV refers to human papillomavirus; ATE refers to average treatment effect; SE refers to standard error; FEs refers to fixed effects.
In the models looking at the frequency of sexual encounters, we find inconsistent statistical evidence that at least one dose of HPV vaccination contributes to changes in sexual activity among young sexually-active women (Table 5). This evidence varies across specifications of the propensity and outcomes models. In the majority of the sex frequency models and in particular when the outcome represents whether a respondent had sex more than 52 or 104 times per year, the ATE is not found to be statistically significant. In one subset of models, where the outcome is whether a respondent had sex more than 12 times in the last year, the ATE was found to be statistically significant in several models with an estimate ranging from 0.055 to 0.071, which implies an individual was 5.5–7.1 percentage points more likely to have sex at least 12 times if she received an HPV vaccine. The effect is found to be not statistically significant in one model (Basic-Basic), statistically significant at the 0.10 significance level for three models (Basic-Expanded, Basic-Basic with age fixed effects and Expanded-Basic) and the 0.05 level for two models (Expanded-Expanded and Expanded-Basic with age fixed effects).
Table 5. Estimated effects on HPV vaccination status with respect to outcome variables on frequency of sex, measured as the number of times a person had sex in the last 12 months, using a doubly robust estimation procedure

a The basic outcome model includes as covariates: black, hispanic, other, age, gradHighSchool, married, eqOrAbPovLine, anyInsurance, birthControlPills, hivTest, everDrinkAlc, drinksPerDay, smoked100Cigarettes, smokesEveryDay, ageFirstSex, biannualTrend. The expanded outcome model includes as covariates: black, hispanic, other, age, gradHighSchool, gradCollege, married, partnered, eqOrAbPovLine, eqOrAb2xPovLine, eqOrAb3xPovLine, anyInsurance, routineHealth, birthControlPills, hivTest, everDrinkAlc, drinksPerDay, smoked100Cigarettes, smokesEveryDay, everMarijuana, ageFirstSex, year0708, year0910. The basic w age FEs outcome model includes all the covariates of the basic model and indicator variables for each age level in years.
b The average treatment effects were calculated using double-robust estimator.
HPV refers to human papillomavirus; ATE refers to average treatment effect; SE refers to standard error; FEs refer to fixed effects.
5. Discussion
The most important finding from our study is that at least one dose of HPV vaccination does not appear to have a substantive effect on the sexual behavior of young sexually-active women. This study reinforces the findings of other studies on this topic, which also found negligible changes in sexual behavior following vaccination for HPV (Bednarczyk et al., Reference Bednarczyk, Davis, Ault, Orenstein and Omer2012; Liddon et al., Reference Liddon, Leichliter and Markowitz2012; Smith et al., Reference Smith, Kaufman, Strumpf and Lévesque2014; Jena et al., Reference Jena, Goldman and Seabury2015). The main contribution of our study was the use of a different dataset and a different methodological approach to investigate this issue. This study demonstrates the usefulness of propensity-score-based methods to assess potential behavioral responses to health interventions that could conceivably change health-risk perceptions. The persistence of our result of no discernable effect, in spite of this approach, underscores the need to better understand how individuals process changes in health-risk.
We hypothesized that a small change in perceived health risk could incentivize a proportionally small change in behavior. We also hypothesized that any behavioral response to HPV vaccination would be minor, and would thus best be measured in terms of incremental changes in behavior. For this reason, we focused on two key changes in behavior: condom use and frequency of sex. Given the theoretical grounds for a change in sexual behavior after the availability of the HPV vaccine, several plausible reasons remain as to why an effect cannot be measured in this study. First, even though the HPV vaccine is very effective in preventing adverse health outcomes attributable to HPV, the perceived risk of HPV might be small relative to all other STIs, such as HIV and genital herpes. As a result, the influence of the HPV vaccine on the perceived health risks associated with sexual behavior might be too small to incentivize a change in sexual behavior. Moreover, any change in perceived health risk may be even smaller if recipients of the vaccine were unfamiliar with HPV or the adverse health outcomes associated with HPV.
A previous study of HPV vaccine impact and effectiveness using NHANES data from the early vaccine era (2007–2010) found that the lifetime number of sexual partners appeared to be greater among those who received the HPV vaccine, as compared to those not vaccinated for HPV (Markowitz et al., Reference Markowitz, Hariri, Lin, Dunne, Steinau, McQuillan and Unger2013). This finding was correlational and the study did not assess whether a vaccination leads to changes sexual behavior or whether sexual behavior or expected sexual behavior, leads to decisions about vaccination (Rimer et al., Reference Rimer, Harper and Witte2014). A subsequent study that used NHANES data from a later time period found no statistically significant association between vaccination status and if a respondent had three or more lifetime sexual partners (Markowitz et al., Reference Markowitz, Liu, Hariri, Steinau, Dunne and Unger2016). These studies focused primarily on assessing changes in HPV prevalence in the vaccine era and did not investigate condom usage. A recent study found no association between risk perceptions after HPV vaccination and riskier sexual behaviors (Mayhew et al., Reference Mayhew, Kowalczyk Mullins, Ding, Rosenthal, Zimet, Morrow and Kahn2014). Another study found low levels of knowledge and perceived risks related to HPV and cervical cancer (Denny-Smith et al., Reference Denny-Smith, Bairan and Page2006). These findings support the findings in our study and, taken together, might suggest that the limited awareness or low perceived risk associated with HPV and cervical cancer may at least partially explain the null effect found for HPV vaccination on sexual behavior.
In some model specifications, our study finds a statistically significant treatment effect for respondents reporting having sex more than 12 times in the past year (sexTimesAtLeast12). These effects were statistically significant at the 10% level in three models and at the 5% level in two models. We interpret this result as inconsistent and providing fairly weak statistical evidence for a relationship between vaccination and sexual behavior. However, a plausible explanation for a relationship could be that low levels of sexual frequency, or any other measurements that would reflect sexual inexperience may be more sensitive to changes in sex-related health risks than other outcomes. The other two measures of frequency of sex (>52 and >104 times in the past year) that we investigated might only be able to detect behavioral changes among individuals with more sexual experience, similar to individuals with a higher frequency of sexual encounters, higher numbers of sexual partners, or diagnosis with other STIs. An individual with a greater amount of sexual experience may perceive a smaller change in health risk following an HPV vaccination than an individual who is less experienced sexually. Both the outcome groups investigated in this study, condom use and frequency of sex, were contingent on a respondent having reported having had sex at least one time in the last 12 months. As a result, this study could assess frequency of sexual behaviors, but not assess initiation of sexual activity.
Data from NHANES is published in 2-year cycles, so the exact age in a given year, for example, the age of a respondent at June 2006 is not known with perfect precision. While we designed our sample to include the most individuals who were plausibly in the target age range of the first ACIP recommendation on HPV vaccination, in some cases an individual could be included in our sample who was not subject to the recommendations. As an example, a woman who was 27 in the 2007–2008 NHANES cycle may have turned 27 before the ACIP recommendation was approved in June 2006. We conducted a sensitivity analysis, where the maximum age from each NHANES cycle was reduced by 1 year (26 or younger in 2007–2008 NHANES cycle, 28 or younger in 2009–2010 NHANES cycle, etc.), and this more restrictive age requirement had no qualitative impact on our results. Data analyzed in this study are from respondent reports, and respondents may not have perfect recall regarding their history of vaccinations, sexual activity, or other relevant behaviors. Additional sexual behavior variables, such as the history of STIs and the number of sexual partners, were considered as outcome variables, but these variables were not selected due to relatively lower response rates for those questions compared with the condom use and sex frequency questions, which resulted in analytical samples too small for inference.
Since the exact date of the vaccination is unknown, this analysis does have a potential endogeneity issue, where we cannot ensure the temporality of the assumed causal pattern. At least some number of individuals in our dataset were likely to have received their HPV vaccine in the last 12 months, which would imply that their reported sexual behaviors represent their decisions, circumstances and risk-perceptions prior to receiving the vaccine. The nature of the questions asked in NHANES offers some assurance that the majority of vaccinations occur prior to surveyed sexual activities of the outcomes variables. In particular, the NHANES question about HPV vaccination elicited if a vaccination had ever occurred whereas for the outcome variables the survey elicited behaviors that occurred in the last 12 months. Data from the 2008 to 2014 National Health Interview Surveys indicate that the average annual increase in HPV vaccination coverage among females who were 19–26-years-old in 2007 or 2008 was 13% and may have been as great as 56% of vaccinated individuals, with higher values found among cohorts in earlier survey years (from 2008 and 2009) and among older females (aged 23–26) (O'Halloran et al., Reference O'Halloran, Lu, Williams, Black and Singleton2016). To evaluate this potential source of bias, in the Supplemental Appendix we included sensitivity analyses, where the earlier cycles of NHANES were excluded from the analytical dataset. These sensitivity analyses showed qualitatively similar results as those presented in the main text. In a related issue, any behavioral responses to HPV immunization may occur or may be stronger after having received the complete dosing series of the HPV vaccine. Our study focused on whether a respondent reported receiving at least one dose of an HPV vaccine, not the complete series. Finally, immunization programs and sexual education curriculum can vary across states. These state-level practices may have a strong impact on sexual behavior and any behavior response to receiving a vaccine. Unfortunately, state-level variables are not available in the NHANES public use datasets used in this study. Furthermore, due to the probabilistic sampling method used by NHANES, the number of locations where NHANES data is collected is somewhat small during any given NHANES cycle, so there is unlikely to be substantial variation in any state-level indicators or variables. Investigations into any effect of state-level practices would be a worthwhile area for future research.
In this study, both vaccination status and the sexual behavior outcomes were self-reported. In the case of vaccination status, one previous study found a reasonable amount of concordance between self-reported vaccination status of the HPV vaccine among 18–26-year-olds, when compared to vaccination status documented in electronic health records (Rolnick et al., Reference Rolnick, Parker, Nordin, Hedblom, Wei, Kerby, Jackson, Crain and Euler2013). A number of studies have investigated self-reported condom usage with biological measures of unprotected sexual activity (Rose et al., Reference Rose, DiClemente, Wingood, Sales, Latham, Crosby, Zenilman, Melendez and Hardin2009) and incidence of sexually transmitted diseases (Weir et al., Reference Weir, Roddy, Zekeng and Ryan1999; Gallo et al., Reference Gallo, Steiner, Warner, Hylton-Kong, Peter Figueroa, Hobbs and Behets2007). In general, studies assessing the validity of self-reported condom use found less concordance than was found in the HPV vaccination study. However, the studies on the validity of self-reported condom use investigated populations that were from smaller geographic areas, included adolescents and were at higher risk for STIs, and so may have different self-reporting tendencies than the general population. Possible measurement error stemming from self-reported data is a common limitation among survey-based research, particularly when the survey is conducted across several years and sampled from a nation-wide population.
In spite of these limitations, this study provides empirical evidence on the relationship between HPV vaccination and sexual behavior. With results that comport well with other results in the literature, this study finds no apparent effect of HPV vaccine receipt on the sexual behavior of young sexually-active women.
Supplementary material
The supplementary material for this article can be found at https://doi.org/10.1017/S1744133119000136
Author ORCIDs
Andrew J. Leidner 0000-0001-8869-5561.
Acknowledgements/Disclaimer
The findings and conclusions in this report are those of the authors and do not necessarily represent the views of the Centers for Disease Control and Prevention. The authors would like to thank Alissa O'Halloran, Peng-Jun Lu, Walter Williams, Carla Black, and Jim Singleton for help with vaccine coverage data from NHIS. The authors report they have no financial or personal conflicts of interest to disclose. This study used a publically-available dataset from the National Center for Health Statistics. No ethical review was required. Makram Talih contributed to this work while a full-time employee of the Office of Analysis and Epidemiology, National Center for Health Statistics, CDC.


