


Introduction
The idea of having a cost-effectiveness (CE) ratio as a guide for selecting health care interventions for inclusion in a national health insurance (NHI) scheme has proved controversial. It has a long history (e.g. Weinstein and Zeckhauser, Reference Weinstein and Stason1973; Weinstein and Stason, Reference Weinstein and Zeckhauser1977; Doubilet et al., Reference Doubilet, Weinstein and McNeil1986; Birch and Gafni, Reference Birch and Gafni1992; Laupacis et al., Reference Laupacis, Feeny, Detsk and Tugwell1992; George et al., Reference George, Harris and Mitchell2001; Towse et al., Reference Towse, Pritchard and Devlin2002; Devlin and Parkin, Reference Devlin and Parkin2004; Gafni and Birch, Reference Gafni and Birch2006; Culyer et al., Reference Culyer, McCabe, Briggs, Claxton, Buxton, Akehurst, Sculpher and Brazier2007; Chambers et al., Reference Chambers, Neumann and Buxton2010; Eckermann and Pekarsky, Reference Eckermann and Pekarsky2014; Newall et al., Reference Newall, Jit and Hutubessy2014; Culyer, Reference Culyer2015; Danzon et al., Reference Danzon, Towse and Mulcahy2015a, 2015Reference Danzon, Towse and Mestre-Ferrandizb; Marseille et al., Reference Marseille, Larson, Kazi, Kahn and Rosen2015). It is in practical use in some countries (e.g. Australia, England and Wales). It is advocated by significant agencies in wealthy as well as low- and middle-income countries (LMICs) [e.g. Office of Health Economics, World Health Organisation (WHO)] and is dismissed as arbitrary and politically repressive by others (Nyhan, Reference Nyhan2010). There is misunderstanding about both its meaning and its role in decision making.
This article explains the essential meaning of a CE threshold, using the simple metaphor of a bookshelf. Implications of its use, misuse and non-use are explored. These matters are discussed in the context of decisions by governments and agencies concerning the inclusion or exclusion of health care technologies in public programmes. To keep matters simple, the assumptions made throughout are that insured persons have access to technologies free of charge and that the principal objective of such schemes is to promote population health. The assumption is maintained throughout that ‘effectiveness’ relates to the impact of an intervention on people’s health. This is not to deny that health care systems may have objectives other than health maximisation but to focus on what is undoubtedly a major objective.Footnote 1 The analysis is considered in the context of countries of varying degrees of economic development but the main focus is on LMICs considering how best to advance universal health coverage (UHC) by introducing a public health insurance (PHI) scheme.
What treatments should be included in public insurance schemes?
The WHO defines as ‘essential’ ‘those drugs that satisfy the health care needs of the majority of the population; they should therefore be available at all times in adequate amounts and in appropriate dosage forms, at a price the community can afford’ (2003). This is a curious definition, partly because it contains a value judgement to the effect that such drugs ought to be provided and an ambiguous condition that they be provided only at a price the community in question can afford. In practice, the WHO has a long list of ‘essential’ drugs but leaves it up to local ‘communities’ to determine which ones are to feature on their local list. In practice, then, whether a medicine is ‘essential’, and therefore provided at all times in adequate amounts and appropriate dosages, depends on whether a local community chooses to afford it.
One such community is Tanzania, whose current essential list contains >500 medicines with many controversial drugs on it such as Avastin in addition to Taxol and Paraplatin for treating ovarian cancer, and Lucentis for treating macular eye disease (Tanzania Ministry of Health and Social Welfare, 2013: 279). The first of these is regarded as not cost-effective by the National Institute for Health and Care Excellence (NICE) in England and Wales at ~£144,000 ($206,000)/quality-adjusted life year (QALY) and the second is recommended only if the manufacturer offers substantial discounts (NICE, 2013a, 2013b). They stand, nonetheless, on Tanzania’s list of cost-effective ‘essential’ medicines.
What counts as ‘cost-effective’ that this can be so? Tanzania seems to apply a threshold of acceptability that is even higher than the range recommended by the WHO. The WHO deems an intervention offering a unit of health gain, usually a disability-adjusted life year (DALY) averted, at a cost under three times gross domestic product (GDP) per capita ($7300 in Tanzania) to be ‘relatively cost-effective’ and one with a cost per unit of outcome less than GDP per capita ($2400/capita in Tanzania) to be ‘highly cost-effective’. These are already high, even though in Tanzania they would exclude Avastin if the WHO guidance were to be followed. A currently available estimate of a plausible range for the threshold in Tanzania is $45–912 (Woods et al., Reference Woods, Revill, Sculpher and Claxton2015). The serious (as distinct from tokenistic) adoption of these high thresholds would rapidly exhaust Tanzania’s health budgets, both private and public, and leave many much more cost-effective interventions, with much more impact on the country’s health status per dollar, unfunded.
Why it is so wrong for countries to adopt (mostly implicitly) thresholds that acknowledge too many interventions as being worth having? Why is it wrong for the WHO to recommend very high CE thresholds as criteria for selecting interventions in public insurance systems, especially in poor countries?Footnote 2 And how might one set about selecting a responsible threshold?
The bookshelf
Imagine a bookshelf such as that in Figure 1 – a very long bookshelf – of health care interventions, each like a book, and ranked according to its effectiveness (its height), with the most effective on the left and the less effective stretching away on the right. Some interventions are disease specific, like the cancer treatments just mentioned; some are not disease specific, like interventions to improve childhood nutrition; while others, like community clinics or community health workers, are general delivery platforms or common generic resources available for many diseases and interventions. In all cases, however, we need some acceptable common measure or indicator of the contribution that each intervention makes to health. It must be common, like change in mortality or longevity, or QALYs or DALYs, in order for decision makers to be able to make comparisons of the productivity of each. If they cannot make reasonable comparisons they can hardly make reasonable choices. This may seem a self-evident point. However, nearly all (or at any rate a very large number of) the studies of the effectiveness of interventions for health in LMICs have measures of outcome that ensure comparisons cannot be made.

Figure 1 The range of interventions
Note: NHI=national health insurance.
The fatness of each book represents the estimated cost of providing it. This is a combination of the costs of a specific technology, such as a drug, the costs of associated procedures (other medicines, diagnostic services, community services, etc.) for as long as the treatment continues, and the estimated number of people using the intervention in question. A population health promoter will select the first book on the left and add books (i.e. further interventions) moving along the shelf until the agency runs out of the money the government has allocated to health, or subscribers have subscribed at current insurance premium rates. At that point all the interventions selected will be effective and only the most effective of those that are effective will have been selected. The only services offered under the NHI plan are those to the left. The least cost-effective intervention that is in the plan indicates a threshold of t 0 (Figure 2).

Figure 2 The budget and the effectiveness-cost (EC) threshold
Note: NHI=national health insurance.
Higher productivity per dollar is equivalent to lower cost per unit of health outcome. The numerator here is health or health gain and the denominator cost. The heights of the books on the shelf, in other words, are the reciprocals of the familiar CE ratios in which the numerator is cost and the denominator is health or health gain. To avoid confusion, this reciprocal: effectiveness/cost (EC) (or change in effectiveness/change in cost) is a ratio measured in terms of impact on health rather than money. It will be referred to as the EC ratio or the EC threshold to distinguish it from its sister concept, the CE ratio or the CE threshold.
Why are all effective interventions not in the insured bundle?
The reason why the interventions on the right are not included is not because they are ineffective. On the contrary, they are all effective. One would have to go a long way to the right before hitting zero productivity or slipping into the zone of iatrogenesis. The trouble with them is that they are not effective enough. If the benchmark test for inclusion of further interventions is the CE of the least cost-effective intervention that is included in the plan, t 0, then they are not cost-effective enough either. It immediately follows that merely to demonstrate the effectiveness of an intervention is not enough to ensure its inclusion in the insured bundle. From the viewpoint of population health there are simply better ways of using the budget. Of course, were the budget to be increased, then further interventions could be added, but this takes us into the realm of ‘meso’ CE, in which we have to make a judgement about the costs to other public programmes or to private consumption as resources were switched to health and a further judgement is then required as to their value where they are relative to the value of the expected increase in health if they were switched.Footnote 3 Public health advocates, to be effective, need therefore to demonstrate relative effectiveness. One way of doing this is to make direct comparisons between interventions, such as comparing alternative treatments for cancer or for macular degeneration. A less cumbersome procedure is to use the threshold, and make comparisons with that.Footnote 4
The threshold and the budget are intimately linked
The determinants of the threshold are fundamentally three: the underlying demographics and disease burden, which affects the productivity of interventions (if that rises, the EC threshold t rises – the conventionally defined CE threshold falls); local environments, customs and values (which affect health and commercial behaviours and the very notion of ‘health’ and hence again the productivity of interventions); and the budget (if that were to fall, t rises). In summary, the threshold (whether EC or CE) depends on (a) the productivity of interventions and (b) the size of the budget. We can see this in the figures. First, consider a fall in the budget, ceteris paribus. The budget line moves to the left (from B 0) in Figure 3 and the EC threshold rises to t 1 (CE threshold falls). Now there are fewer types of intervention in the insured bundle.
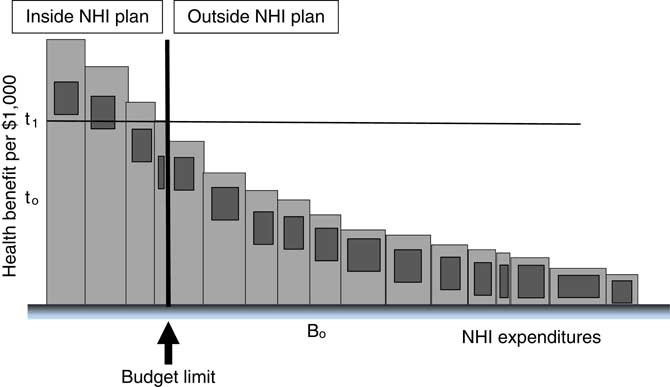
Figure 3 Budget falls and effectiveness-cost (EC) threshold rises
Note: NHI=national health insurance.
Or let the budget rise. The vertical budget line moves to the right from B 1 in Figure 4 and the EC threshold falls to t 2 (the CE threshold rises). The variety of interventions rises.

Figure 4 Budget rises and effectiveness-cost (EC) threshold falls
Note: NHI=national health insurance.
The threshold is not determined only by per capita GDP, which is but one of the determinants, nor is it appropriate to link it in linear fashion to GDP per capita. However, as health care spending has a positive income elasticity, rising incomes enable proportionately higher health budgets and countries with higher incomes to have proportionately higher health spending (see Woods et al., Reference Woods, Revill, Sculpher and Claxton2015, for some multi-country estimates of CE thresholds). One way of looking at the threshold is nonetheless as a demand concept – an implication of a collective willingness to pay for health as expressed by the size of the health budget. This can be contrasted with a supply-side view, which is mentioned later.
Choosing badly kills
The morality of proper use of a threshold comes from its impact on people’s health, which we take as having a moral worth that usually trumps that of non-health objectives of health care systems. If interventions on the right of the threshold are allowed to replace any on its left, population health falls. In Figure 5, books on the shelf have been swapped from either side of the budget line. The cross-hatched area is the loss of life and/or quality of life from having the wrong things in the plan. Decision makers are typically ignorant as to whether they have the right things assigned to either side of the vertical budget line (Eckermann and Pekarsky, Reference Eckermann and Pekarsky2014) but so long as they always replace interventions having lower productivity per dollar with ones that have higher productivity per dollar, they will be moving in the right direction and, if they also ensure that those that are included have a productivity per dollar that is higher than EC t 0, then they can be confident of extracting even more health from their health dollars.

Figure 5 Health loss from poor technology selection
Note: NHI=national health insurance.
There is the converse: if the low-productivity intervention is already in the bundle, then the cross-hatched area represents the health gain from eliminating it and replacing it with the more productive technology on the right. Note, the politically difficult and somewhat counterintuitive fact: disinvestment, even in effective technologies, can increase health.
First best and second best
The analysis has been purposefully simplified. It has been assumed that all decision makers want is to have as great an impact on population health as possible. We have assumed that decisions are taken in and apply for a single accounting period. Another assumption is that each intervention is not internally ranked, as when a procedure is more effective for some types of patient than others, so that some applications of it may be high while others were low in the ranking – and some of them perhaps even lie on the other side of the borderline. Yet, another simplification is that the measure of effectiveness is indifferent to the characteristics of the people who gain or lose: an extra year of life or an extra QALY is of equal value whoever gets it. These are all assumptions that can be addressed in specific situations and modified as necessary.
A simplification having deeper consequences is that all the interventions on the left are more productive than all those on the right. If decision makers are planning ahead for a PHI plan that is yet to be established using consistent health promoting principles and there is no historical encumbrance of bad past decisions, then they can have some confidence that the interventions selected are more cost-effective than those left out. In this case, the assumption is not only descriptively idealistic, it is also realistic. It represents a ‘first best’ situation. It is a commonplace of welfare economics, however, that the resource allocation ‘rules’ derived under such circumstances may not be appropriate when these assumptions do not apply (Lipsey and Lancaster, Reference Lipsey and Lancaster1956). In such cases, the theory of ‘second best’ is required. The same principle applies under health maximisation. If now, the starting point is the historical inheritance of a set of insured interventions whose evidential base was poor or left unexplored, many of which were selected for reasons other than a plausibly demonstrated highly effective impact on population health, then it is evidently more likely for the insured set to include procedures less effective per dollar than some of those excluded, so less health is lost per dollar when they are displaced. It is not the analysis that is second best but the state of the world. The estimated (second best) EC threshold under these circumstances will be lower (the CE ratio will be higher). Put another way, introducing a new intervention into an already established health care package entails, given a constant budget, a greater chance of disinvesting in low-productivity interventions, so the real opportunity cost of new interventions is lower. Put more generally still, the more internally efficient the health system at any given budget, the higher the opportunity cost of additions to the insured bundle.
The empirical work of Claxton et al. (Reference Claxton, Martin, Soares, Rice, Spackman, Hinde, Devlin, Smith and Sculpher2015a, Reference Claxton, Sculpher, Palmer and Culyer2015b) does not make the first best simplifying assumptions but estimates the displacement of interventions, when new ones come in and the budget remains constant, in terms of an estimate of the actual interventions that are dispensed with regardless of their relative productivity. There is no guarantee, for example, that those displaced are the least productive interventions. They may be simply those that are managerially the most convenient in the short run to remove or reduce. However, they indicate the health loss associated with the introduction of a new technology, or its opportunity cost in terms of health. To the extent that this opportunity cost is lower than the loss of the most marginal technology in a first best allocation of the same budget, the second best EC threshold will appear lower than the first best EC threshold [the CE ratio will be higher (Eckermann and Pekarsky, Reference Eckermann and Pekarsky2014)]. This is a supply-side and behavioural approach to the threshold, which gives an estimate that equals the first best threshold only when the system is in ‘equilibrium’ at a health-maximising optimum, and the least cost-effective technologies are relatively easy to identify. The method is likely to yield an estimate of opportunity cost (health lost) lower than under the first best allocation of the same budget – how much of an underestimate will depend on the ability of health service commissioners (purchasers) and managers to identify the least cost technologies that lie within their discretion to eliminate. More importantly, the second best threshold is the appropriate one to use in decisions about revising the content of an established insured bundle as it embodies an estimate of the actual opportunity cost. A specific value of this approach is that, data permitting, it enables decision makers to identify with some degree of precision which interventions may be eliminated at least cost in terms of their contribution to population health.
The implication that the second best CE threshold will typically be higher than the first best threshold (the second best EC threshold lower than the first best EC threshold) should not obscure the fact that an actual CE threshold in use may be too high. For example, Claxton et al. (2015b) suggest quite strongly that the actual thresholds used by NICE in England and Wales are too high.
Orphan diseases and an ethical dilemma
Finally, it has also been assumed that making a maximum impact on health is the only objective of NHI or UHC. That is obviously not true. One ought at least to add in equity, or distributive fairness and financial protection, as other criteria. However, these complications would clutter the ability of the simple model to yield insights. In particular, decision makers need to be alert to the implication that any departure from the bookshelf principle on whatever grounds costs lives, or at least the quality of lives. Departures need, therefore, a strong ethical case.
Suppose that the reason for swapping the two books in Figure 5 lay in the distributional characteristics of each: perhaps the low-productivity intervention is a very costly but not very effective treatment for an orphan disease. One has natural humanitarian empathy with patients suffering from diseases like cystic fibrosis, muscular dystrophy, Gaucher’s disease, Huntingdon’s disease, Hunter’s Syndrome or Pompe’s disease. But decision makers need to be clear that in replacing a more productive intervention with the orphan treatment, they are causing others to lose lives – or the quality of lives, or both. That may be an acceptable trade-off but a trade-off it is and one ought not to imagine that attending to other health policy priorities than having the maximum impact on health comes cheap. It is often thought that it is humanitarian to support expensive but not very effective interventions for people with orphan diseases – but it seems not at all humanitarian if to do so mindlessly ignores the health losses imposed on others. This is not to suggest that decision makers ought to lack sympathy for hard cases, only that they should not ditch logic in exercising their sympathy. What is especially tricky about such cases is also that the identity, or at least the characteristics, of a proposed favoured minority group (the orphan disease victims) is known, whereas that of those who lose, whose services are no longer provided from the fixed budget, is not. They are usually anonymous and easily overlooked. So a further ethical question thus arises are costs falling on invisible people to be ignored or given a lower weight by virtue of their invisibility? They may even be people with whom decision makers would have no less sympathy than the sympathy they have for those with orphan diseases.
The threshold in LMICs
One of the sad truths about health and health care in LMICs is that policy makers are constantly bombarded with claims – many from health economists and public health physicians – for the inclusion of interventions whose only virtue is that they are effective. Childhood interventions, particularly vaccinations, often provide greatest value. In sub-Saharan Africa, for example, rotavirus vaccination has been associated with a cost per DALY averted of $43 (Atherly et al., Reference Atherly, Dreibelbis, Parashar, Levin, Wecker and Rheingans2009) and treatment of severe malnutrition costs $53/DALY averted (Bachmann, Reference Bachmann2010). Even within HIV, prevention of mother-to-child HIV transmission costs below $150/DALY averted using available interventions (Shah et al., Reference Shah, Johns, Abimiku and Walker2011). All of these are likely to be cost-effective choices for countries like Tanzania, yet a large coverage gap remains across all LMICs (UNAIDS, 2013; Revill et al., Reference Revill, Walker, Madan, Ciaranello, Mwase, Gibb, Claxton and Sculpher2015). These high-impact and highly cost-effective interventions are seriously under-provided, while advocates routinely make recommendations on the basis of excessively high CE thresholds, or none at all, aiming to promote access in poor communities to new and more expensive therapies with CE ratios 100 times worse than these (Chisholm et al., Reference Chisholm, Baltussen, Evans, Ginsberg, Lauer, Lim, Ortegon, Salomon, Stanciole and Tan-Torres Edejer2012; Ortegon et al., Reference Ortegon, Lim, Chisholm and Mendis2012).
What then are the consequences of trying to apply such thresholds?
A CE threshold that is too high is an effectiveness per dollar threshold that is too low. We can see what is likely to happen by returning to the bookshelf. In Figure 6, there is the same array of books as before, for which the EC threshold was t 0. Setting the EC threshold at t low is appropriate for a health budget much larger than the one in the figure. It will admit into the insured bundle the additional interventions shown by the arrows. What will happen? In the absence of a further, more rational criterion (e.g. a supplementary EC threshold of t 0), the outcome is likely to be an arbitrary set of interventions. In an extreme case, the most productive interventions will be replaced by the least productive ones. That is shown by the cross-hatched area in Figure 6. An arbitrary selection of the CE threshold, which is typically too high (too low in terms of an EC threshold), loses lives.

Figure 6 Effectiveness-cost (EC) threshold too low for the given budget
Note: NHI=national health insurance.
The contrary phenomenon will occur when the EC threshold is set too high for the budget (the CE threshold is too low). This is shown in Figure 7. With t high and the budget as before, all the technologies indicated by the arrows are omitted from the insured package with the consequential loss of life and quality of life shown by the cross-hatched area. The offence to health is compounded by the needless holding back of available funding.
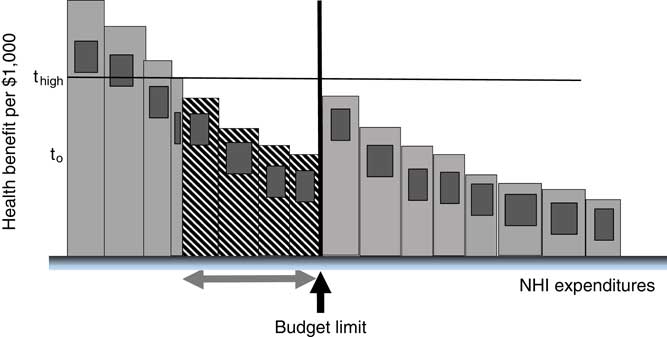
Figure 7 Health loss from effectiveness-cost (EC) threshold too high
Note: NHI=national health insurance.
Asymmetries in investing and disinvesting
One ought not to underestimate the problems, mainly political, of pressures to invest in interventions that are too costly and that drive out those that are more cost-effective. An intervention that is adopted generates incomes for its manufacturers, its prescribers and is usually gratefully received by its patients. It has a massive interest already vested in it. The same is less true of those that have yet to be approved, which are in direct competition with others yet to be approved, where all the gains are as yet prospective and not as yet vested. It nonetheless remains that the threshold is what marks the boundary between the more and the less cost-effective treatments, given a particular planned rate of expenditure on health care. Any other threshold is harmful to health, notwithstanding the interests (doubtless very vocal) that may be vested in it.
The ‘second best’ threshold is, however, indisputably hard to estimate, even approximately. Unfortunately, it is also tremendously easy to propose aspirational (Revill et al., Reference Revill, Walker, Madan, Ciaranello, Mwase, Gibb, Claxton and Sculpher2015) thresholds that are far too high. These thresholds all implicitly assume that the fraction of GDP that should go on health and health care is much larger than it actually is. They are an implicit form of advocacy, telling poor countries that they ought to spend more on health (and less on other things – not usually specified by the advocates) and, or, telling the rich countries they should be spending more to help the poor countries and less on other things (again, usually unspecified). The problem with CE thresholds that are too high is that they define as cost-effective, or even highly cost-effective, treatments that, if implemented, would more than exhaust the available budget and crowd out treatments that deliver more health gain per dollar. At best, they can provide a kind of ‘long list’ of interventions for further consideration. One therefore needs a more realistic supplementary CE threshold to select from the long list: one that is realistic given the circumstances and budget of the country in question. But then why bother with the long list in the first place? The basic truth is that in setting the budget in any country decision makers thereby also set the threshold, or in setting the threshold they imply the budget. They ought never to set the one without realising that in so doing they imply the other.
Multiple thresholds?
Some jurisdictions may in the short term have more than one threshold (Danzon et al., Reference Danzon, Towse and Mestre-Ferrandiz2015b). For example, South Africa has in essence two parallel systems: the private insurance/private provision sector and the public insurance/public provision one. In the short term, it makes sense to set a CE threshold for the public sector that is lower than the one implicitly or explicitly set for the private sector. The main challenge then becomes how best to manage the harmonisation of the two over time. (A further significant challenge is how to explain the rationale for dual thresholds to the public and professionals). Tanzania might prudently set a specific threshold for its ‘essential’ drugs list while it searches for a more general threshold for system-wide application, and a method again of harmonising the two over time. Some LMICs could have multiple thresholds to reflect the reality that donor funding, for example, has focussed on specific disease areas like malaria or HIV/AIDS, where the marginal productivity of disease-specific interventions per dollar has fallen below that of other forms of intervention (say, nutrition). The point in having multiple thresholds is to avoid, not to perpetuate, investments that are not having the greatest possible impact on population health, by identifying where the best pay-offs lie and to signal the necessary shifts in resource allocation.
Differential weights on outcomes and the threshold
The standard application of the principle of horizontal justice requires that people who are alike in some ethically relevant sense be treated alike. There has arisen a concern in some quarters for departing from the usual assumption that a ‘QALY is a QALY is a QALY’ in favour of weighting QALYs received by those near the end of life more heavily (Paulden et al., Reference Paulden, O’Mahony, Culyer and McCabe2014; Claxton et al., Reference Claxton, Martin, Soares, Rice, Spackman, Hinde, Devlin, Smith and Sculpher2015a, Reference Claxton, Sculpher, Palmer and Culyer2015b; McCabe et al., Reference McCabe, Paulden, O’Mahony, Edlin and Culyer2015). Making such adjustments, whether on these grounds or any other, has implications for the threshold itself. Paradoxically, increasing the weight attached to particular technologies in order for them to pass the threshold test can also increase the threshold itself. Take the end-of-life case. A candidate technology is particularly to be used for patients near the end of their lives. Supposing closeness to death to be the only ethically relevant differentiating feature, then ethical consistency requires that all end-of-life cases receive similar weights, including those receiving treatments that are already in the insured bundle. Suppose further that the weighting accorded the candidate technology is sufficient for it to fall below the existing CE threshold. The impact on the threshold depends upon the distribution of end-of-life patients across the technologies in the insured bundle. If they are users of the least productive (the marginal) technology in the bundle, then its effective (weighted) productivity also increases and the CE threshold therefore falls. If it increases sufficiently relative to the next most productive technology, that technology may become the marginal treatment, to be displaced in whole or in part by the new technology. If, on the other hand, such patients are distributed across the inframarginal technologies in the bundle, then the marginal technology remains unchanged and so does the threshold. The candidate technology displaces the end-of-life use of a number of technologies.
The point is that, whatever the merits or otherwise of favouring such groups in considering the introduction of new interventions, similar groups exist elsewhere within the same health care system and are actually receiving current treatments for other conditions. The consequences for them as they are denied services will need normally to be taken into account on grounds of ethical consistency. A judgement has therefore to be reached as to the distribution of such patients across existing insured treatments and the consequential quantitative impact of the differential weights on the threshold.
What is my threshold?
Failure to set a threshold, whether or not it is publicly declared, can have similar consequences to setting one that systematically admits too many low-productivity interventions. If jurisdictions deliberately fail to use a threshold they should probably stop pretending that that they are trying to have the maximum impact on their people’s health. Many countries are shy about being explicit about thresholds (Canada, the United States). Federal structures are easily capable of permitting the simultaneous existence of multiple thresholds (one for each province or state or public programme), mostly implicit rather than explicit. All are ways of ensuring that population health is not maximised.
One way of avoiding setting thresholds aspirationally is to ‘threshold search’ (Culyer et al., Reference Culyer, McCabe, Briggs, Claxton, Buxton, Akehurst, Sculpher and Brazier2007) by identifying the least cost-effective intervention currently provided and the most cost-effective intervention not yet routinely available. This approach might be suited to a two- or multi-threshold country. There are a reasonable number of available economic evaluations that are probably generalisable and applicable in most jurisdictions. One might investigate the CE of interventions falling just inside and just outside the insured bundle in various jurisdictions and triangulate towards a reasonable approximation to ‘second best’ threshold. Yet another approach, appropriate for countries with very low public expenditures, is to proceed pragmatically with self-evidently cost-effective programmes, with scaling-up determined judgementally, but evaluating each scale-up and each newly added intervention so that over, say, a five-year period sufficient information became available about the CE of the programmes being supported and the pressure on budgets. The CE of the least cost-effective programme being supported then becomes a provisional threshold and new programmes with lower CE would not be recommended.
Another possibility is to conduct low-cost small-scale pilot studies of prima facie highly cost-effective interventions that could then be scaled-up or not as and when their efficiency is confirmed or disconfirmed. The Thais have been good at this (e.g. Teerawattananon et al., Reference Teerawattananon, Leelukhanaveera, Hanvoravongchai, Thavorncharoensap, Ingsrisawang, Tantivess, Chaikledkaew, Hiransuthikul and Leartpiriyasuwat2009, Reference Teerawattananon, Chaw-Yin, Wongkittirux, Teerawattananon, Chinkulkitnivat, Orprayoon, Kusaku, Tengtrisorn and Jenchitr2014).
Yet, another approach is to estimate the productivity of health care expenditure across countries. Multi-country panel data show that health outcomes improve as countries increase spending on health care, although at a diminishing rate. Understanding this relationship could indicate which interventions are likely to increase or reduce productivity in the health sectors of different jurisdictions with particular levels of resources and health care needs.
The most complete approach, where the data exist to implement it, is the supply-side method developed by Claxton et al. (Reference Claxton, Martin, Soares, Rice, Spackman, Hinde, Devlin, Smith and Sculpher2015a, Reference Claxton, Sculpher, Palmer and Culyer2015b). This econometric work does not make the simplifying assumption that no technology in use has a lower productivity than the threshold, and exploits the existence of programme budgets in the National Health Service. These cover 23 budgets. Differences in them can be linked to differences in mortality and, with some further assumptions, to QALYs. The central estimate of the CE threshold using this method for 2008 expenditure and 2008–2010 mortality was £12,936/QALY, well below the threshold range of £20–30k used by NICE.
Aiding not replacing thought and judgement
However, perfect precision is not in general required. What is needed is an understanding of the meaning of the threshold and some idea of its likely order of magnitude in any given context. The purpose of this information is to inform thought and judgement, not to replace either. The epidemiological science is always contestable, the endpoints of trials are rarely far enough off, what is demonstrably efficacious may not be effective, the coverage of costs is often incomplete, substantial uncertainty attaches to many key variables, full scientific consensus is rare. The CE of most interventions (inside and outside an insured bundle) remains conjectural. The evidence therefore never speaks for itself. In any case, judging what to include in the insured bundle cannot be solely based on evidence, even if it is good evidence (Culyer, Reference Culyer2014), because a decision also depends upon the objectives set for the health care system and on the value judgements embodied in the criteria for including or excluding treatments in or from the insured bundle (Rawlins and Culyer, Reference Rawlins and Culyer2004). But aids to better judgement are valuable, provided they are understood and the science supporting them is honest science. They are valuable, not only because they increase the chance that good decisions will be made but also because they nearly always involve the participation of others than ‘experts’, thereby gaining public credibility, and because the process of exercising one’s judgement, provided it is not conducted in secrecy, can be publicly defended and can lead to a public media and a citizenry that also understands and judges in an informed way.
Summary
We started with the simple idea that more health is a good thing and then showed that to achieve more health:
-
∙ it must be possible to compare interventions in terms of their impact on a common measure of health;
-
∙ mere effectiveness is not a persuasive case for inclusion in public insurance plans;
-
∙ public health advocates need to address issues of relative effectiveness if they are to be more effective advocates for public health;
-
∙ a ‘first best’ EC benchmark or threshold ratio of health gain to expenditure identifies the least effective intervention that should be included in a public insurance plan;
-
∙ the reciprocal of this ratio – the CE threshold – will rise or fall as the health budget rises or falls (ceteris paribus);
-
∙ setting thresholds too high or too low costs lives;
-
∙ failure to set a threshold also involves avertable deaths and morbidity;
-
∙ the threshold cannot be set independently of the health budget;
-
∙ what is cost-effective in one jurisdiction may be cost-ineffective in another (depending on the budget, local prices and costs, disease burden and local values);
-
∙ the threshold can be approached from either the demand side or the supply side;
-
∙ the two are equivalent only in a health-maximising equilibrium;
-
∙ the supply-side approach generates an estimate of a ‘second best’ CE threshold that is higher than the ‘first best’ CE ratio;
-
∙ the ‘second best’ threshold is the one generally to be preferred in decisions about adding or subtracting interventions in an established public insurance package;
-
∙ multiple thresholds are implied by systems having distinct and separable health budgets;
-
∙ disinvestment involves eliminating effective technologies from the insured bundle;
-
∙ differential weighting of beneficiaries’ health gains may affect the threshold;
-
∙ anonymity and identity are factors that may affect the interpretation of the threshold.
Finally, and implicitly throughout, the true opportunity cost of health care in a community, where the effectiveness of interventions is determined by their impact on health, is not to be measured in money – but in health itself.
Acknowledgements
An earlier version of this paper was given as the 2015 Emmet Hall Lecture at the Montreal meeting of the Canadian Association of Health Services and Policy Research.
The author’s thanks for comments on this and preceding papers with a closely related theme are due to: John Appleby, Kalipso Chalkidou, Karl Claxton, Richard Edlin, Karen Hofman, Chris McCabe, James F. O’Mahony, Adam Oliver, Mike Paulden, Paul Revill, Mark Sculpher, Eldon Spackman, Yot Teerawattananon, Adrian Towse, Walter Wodchis and Michael Wolfson.


