


1. Introduction
During orogenic processes, crustal anatexis shows a close spatial and temporal association with high-grade metamorphism (Williams, Buick & Cartwright, Reference Williams, Buick and Cartwright1996; McLaren, Sandiford & Hand, Reference McLaren, Sandiford and Hand1999; Oliver et al. Reference Oliver, Nemchin, Bodorkos and Kinny1999; Montero et al. Reference Montero, Bea, Zinger, Scarrow, Molina and Whitehouse2004; Castiñeiras et al. Reference Castiñeiras, Villaseca, Barbero and Martín Romera2008). Crustal anatexis is generally represented by the formation of migmatites or the presence of granitic intrusion. Migmatite commonly consists of mesosomes and leucosomes, with the latter formed by partial melting of high-grade metamorphic assemblages (Brown, Reference Brown1973, Reference Brown2001; Sawyer, Reference Sawyer2008). The extraction of leucosome from source rocks marks the initiation of crustal anatexis that is commonly followed by leucogranite intrusion (e.g. Johannes et al. Reference Johannes, Ehlers, Kriegsman and Mengel2003; Hinchey & Carr, Reference Hinchey and Carr2006; Alfonso, Raúl & Márcio, Reference Alfonso, Raúl and Márcio2013). Thus, migmatites, especially the leucosomes, play an important role in understanding the tectonic evolution of large-scale orogenic belts.
The early Palaeozoic orogen in South China is a major orogenic belt in East Asia that formed at a similar time to the classic Caledonian orogeny in Europe (Z. X. Li et al. Reference Li, Li, Wartho, Clark, Li, Zhang and Bao2010). This early Palaeozoic orogenic belt covers the SE part of the South China Block and extends for c. 2000 km in a northeasterly direction (Liu et al. Reference Liu, Zhou, Zhang, Zhong, Zeng, Xiang, Jin, Lu and Li2010a). Despite decades of research, there has been no consensus on the tectonic setting and geodynamic mechanism for formation of this orogen (Shu et al. Reference Shu, Yu, Jia, Wang, Shen and Zhang2008; Faure et al. Reference Faure, Shu, Wang, Charvet, Choulet and Monié2009; Z. X. Li et al. Reference Li, Li, Wartho, Clark, Li, Zhang and Bao2010; Y. J. Wang et al. Reference Wang, Zhang, Fan, Zhang, Zhang and Zhang2011, Reference Wang, Wu, Zhang, Fan, Zhang, Zhang, Peng and Yin2012, Reference Wang, Zhang, Fan, Zhang and Zhang2013b,c; Zhao & Cawood, Reference Zhao and Cawood2012; Zhang et al. Reference Zhang, Santosh, Zhu, Chen and Huang2014b; Lin et al. Reference Lin, Xing, Ying, Li, Davis, Davis, Chen, Jiang and Chen2015). Some researchers emphasize the existence of a Neoproterozoic–Palaeozoic ocean between the Yangtze and Cathaysia blocks and have invoked an early Palaeozoic arc–continent collision following northwestward subduction of the intervening oceanic lithosphere to explain the orogenic event (e.g. Guo, Shi & Lu, Reference Guo, Shi and Lu1989; Ma, Reference Ma2006). However, the validity of this model has been questioned by others due to the absence of early Palaeozoic ophiolite suites, deep-sea sedimentary rocks and arc magmatism (e.g. Shu, Reference Shu2006; Shu et al. Reference Shu, Yu, Jia, Wang, Shen and Zhang2008; Yi et al. Reference Yi, Ma, Wang, Lai, Li, Yang, Wu and Hu2014). Alternative models, in which the Yangtze and Cathaysia blocks are interpreted to have been amalgamated since the Neoproterozoic, suggest that this orogeny was an intraplate one (e.g. Charvet et al. Reference Charvet, Shu, Shi, Guo and Faure1996; Z. X. Li et al. Reference Li, Li, Wartho, Clark, Li, Zhang and Bao2010; Wang et al. Reference Wang, Zhang, Fan, Zhang, Zhang and Zhang2011; Shu et al. Reference Shu, Jahn, Charvet, Santosh, Wang, Xu and Jiang2014; Yu & Shu, Reference Yu and Shu2016), or was a continent–continent collisional event between the Cathaysia Block and a postulated continent that has since moved away from South China (Zhao & Cawood, Reference Zhao and Cawood2012; Zhang et al. Reference Zhang, Holtz, Koepke, Berndt and Ma2014a; Chen et al. Reference Chen, Tong, Zhang, Zhu and Li2015; Lin et al. Reference Lin, Xing, Ying, Li, Davis, Davis, Chen, Jiang and Chen2015). Previous studies mainly focused on the early Palaeozoic high-grade metamorphism and granitic magmatism (e.g. Wang et al. Reference Wang, Zhang, Fan, Zhang, Zhang and Zhang2011; Zhao et al. Reference Zhao, Zhai, Zhou, Santosh and Ma2015b). Little attention has been paid to the migmatites that occur mostly in the eastern part of this orogen.
In this article, we present U–Pb ages, trace element and Hf isotope compositions of zircons from the migmatites in the Chencai complex in the Cathaysia Block, aiming at providing constraints on the early Palaeozoic orogeny of South China.
2. Geological setting
The South China Block consists of the Yangtze Block in the NW and the Cathaysia Block in the SE, separated by the Jiangshan–Shaoxing fault zone (JSF) (Fig. 1a). The Yangtze Block is considered to have an Archaean–Palaeoproterozoic crystalline basement surrounded by late Mesoproterozoic to early Neoproterozoic folded basement rocks, which are unconformably overlain by Neoproterozoic to Sinian cover sequences (Qiu et al. Reference Qiu, Gao, McNaughton, Groves and Ling2000; Zhang et al. Reference Zhang, Zheng, Wu, Zhao, Gao and Wu2006; Gao et al. Reference Gao, Jie, Lian, Li, Hu, Guo, Yuan, Gong, Xiao and Wei2011; L. M. Li et al. Reference Li, Lin, Davis, Xing, Xiao and Yin2014; J. H. Li et al. Reference Li, Dong, Zhang, Zhao, Johnston, Cui and Xin2016). The Cathaysia Block mainly consists of Palaeoproterozoic and Neoproterozoic rocks without the occurrence of Archaean rocks (Yu et al. Reference Yu, O'Reilly, Wang, Griffin, Zhou, Zhang and Shu2010, Reference Yu, O'Reilly, Zhou, Griffin and Wang2012; L. M. Li et al. Reference Li, Sun, Wang, Xing, Zhao, Cai and Zhang2011a; Xia, Xu & Zhu, Reference Xia, Xu and Zhu2012; Zheng, Xiao & Zhao, Reference Zheng, Xiao and Zhao2013). It is generally believed that the Yangtze Block and the Cathaysia Block were amalgamated along the Jiangnan orogen, with the proposed timing of collision varying from late Mesoproterozoic to middle Neoproterozoic (e.g. X. H. Li et al. Reference Li, Li, Ge, Zhou, Li, Liu and Wingate2003; Z. X. Li et al. Reference Li, Wartho, Occhipinti, Zhang, Li, Wang and Bao2007; X. L.Wang et al. Reference Wang, Zhou, Griffin, Wang, Qiu, O'Reilly, Xu, Liu and Zhang2007, Reference Wang, Zhou, Griffin, Zhao, Yu, Qiu, Zhang and Xing2014; W. X. Li et al. Reference Li, Li, Li and Lou2008; L. M. Li et al. Reference Li, Sun, Wang, Xing, Zhao, He, He and Zhang2011b, Reference Li, Lin, Xing, Davis, Davis, Xiao and Yin2013a,b, Reference Li, Lin, Xing, Davis, Jiang, Davis and Zhang2016; Zhao et al. Reference Zhao, Zhou, Yan, Zheng and Li2011; Y. J. Wang et al. Reference Wang, Zhang, Cawood, Zhang, Fan and Zhang2013a; Dong et al. Reference Dong, Zhang, Gao, Su, Liu and Li2015; Zhao, Reference Zhao2015). After the amalgamation, the coherent South China continent underwent significant rifting, generating the Nanhua rift basin (Wang & Li, Reference Wang and Li2003; Charvet, Reference Charvet2013). The basin was closed by an early Palaeozoic orogenic event, as indicated by a regional angular unconformity at the bottom of upper Devonian, and significant Ordovician to Silurian, magmatism and metamorphism in the Cathaysia Block (e.g. Huang, Reference Huang1977; Shu et al. Reference Shu, Lu, Jia, Charvet and Faure1999, Reference Shu, Yu, Jia, Wang, Shen and Zhang2008; Faure et al. Reference Faure, Shu, Wang, Charvet, Choulet and Monié2009; Charvet et al. Reference Charvet, Shu, Faure, Choulet, Wang, Lu and Breton2010; Liu et al. Reference Liu, Zhou, Zhang, Zhong, Zeng, Xiang, Jin, Lu and Li2010a; Z. X. Li et al. Reference Li, Li, Wartho, Clark, Li, Zhang and Bao2010; L. M. Li et al. Reference Li, Sun, Wang, Xing, Zhao, Lin, Xia, Chan, Zhang and Wong2011c).
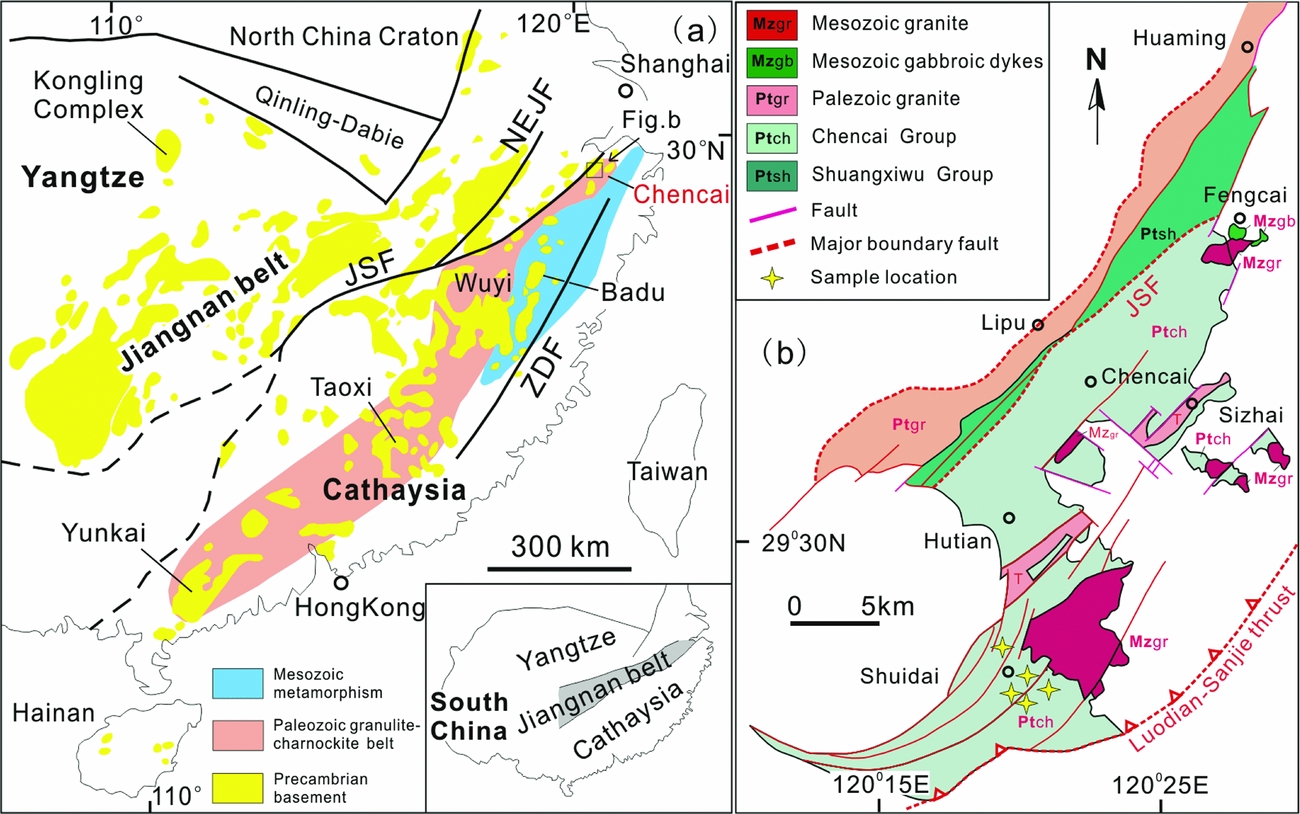
Figure 1. (a) Simplified geological map of South China showing the Precambrian basement. This map is modified after Zhao & Cawood (Reference Zhao and Cawood2012) and Zhao et al. (Reference Zhao, Zhai, Zhou, Santosh and Ma2015b). (b) Simplified geological map of the Chencai region showing the locations of the migmatites.
The Chencai complex is located in the northeastern Cathaysia Block (Fig. 1b). The Chencai Group, as the most extensively exposed unit in the complex, is divided into four formations from the base upwards: the Daojiuwan Formation, the Xiahetu Formation, the Xiawuzhai Formation and the Xu'an Formation (Kong et al. Reference Kong, Li, Feng, Gu and Ma1995). It mainly consists of gneiss, garnet–muscovite schist, amphibolites, mafic granulite and marble, and is interpreted as a fore-arc accretionary complex by Gao et al. (Reference Gao, Jie, Lian, Li, Hu, Guo, Yuan, Gong, Xiao and Wei2011). Previous structural and metamorphic studies indicate that these rocks predominantly dip steeply (>60°) to the SE, and have undergone amphibolite-facies metamorphism and anatexis (Z. X. Li et al. Reference Li, Li, Wartho, Clark, Li, Zhang and Bao2010; Zhao et al. Reference Zhao, Zhai, Zhou, Santosh and Ma2015b).
Migmatization is pervasive in the Chencai complex. Migmatites for this study were sampled from the Shuidai area (Figs 1b and 2). Most leucosomes are laterally continuous and developed parallel to the gneissic foliation. Some are discontinuously distributed and formed as irregular patches or lenses. A few leucosomes occur at dilatant sites outlining boudin-like patterns. The discontinuous leucosomes and those located at dilatant sites are commonly coarser-grained than leucosomes parallel to the foliation. Their field relationships with country rocks are shown in Figure 2. The mineral assemblages of the migmatites are biotite, quartz, amphibole, plagioclase and garnet (Fig. 3).

Figure 2. Photographs illustrating field occurrence of the migmatites of the Chencai complex.
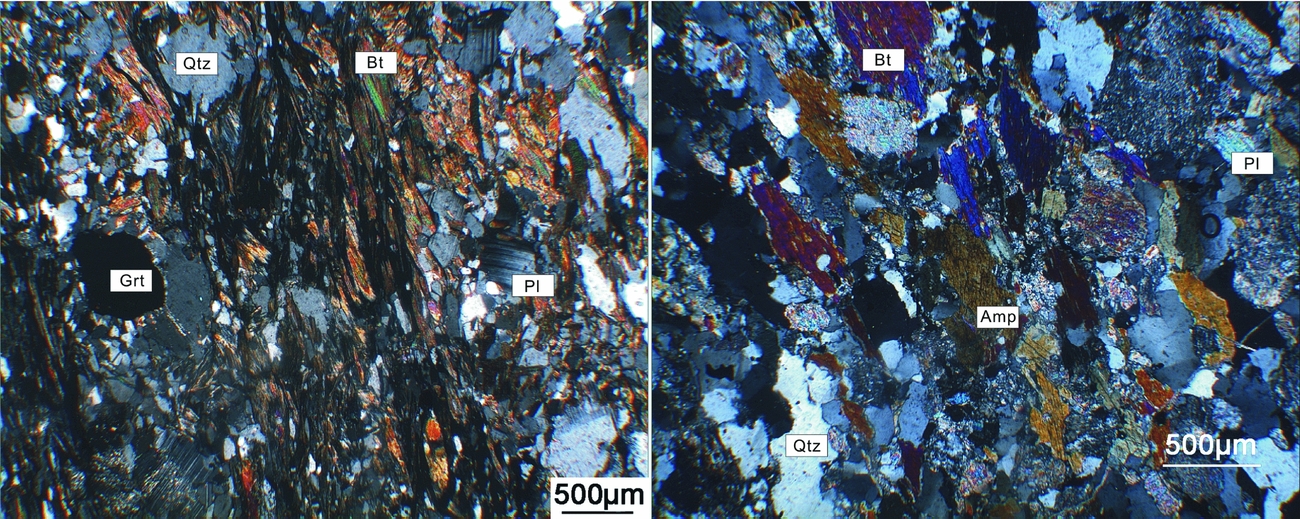
Figure 3. Photomicrographs showing representative mineral assemblages of the migmatites.
3. Analytical methods
Representative samples were selected for zircon U–Pb dating. Zircon concentrates were separated using standard density and magnetic separation techniques. Zircon grains were embedded in a polished epoxy mount and imaged by cathode luminescence (CL). CL images were used to select areas for U–Pb analyses, preferentially targeting primary, uniform crystal domains and avoiding cracks and alteration.
Zircon U–Pb isotopic determination for two samples was performed by Secondary Ion Mass Spectrometry (SIMS) using a CAMECA IMS1280-HR system at the SKLaBIG (State Key Laboratory of Isotope Geochemistry) of the Guangzhou Institute of Geochemistry, Chinese Academy of Sciences. The analytical procedure is similar to that described by X. H. Li et al. (Reference Li, Liu, Li, Guo and Chamberlain2009). A long-term uncertainty of 1.5% (1 RSD) for 206Pb/238U measurements of the standard zircons was propagated to the unknowns (X. H. Li, et al., 2010a), although the measured 206Pb/238U error in a specific session is generally c. 1% (1 RSD) or less. U and Th concentrations of unknowns were also calibrated relative to the standard zircon Plesovice, with Th and U concentrations of 78 and 755 ppm, respectively (Slama et al. Reference Slama, Kosler, Condon, Crowley, Gerdes, Hanchar, Horstwood, Morris, Nasdala, Norberg, Schaltegger, Schoene, Tubrett and Whitehouse2008). Measured compositions were corrected for common Pb using non-radiogenic 204Pb. Common Pb is very low, and is largely derived from laboratory contamination introduced during sample preparation. An average of present-day crustal composition (Stacey & Kramers, Reference Stacey and Kramers1975) is used for the common Pb. A secondary standard zircon Qinghu (X. Li et al., Reference Li, Lin, Xing, Davis, Davis, Xiao and Yin2013b) was analysed as unknown to monitor the reliability of the whole procedure. Five analytical spots conducted during the course of this study yield a concordia age of 159.2 Ma, identical to its recommended value. The U–Pb analytical results are given in Table 1. Uncertainties on single analyses are reported at the 1σ level; mean ages for pooled U–Pb analyses are quoted at the 95% confidence level. Data reduction was carried out using the Isoplot/Ex 3 software (Ludwig, Reference Ludwig2003).
Table 1. Zircon SIMS U–Pb ages for migmatites from Chencai complex in NE Zhejiang province, SE China

Zircon U–Pb isotopic determination for three samples was carried out using laser ablation – inductively coupled plasma – mass spectrometry (LA-ICP-MS) at the School of Resources and Environmental Engineering, Hefei University of Technology (HFUT). A pulsed 193 nm ArF Excimer (COMPex PRO) with laser power of 10 mJ cm−2 pulse energy at a repetition ratio of 6 Hz coupled to an Agilent 7500a quadrupole ICP-MS was used for ablation. Helium was used as carrier gas to provide efficient aerosol transport to the ICP and minimize aerosol deposition. The diameter of the laser ablation crater was 32 μm. Zircon 91500 was used as an external standard to normalize isotopic fractionation during isotope analysis. NIST610 glass was used as an external standard to normalize U, Th and Pb concentrations of the unknowns. Meanwhile, standard sample Mud Tank (Black & Culson, Reference Black and Culson1978) was used as an isotopic monitoring sample. The detailed analytical procedure can be found in Yuan et al. (Reference Yuan, Gao, Dai, Zong, Günther, Fontaine, Liu and Di Wu2008). The ICPMS DataCal program (Liu et al. Reference Liu, Hu, Zong, Gao, Gao, Xu and Chen2010b) was used for processing the Pb isotopic data, U–Pb ages and U–Th contents of the zircon analysis spots. Common Pb was corrected according to the method proposed by Anderson (Reference Anderson2002). The analytical results are reported with 1σ error (Table 2). The weighted mean U–Pb ages were reported at the 2σ level, and concordia plots were processed using Isoplot/Ex 3 software (Ludwig, Reference Ludwig2003).
Table 2. Zircon LA-ICP-MS U–Pb ages for migmatites from Chencai complex

Hafnium isotopic ratios of zircon measured by multi-collector (MC) LA-MC-ICP-MS at Nanjing FocuMS Technology Co. Ltd. Teledyne Cetac Technologies Analyte Excite laser-ablation system (Bozeman, Montana, USA) and Nu Instruments Nu Plasma II MC-ICP-MS (Wrexham, Wales, UK) were combined for the experiments. A193 nm ArF excimer laser, homogenized by a set of beam delivery systems, was focused on the zircon surface with fluence of 6.0 J cm−2. Ablation protocol employed a spot diameter of 50 µm at an 8 Hz repetition rate for 40 s (equating to 320 pulses). Helium was applied as carrier gas to efficiently transport aerosol to MC-ICP-MS. Two standard zircons (including GJ-1, 91500, Plešovice, Mud Tank, Penglai) were treated as quality control every ten unknown samples. The normalizing factor used to correct the mass fractionation of Hf during the measurements is 0.7325 for 179Hf/177Hf. The reference value of 176Hf/177Hf of standard Penglai Zircon is 0.282906±0.000010 (2s) (X. H. Li et al. Reference Li, Long, Li, Liu, Zheng, Yang, Chamberlain, Wan, Guo, Wang and Tao2010a). Analyses of standard Penglai zircon over the measurement period provided176Hf/177Hf=0.282926±0.000016 (2s) (n=6). Initial 176Hf/177Hf values were calculated based on an Lu decay constant of 1.865E−11 (Scherer, Munker & Mezger, Reference Scherer, Munker and Mezger2001). The model ages were computed under the assumption that the 176Lu/177Hf of average crust is 0.015, and the 176Hf/177Hf and 176Lu/177Hf ratios of chondrite and depleted mantle at the present are, respectively, 0.282772 and 0.0332, and 0.28325 and 0.0384 (Blichert-Toft & Albarede, Reference Blichert-Toft and Albarede1997). The analytical results of Hf isotopic compositions are given in Table 3.
Table 3. Zircon Lu–Hf isotopic data for the migmatites from Chencai complex

4. Results
4.1. Zircon morphology and internal structure
Representative CL images of zircons are shown in Figure 4. Zircons from the leucosomes of the migmatites (samples 15ZJ9-1, 15ZJ11-1) are colourless and transparent. They are euhedral to subhedral and 70–180 μm long with length/width ratios of 1–2. Several grains show core–rim structures with the rims having weak oscillatory zoning. The cores are smaller than their corresponding rims. Most of the newly formed zircons without core display weak oscillatory zoning or nebulous zoning.

Figure 4. Representative CL images of zircons from the leucosome samples showing morphology and internal structures. The red circles represent the U–Pb analytical spots, and the bigger yellow dashed circles represent the Lu–Hf analytical spots.
Zircon grains from the leucosome of the migmatite (samples 15ZJ4-2, 15ZJ4-5 and 15ZJ4-6) are light purple to transparent, and show morphologies ranging from euhedral, through subhedral to anhedral. Their lengths range from 50 to 150 μm with length/width ratios of 1–3. Some grains have clear core–rim structures with irregular and sharp boundaries. The rims exhibit weak oscillatory zoning, associated with magmatic overgrowth. Some newly formed zircons display no core–rim structures and feature weak oscillatory or planar zoning.
The CL images show that these zircons can be grouped morphologically into two types: (1) grains with concentric, oscillatory zoning; and (2) small cores with wide concentric oscillatory zoned rims. The type 1 zircons and oscillatory-zoned rims in type 2 zircons show a common prismatic morphology with patched, planar or nebulous zoning, both indicative of an igneous origin. The type 2 zircon cores display variously irregular morphologies, and are relicts of older zircons that represent inheritance, presumably from the surrounding country rocks.
4.2. Zircon U–Pb ages
U–Pb dating of samples 15ZJ9-1 and 15ZJ11-1 was performed on the type 1 zircons and the oscillatory-zoned rims in the type 2 zircons by SIMS. A total of 13 zircons from sample 15ZJ9-1 were analysed. Th/U ratios of the zircons range from 0.04 to 0.12. Among these, 11 analyses are concordant and give a weighted mean 206Pb/238U age of 432±4 Ma (MSWD=1.2, n=11) (Fig. 5a). Two analyses gave older 206Pb/238U ages of 464 and 480 Ma, respectively. A total of 12 zircons from sample 15ZJ11-1 were analysed. Th/U ratios of the zircons dominantly range from 0.01 to 0.1. Excluding one analysis with a large error, the remaining 11 analyses are concordant and give a weighted mean 206Pb/238U age of 437±3 Ma (MSWD=1.4, n=11) (Fig. 5b).
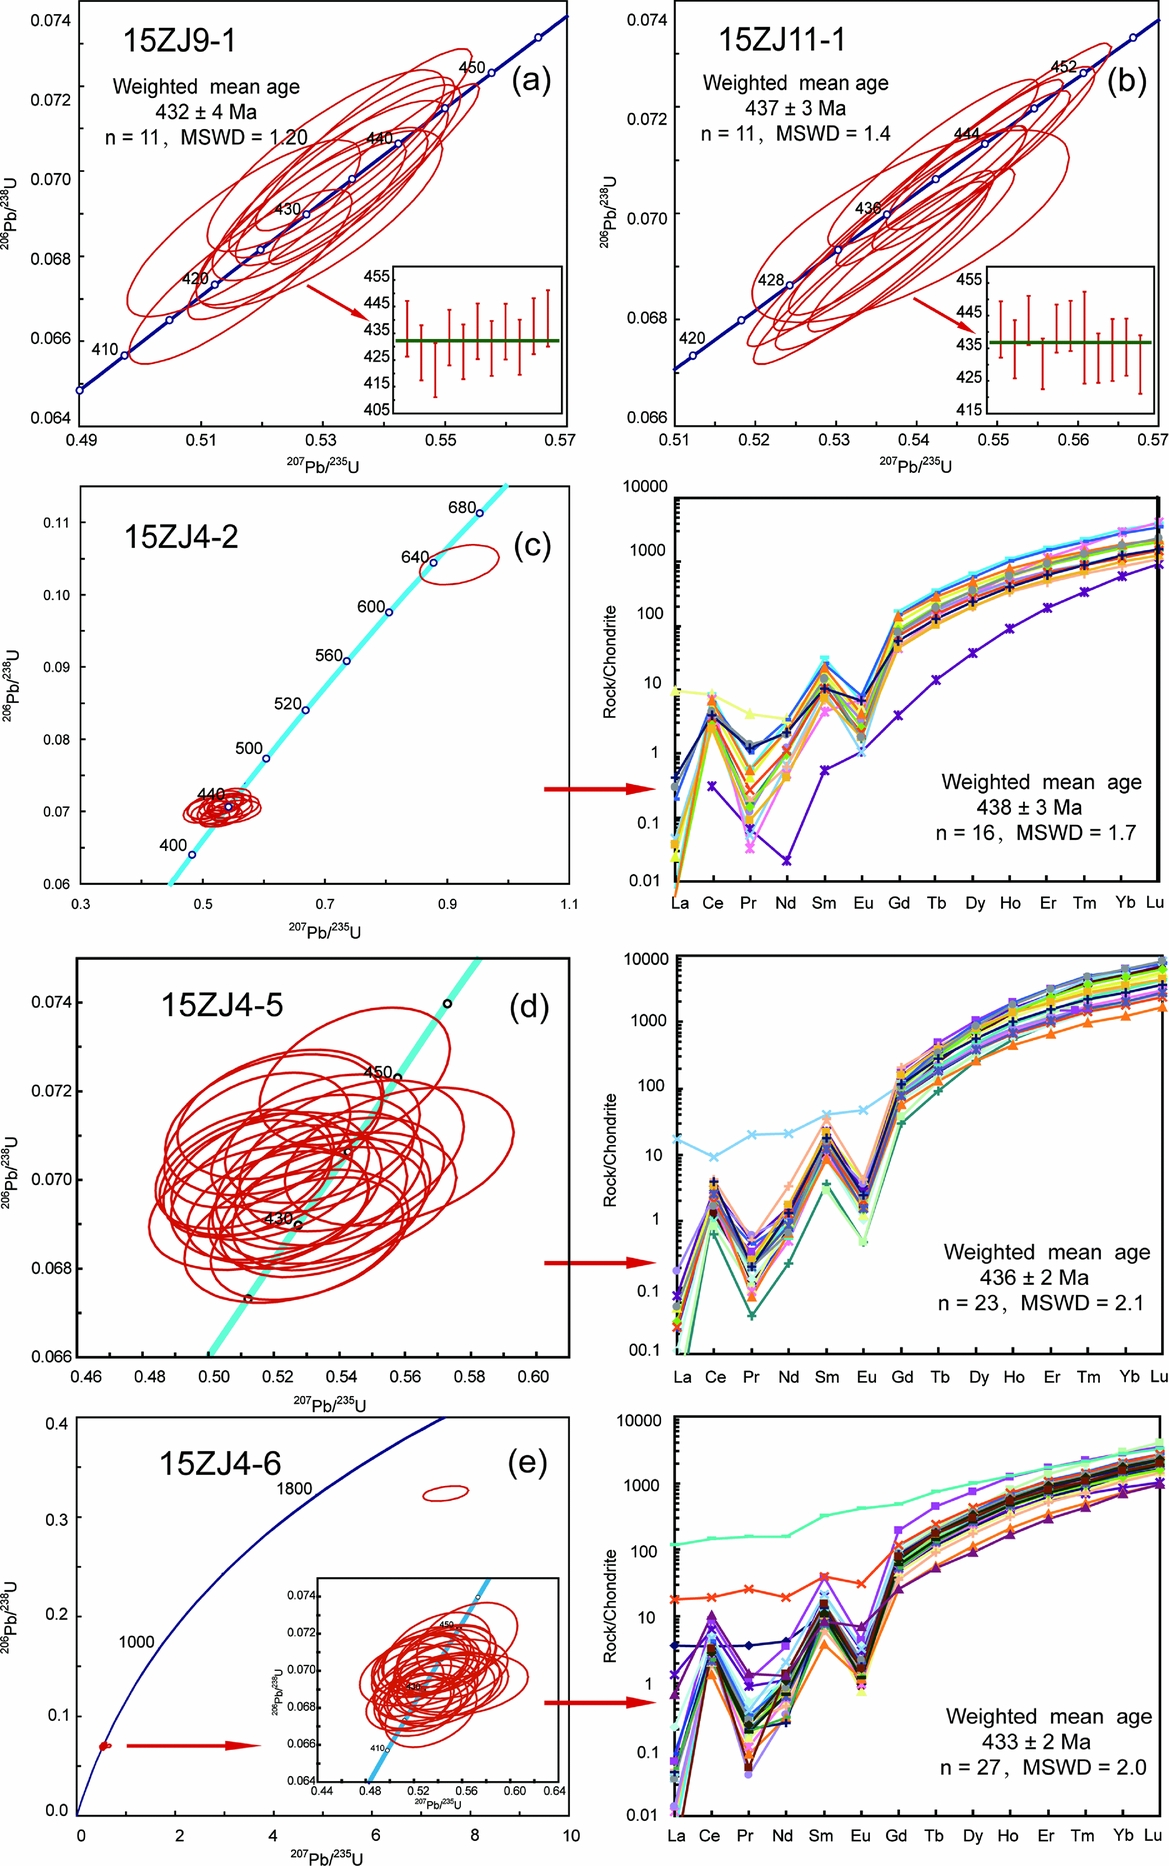
Figure 5. Zircon U–Pb concordia diagrams (a–e) and chondrite-normalized REE patterns. REE normalization factors after Sun & McDonough (Reference Sun, McDonough, Saunders and Norry1989).
U–Pb dating of samples 15ZJ4-2, 15ZJ4-5 and 15ZJ4-6 was carried out using LA-ICP-MS. A total of 17 zircons from sample 15ZJ4-2 were conducted, all of which are concordant or nearly concordant. Th/U ratios range from 0.01 to 0.21. One analysis gives a 206Pb/238U age of 639 Ma. The remaining 16 analyses are all concordant and give a weighted mean 206Pb/238U age of 438±3 Ma (MSWD=1.7, n=16) (Fig. 5c). Twenty-five analyses were conducted on zircons from sample 15ZJ4-5. Th/U ratios range from 0.02 to 0.22. Twenty-three of the analyses are concordant and give a weighted mean 206Pb/238U age of 436±2 Ma (MSWD=2.1, n=23) (Fig. 5d). A total of 30 zircons from sample 15ZJ4-6 were analysed. Th/U ratios of these zircons dominantly range from 0.06 to 0.46. One analysis gave a 206Pb/238U age of 1807 Ma. Excluding two analyses with <95% concordance, the remaining 27 analyses give a weighted mean 206Pb/238U age of 433±2 Ma (MSWD=2.0, n=27) (Fig. 5e). These zircons have variable Th/U ratios and show steeply rising rare earth elements (REE) patterns with a positive Ce anomaly and clear negative Eu anomaly (Fig. 5), suggesting that they were crystallized from crustal melts.
4.3. Zircon Hf isotopes
Because the zircon cores are too small to be simultaneously analysed for trace element and Hf isotope, all Hf isotope analyses were made on newly formed zircon rims. The calculated ε Hf(t) values and two-stage Hf model ages (T DM2) of the studied zircons are shown in Figure 6.

Figure 6. (a–j) Relative probability density diagrams of zircon's ε Hf(t) values and corresponding two-stage model ages of the studied leucosome samples.
Sixteen Hf isotope analyses were carried out on 16 zircon grains from sample 15ZJ9-1. The analyses yield consistent 176Hf/177Hf ratios between 0.282154 and 0.282296, corresponding to ε Hf(t) values of −12.4 to −7.3 calculated at t=432 Ma. The T DM2 ages are 1.89–2.2 Ga with weighted mean age of 2.02 Ga. Seventeen analyses were made on 17 zircons from sample 15ZJ11-1. The 176Hf/177Hf ratios are consistent between 0.282105 and 0.282274. The calculated ε Hf(t) values are −14 to −8, and the corresponding T DM2 ages are 1.94–2.31 Ga (weighted mean of 2.13 Ga) at t=437 Ma.
Twenty-five Hf isotope analyses were carried out on 25 zircon grains from sample 15ZJ4-2. The analyses yield consistent 176Hf/177Hf ratios between 0.282122 and 0.28236, corresponding to ε Hf(t) values of −13.4 to −5 calculated at t=438 Ma. The T DM2 ages are 1.74–2.27 Ga with weighted mean of 1.93 Ga. Twenty-five analyses were carried out on 25 zircon grains from sample 15ZJ4-5. The analyses yield consistent 176Hf/177Hf ratios between 0.281896 and 0.282292. The calculated ε Hf(t) values are −21.4 to −7.4, and the corresponding T DM2 ages are 1.89–2.77 Ga (weighted mean of 2.33 Ga) at t=437 Ma. Twenty-four Hf isotope analyses were carried out on 24 zircon grains from sample 15ZJ4-6. The analyses yield consistent 176Hf/177Hf ratios between 0.282166 and 0.282368, corresponding to ε Hf(t) values of −11.9 to −4.8 calculated at t=433 Ma. The T DM2 ages are 1.73–2.18 Ga (weighted mean age of 1.92 Ga).
5. Discussion
5.1. The early Palaeozoic tectono-thermal sequence of the Chencai complex
Previous geochronological studies on the Chencai complex mainly focused on its protolith age and metamorphic age. The complex was previously regarded as Mesoproterozoic strata (Shui, Xu & Liang, Reference Shui, Xu and Liang1986; Shui, Reference Shui1987; Kong, Bao & Gu, Reference Kong, Bao and Gu1994), and a Palaeoproterozoic age has also been obtained (Z. X. Li et al. Reference Li, Li, Wartho, Clark, Li, Zhang and Bao2010). However, a large amount of recent data indicates that the main part of the Chencai complex formed during the Neoproterozoic (Shu, Reference Shu2006; Gao, Ding & Liu, Reference Gao, Ding and Liu2014; Wang et al. Reference Wang, Xing, Chen, Hong, Zhu, Zhao and Jiang2015).
The metamorphic age of the Chencai complex is also controversial. Geothermobarometrical work suggests multiple episodes of metamorphism from Palaeoproterozoic to Palaeozoic, with a major one in the late Palaeoproterozic (Zhao, Sun & He, Reference Zhao, Sun and He1994). Xu (Reference Xu1987) believed that the major metamorphism occurred in the late Neoproterozoic. This is consistent with the 40Ar–39Ar age (877±10 Ma) of an amphibole (e.g. Kong, Bao & Gu, Reference Kong, Bao and Gu1994). However, recent studies show that the amphibolite-facies metamorphism of the Chencai complex happened between c. 460 and 435 Ma (Z. X. Li et al. Reference Li, Li, Wartho, Clark, Li, Zhang and Bao2010; Yao, Shu & Santosh, Reference Yao, Shu and Santosh2014; Zhao et al. Reference Zhao, Zhai, Zhou, Santosh and Ma2015b).
In this study, five leucosomes from the migmatites in the Chencai complex gave weighted mean ages ranging from 438±3 Ma to 432±4 Ma. Taking into account the CL images of zircons, these ages are interpreted to represent the time of crustal anatexis. Besides the metamorphic rocks and migmatites, several small plutons are also developed in the Chencai complex. A granite and a norite yielded concordant U–Pb ages of 434±4 Ma (Z. X. Li et al. Reference Li, Li, Wartho, Clark, Li, Zhang and Bao2010) and 422±2 Ma (Zhao et al. Reference Zhao, Zhai, Zhou, Santosh and Ma2015b), respectively.
Metamorphism, migmatization and magmatism are coeval in the Chencai complex and indicate a protracted (~40 Ma) tectono-thermal event lasting from 460 to 420 Ma. Similar results have also been reported for a migmatite complex in the Wuyi–Yunkai structural belt (Y. J. Wang et al. Reference Wang, Fan, Zhao, Ji and Peng2007; Liu et al. Reference Liu, Zhou, Zhang, Zhong, Zeng, Xiang, Jin, Lu and Li2010a; D. Wang et al. Reference Wang, Zheng, Ma, Griffin, Zhao and Wong2013). These data provide significant constraints on the timing of the early Palaeozoic orogeny, as well as on the metamorphic and magmatic evolution during syn-orogenic crustal thickening (see below).
5.2. Mechanism of migmatization
Different views about the mechanism of migmatization/anatexis have been proposed, including lithosphere thinning accompanied by asthenosphere upwelling (Molnar, Houseman & Conrad, Reference Molnar, Houseman and Conrad1998), underplating of basaltic magma (Voshage et al. Reference Voshage, Hofmann, Mazzucchelli, Rivalenti, Sinigoi, Raczek and Demarchi1990; Dewey, Robb & van Schalkwyk, Reference Dewey, Robb and van Schalkwyk2006), decompression by means of exhumation (Whittington & Treloar Reference Whittington and Treloar2002; Zhang et al. Reference Zhang, Holtz, Koepke, Berndt and Ma2014a), and crustal thickening (Andreoli et al. Reference Andreoli, Hart, Ashwal and Coetzee2006; McLaren et al. Reference McLaren, Sandiford, Powell, Neumann and Woodhead2006; Clark et al. Reference Clark, Fitzsimons, Healy and Harley2011). In the Cathaysia Block, early Palaeozoic mafic rocks are scare, with only sporadically distributed Silurian gabbros in the Wuyi–Yunkai structural belt and meta-basaltic rocks in the Chencai complex (cf. Y. J. Wang et al. Reference Wang, Zheng, Ma, Griffin, Zhao and Wong2013b; Zhang et al. Reference Zhang, Jiang, Wang, Liu, Ni and Qing2015; Zhao et al. Reference Zhao, Zhai, Zhou, Santosh and Ma2015b), precluding the first two mechanisms in explaining the widespread migmatization in the Cathaysia Block. There is also no evidence that rapid exhumation similar to what happened in the Dabie orogen of eastern China (cf. S. J. Wang et al. Reference Wang, Li, Chen, He, An and Shen2013) occurred in the Chencai area and the Wuyi–Yunkai region. We therefore conclude that the migmatization most likely resulted from crustal thickening.
During crustal thickening, the heat may have been produced mainly through the decay of radioactive elements in the buried materials (Y. J. Wang et al. Reference Wang, Fan, Zhao, Ji and Peng2007; Zhang et al. Reference Zhang, Wang, Fan, Zhang and Zhang2012). Progressive heating will induce the breakdown of hydrous minerals to generate initial melts (e.g. Guernina & Sawyer, Reference Guernina and Sawyer2003; Sawyer, Reference Sawyer2010; Streule et al. Reference Streule, Searle, Waters and Horstwood2010; Groppo, Rolfo & Mosca, Reference Groppo, Rolfo and Mosca2013; Zhang et al. Reference Zhang, Xiang, Dong, Li, Ding, Gou and Tian2016). Once the melting of the source rocks had begun, effective viscosity of the middle crust was rapidly lowered and the mechanical strength was significantly reduced, promoting the melt of the crustal materials at the deep level (Brown, Reference Brown2007; Gerbi, Culshaw & Marsh, Reference Gerbi, Culshaw and Marsh2010; Wang et al. Reference Wang, Zhang, Fan, Zhang, Zhang and Zhang2011; Cottle, Larson & Kellett, Reference Cottle, Larson and Kellett2015). Thus, when the crust was thickened, the thermal budget provided by heat-producing elements could be sufficient to achieve the high-grade metamorphic conditions at middle crustal depths and to induce the generation of granitic melts at deeper crustal levels. Accordingly, migmatization should show a close spatial and temporal association with high grade metamorphism and granitoid emplacement during crustal thickening, which is consistent with the above-mentioned early Palaeozoic sequence of tectono-thermal events in the Chencai complex as well as the Wuyi–Yunkai region.
Notably, the sedimentary protoliths of metapelites experienced amphibolite facies metamorphism in the Chencai complex (Zhao, Sun & He, Reference Zhao, Sun and He1994), requiring significant crustal thickening as these rocks would have been brought down to mid-crustal depths of >20 km to achieve the metamorphic conditions. Zhao & Sun (Reference Zhao and Sun1994) studied the metamorphic rocks sampled from the Chencai complex and gave peak metamorphic P–T conditions of ~0.7 GPa and ~550°C and these samples recorded a clockwise P–T path. In addition, recent studies also show that the high-grade metamorphic rocks record a near-isothermal decompressional and clockwise P–T path in the Wuyi–Yunkai region (Zhao & Cawood, Reference Zhao and Cawood1999; Yu, Zhou & Zhao, Reference Yu, Zhou and Zhao2003, Yu, Zhou & O'Reilly, Reference Yu, Zhou and O'Reilly2005; Charvet et al. Reference Charvet, Shu, Faure, Choulet, Wang, Lu and Breton2010; Z. X. Li et al. Reference Li, Li, Wartho, Clark, Li, Zhang and Bao2010). Such metamorphic conditions support the idea that the early Palaeozoic metamorphic event in the Chencai complex as well as the Wuyi–Yunkai region was linked to crustal thickening (e.g. Zhao & Sun, Reference Zhao and Sun1994; Z. X. Li et al. Reference Li, Li, Wartho, Clark, Li, Zhang and Bao2010; Wang et al. Reference Wang, Zhang, Fan, Zhang, Zhang and Zhang2011; Zhang et al. Reference Zhang, Wang, Fan, Zhang and Zhang2012). We therefore conclude that the migmatization in the Chencai complex was a product of metamorphic evolution, associated with crustal thickening driven by the early Palaeozoic orogeny.
5.3. Tectonic implications
The early Palaeozoic orogeny led to significant crustal reworking of the Cathaysia Block. It has been interpreted as an intraplate orogeny within the SCB (Shu et al. Reference Shu, Yu, Jia, Wang, Shen and Zhang2008; Faure et al. Reference Faure, Shu, Wang, Charvet, Choulet and Monié2009; Z. X. Li et al. Reference Li, Li, Wartho, Clark, Li, Zhang and Bao2010; Y. J. Wang et al. Reference Wang, Zhang, Fan, Zhang, Zhang and Zhang2011, Reference Wang, Wu, Zhang, Fan, Zhang, Zhang, Peng and Yin2012, Reference Wang, Zhang, Cawood, Zhang, Fan and Zhang2013a,b), or a continent–continent collisional event that resulted in the region occupied by the present-day southeastern margin (Cathaysia) of SCB colliding with a postulated continental block that later moved away along the Zhenghe–Dapu fault (Zhao & Cawood, Reference Zhao and Cawood2012; Zhang et al. Reference Zhang, Santosh, Zhu, Chen and Huang2014b; Lin et al. Reference Lin, Xing, Ying, Li, Davis, Davis, Chen, Jiang and Chen2015). The early Palaeozoic orogen covers more than half of the area of the Cathaysia Block (Z. X. Li et al. Reference Li, Li, Wartho, Clark, Li, Zhang and Bao2010), and an understanding of its evolution needs to consider the nature of the basement in the Cathaysia Block.
Recent studies show that the Cathaysia Block is likely composed of two different domains (i.e. west and east Cathaysia), although the exact boundary is unclear (Xu et al. Reference Xu, O'Reilly, Griffin, Wang, Pearson and He2007; Y. J. Wang et al. Reference Wang, Zhang, Cawood, Zhang, Fan and Zhang2013a; Zhang et al. Reference Zhang, Santosh, Zhu, Chen and Huang2014b). Such a division is supported by zircon U–Pb dating and Hf isotopic data from different areas of the Cathaysia Block including the Yunkai, Nanling and Wuyi areas as well as the Badu area (e.g. Xu et al. Reference Xu, O'Reilly, Griffin, Wang, Pearson and He2007). The early Palaeozoic zircons of the Yunkai charnockites and gneissic migmatites yielded ε Hf(t)=−16.2 to −3.5 and T DM2 ages of 1.7–2.4 Ga (with peak at c. 1.8–2.1 Ga) (D. Wang et al. Reference Wang, Zheng, Ma, Griffin, Zhao and Wong2013b). Similarly, the T DM2 ages of the Nanling area, indicated by zircons from the Jurassic, Triassic and Ordovician granitic plutons, range from 1.6 to 2.2 Ga (Shu et al. Reference Shu, Wang, Sun, Chen and Shen2013). These suggest ancient crust evolved from Palaeoproterozoic crust–mantle differentiation. The T DM2 ages of the studied migmatites in the Chencai complex also reflect a major episode of crustal growth in Palaeoproterozoic time (c. 1.9–2.3 Ga), indicating that the Chencai complex may represent the NE extension of the Wuyi–Yunkai structural belt. In contrast, zircons from the Badu complex yield T DM2 ages clustering between 2.4 and 3.0 Ga (with the peak at 2.7–3.0 Ga) (Yu et al. Reference Yu, Wang, Griffin, O'Reilly, Zhang, Li and Shu2009; Zhao et al. Reference Zhao, Zhou, Zhai, Santosh, Ma, Shan and Cui2014, Reference Zhao, Zhou, Zhai, Santosh and Geng2015a), suggesting that a major crustal growth took place during Archaean time.
The zircon Hf data summarized above suggest that the Chencai–Wuyi–Yunkai region (referred to as the main part of the west Cathaysia domain) exhibits a crustal growth history different from the Badu area (referred to as the main part of the east Cathaysia domain). In addition to the distinct crustal growth processes, the two domains display different tectonic evolution histories. The west domain experienced the early Palaeozoic tectono-thermal event, whereas the east domain was predominantly affected by Mesozoic (250–230 Ma) metamorphic reworking (Xiang et al. Reference Xiang, Zhang, Zhou, Zhong, Zeng, Liu and Jin2008; Yu et al. Reference Yu, Wang, Griffin, O'Reilly, Zhang, Li and Shu2009; Zhao et al. Reference Zhao, Zhou, Zhai, Santosh, Ma, Shan and Cui2014). By considering the contrast in geological history between the two domains, Lin et al. (Reference Lin, Xing, Ying, Li, Davis, Davis, Chen, Jiang and Chen2015) suggest that they might not have amalgamated until the Mesozoic. They further suggest that the early Palaeozoic orogeny was a result of a continent–continent collision between the west Cathaysia domain and a postulated separate continent to the east (instead of the east Cathaysia domain) that moved away from South China through later rifting and/or strike-slip motion (Lin et al. Reference Lin, Xing, Ying, Li, Davis, Davis, Chen, Jiang and Chen2015). Orogen-parallel large-scale strike-slip motion is common in many orogenic belts (e.g. the Canadian Appalachians; Lin et al. Reference Lin, Brem, van Staal, Davis, McNicoll and Pehrsson2013).
Collectively, our new results on the migmatites of the Chencai complex provide alternative solutions for the geodynamic mechanism of the early Palaeozoic orogeny, and help to improve understanding of the crustal growth and early Palaeozoic tectonic evolution of the Cathaysia Block.
6. Conclusions
1. Migmatization in the Chencai complex took place during c. 438–432 Ma.
2. The migmatization was associated with crustal thickening driven by the early Palaeozoic orogeny.
3. Hf isotopic data of zircons from the Chencai complex are similar to those of the Wuyi–Yunkai region, but different from those of the Badu region. The latter also lacks evidence for an early Palaeozoic tectono-thermal event. This supports the idea that the early Palaeozoic orogeny was a result of collision of the west Cathaysia domain with a postulated continent (instead of the east Cathaysia domain).
Acknowledgements
This paper greatly benefited from the comments of two anonymous reviewers. This work was financially supported by China NSFC grant (41573023). The Research Funding for Young Huangshan Scholar of HFUT to Longming Li is gratefully acknowledged. X. P. Xia and Q. Z. Li are thanked for zircon SIMS and LA-ICP-MS U–Pb dating, respectively. We also thank L. Qi for major and trace element analyses and J. F. Gao for Hf isotopic analyses.


