1. Introduction
Measuring or constraining the rheological parameters of rocks is of fundamental importance in materials science and structural geology. Rocks under stress for thousands of years due to tectonic forces can undergo ductile deformation. However, parameters of ductility of rock units, most notably the dynamic viscosity (henceforth referred to as ‘viscosity’), are not always possible to measure in the laboratory. One of the indirect approaches to constraining mantle viscosity in the past few decades has been to study crustal rebound rates (as reviewed by Schubert, Turcotte & Olson, Reference Schubert, Turcotte and Olson2001). Although the viscosities of rocks should ideally decrease with depth due to increase in temperature, single representative values of the parameter for particular rock types have often been preferred by previous workers (e.g. Talbot et al. Reference Talbot, Medvedev, Alavi, Shahrivar, Heidari, Blundell and Scott2000) and have proved useful in tectonic modelling (e.g. Schultz-Ela & Walsh, Reference Schultz-Ela and Walsh2002).
In map view, salt diapirs are usually circular to elliptical salt structures. Rayleigh-Taylor instability (rise of lighter salt through superjacent denser rocks due to buoyancy) is suggested as one of the mechanisms for the formation of salt diapirs (e.g. Price & Cosgrove, Reference Price and Cosgrove1990; Davies, Reference Davies1999). In this case, both the salt and the country rock are taken as viscous fluids over a long geological time span (as per Turcotte & Schubert, Reference Turcotte and Schubert2002). However, several other mechanisms of salt diapirism do exist (e.g. faulting of overburden units by thin- or thick-skinned extension, differential loading, erosion of the crest of salt-cored anticlines: Koyi, Reference Koyi1991b; Vendeville & Jackson, Reference Vendeville and Jackson1992; Koyi, Jenyon & Petersen, Reference Koyi, Jenyon and Petersen1993; Weijermars, Jackson & Vendeville, Reference Weijermars, Jackson and Vendeville1993; Jackson, Vendeville & Schultz-Ela, Reference Jackson, Vendeville and Schultz-Ela1994; Koyi, Reference Koyi1997; Sans & Koyi, Reference Koyi2001; Koyi et al. Reference Koyi, Ghassemi, Hessami and Dietl2008, among others).
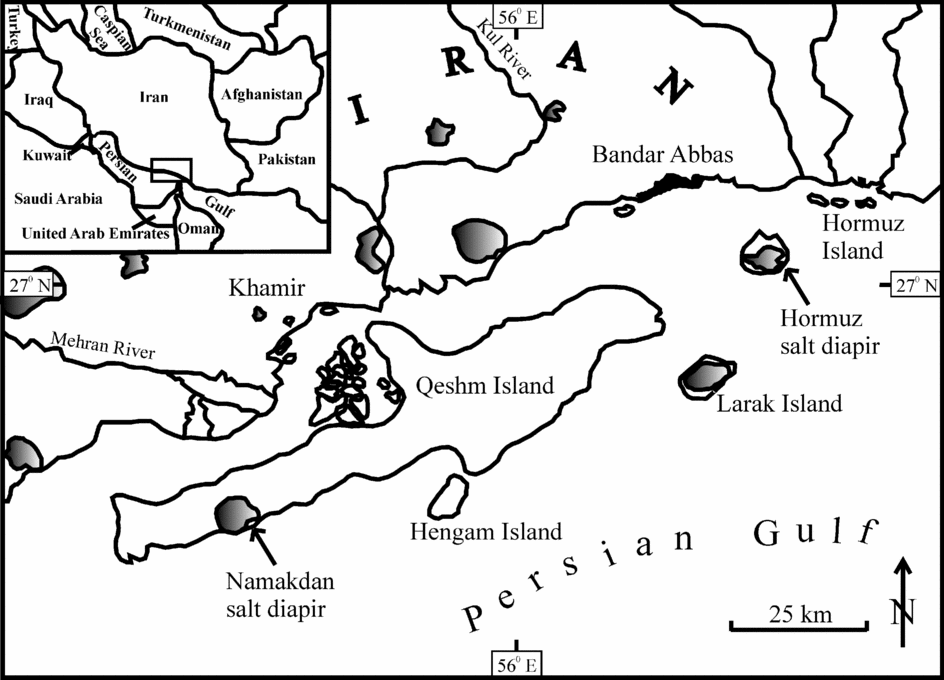
Most of the 200 or so diapirs of Hormuz salt in the Zagros Mountains of Iran (e.g. De Böckh, Lees & Richardson, Reference De Böckh, Lees, Richardson and Gregory1929; Kent, Reference Kent1958; Harrison, Reference Harrison1930, Reference Harrison1931; Bosák et al. Reference Bosák, Jaros, Spudil, Sulovsky and Vaclavak1998 and their review; A. Bahroudi, unpub. Ph.D. thesis, Uppsala University, 2003 and references therein), with diameters ranging from 1 to 15 km (Bruthans et al. Reference Bruthans, Filippi, Asadi, Zare and Churáčková2009), extrude majestic mountains of salt that rise 400 m above their vents in limestones (Talbot, Reference Talbot, Blundell and Scott1998). Halite (NaCl) is the main constituent (up to 96 wt %) of these salts (Bruthans et al. Reference Bruthans, Asadi, Filippi, Vilhelm and Zare2008) and shows minor differences in colour (Talbot, Aftabi & Chemia, Reference Talbot, Aftabi and Chemia2009). The minor constituents in the halite are oxides of sodium, magnesium, aluminium, silicon, potassium, calcium and iron, and also anhydrides (Bruthans et al. Reference Bruthans, Asadi, Filippi, Vilhelm and Zare2008; Talbot, Aftabi & Chemia, Reference Talbot, Aftabi and Chemia2009; Talbot, Farhadi & Aftabi, Reference Talbot, Farhadi and Aftabi2009). Fragments of sedimentary (sandstone, limestone, dolostone, shale, siltstone), igneous (rhyolite, andesite, ignimbrite, trachyte, granite, gabbroic rocks, metaphyres, tuffs) and metamorphic rocks (schists, gneisses, metabasites, quartzite), with sizes varying from less than a millimetre up to 2 km within these diapirs, are also present, with a few oriented along the foliation planes. The mélange of inclusions are either pieces of the basement rocks or are syn-Hormuz depositions (Jahani et al. Reference Jahani, Callot, de Lamotte, Letouzey, Leturmy, Lacombe, Lavé, Roure and Vergés2007 and references therein). In places the igneous rocks are extensively kaolinitized (Talbot, Aftabi & Chemia, Reference Talbot, Aftabi and Chemia2009). In addition, the diapirs are covered in some places with vegetation, and a few centimetres to tens of metres of surficial weathered deposits of intermediate composition, including evaporite (gypsum, anhydrite, minor halite), carbonates and silicate oxides (chiefly quartz, phyllosilicates and hematite) in other places (Kent, Reference Kent1958; Bruthans et al. Reference Bruthans, Filippi, Asadi, Zare and Churáčková2009). The residual soils in the Hormuz diapir are marl-rich and limonitic, and consist of anhydrite crystals (Talbot, Aftabi & Chemia, Reference Talbot, Aftabi and Chemia2009). The near-surface rocks of the Hormuz diapir are affected by low-angle thrusts and sub-vertical tear faults (Talbot, Aftabi & Chemia, Reference Talbot, Aftabi and Chemia2009). The two diapirs considered here, Namakdan on the island of Qeshm and Hormuz Island (Figs 1, 2, 3), were in a small group of near-coastal diapirs partially truncated by Holocene marine erosion at 9.3 ka (Talbot, Aftabi & Chemia, Reference Talbot, Aftabi and Chemia2009). Bruthans et al. (Reference Bruthans, Filippi, Geršl, Zare, Melková, Pazdur and Bosák2006) used the current altitudes of dated oysters and bivalves that lived close to sea level in the sediments deposited on these terraces to constrain their subsequent rates of rise at several localities in these two diapirs (Figs 2, 3). Estimating the viscosity of diapiric salt is important, as this is one of the parameters controlling (1) the growth of the diapir, and (2) entrainment of embedded dense blocks, either anhydrites or (potentially) canisters of radioactive waste (Koyi, Reference Koyi2001; Chemia, Koyi & Schmeling, Reference Chemia, Koyi and Schmeling2008 and references therein).
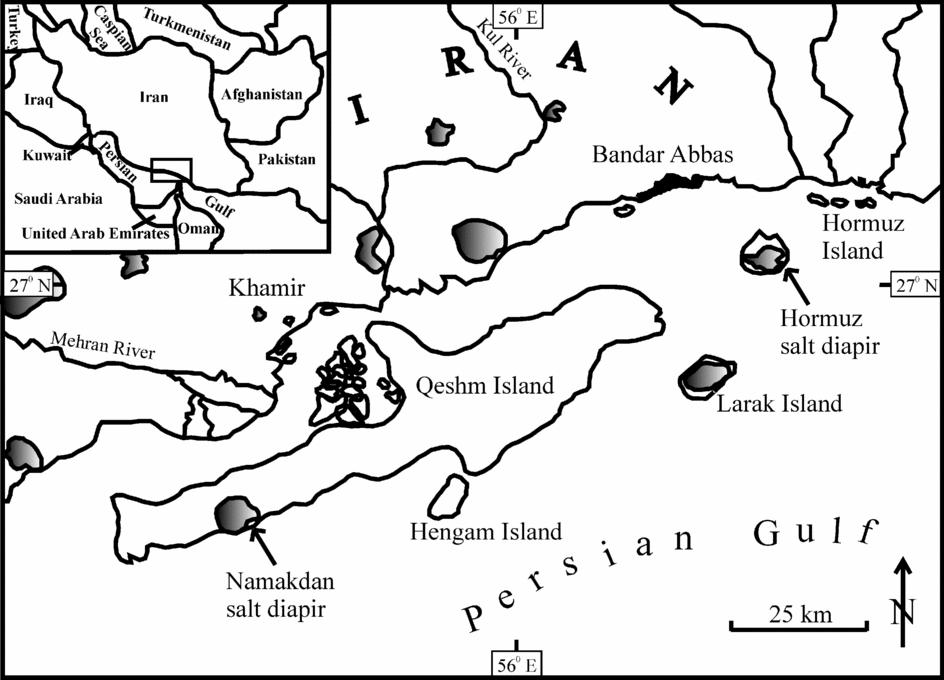
Figure 1. Geographic locations of the Hormuz and Namakdan diapirs in the Persian Gulf. Dark areas represent exposed salts of the diapirs. Reproduced with permission from Bruthans, J. et al. Reference Bruthans, Filippi, Geršl, Zare, Melková, Pazdur and Bosák2006. Holocene marine terraces on two salt diapirs in the Persian Gulf, Iran: age, depositional history and uplift rates. Journal of Quaternary Science 21, 843–57, Wiley-Blackwell.

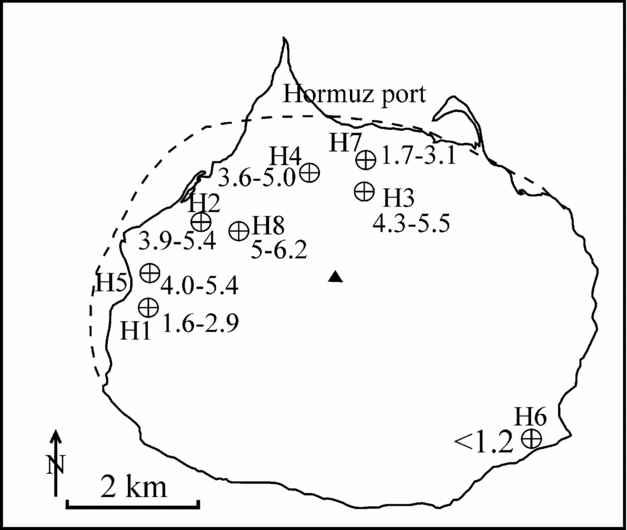
Figure 2. Extrusion rates at known locations (H1 to H8) in the Hormuz diapir. The triangle represents the centre of the diapir. Reproduced with permission from Bruthans, J. et al. Reference Bruthans, Filippi, Geršl, Zare, Melková, Pazdur and Bosák2006. Holocene marine terraces on two salt diapirs in the Persian Gulf, Iran: age, depositional history and uplift rates. Journal of Quaternary Science 21, 843–57, Wiley-Blackwell.

Figure 3. Extrusion rates at known locations (N1 to N7) in the Namakdan diapir. Reproduced with permission from Bruthans, J. et al. Reference Bruthans, Filippi, Geršl, Zare, Melková, Pazdur and Bosák2006. Holocene marine terraces on two salt diapirs in the Persian Gulf, Iran: age, depositional history and uplift rates. Journal of Quaternary Science 21, 843–57, Wiley-Blackwell.
The Namakdan diapir has a stem estimated to be 8 km (H) high and its major (m) and minor (n) axes have lengths 7 km and 6.8 km, respectively, in map forms and cross-sections (see Fig. 5 for our terminology). These geometric parameters for the Hormuz diapir are H = 10 km, m = 8.5 km and n = 6.8 km (Koop & Stonely, Reference Koop and Stonely1982; Bahroudi & Talbot, Reference Bahroudi and Talbot2003; Bruthans et al. Reference Bruthans, Filippi, Geršl, Zare, Melková, Pazdur and Bosák2006). We note that parameter ‘H’ is within the usual limit of 6–10 km for most diapirs, excluding their allochthonous crests or overhangs (Dennis, Reference Dennis1987). The rise rates of the Hormuz and the Namakdan diapirs were much faster than the uplift rate of 0.2 mm y−1 for the Persian Gulf coast over the last 250 ka (Reyss et al. Reference Reyss, Pirazzoli, Haghipor, Hatte, Fontugne, Stewart and Vita-Finzi1998). The rim of Hormuz Island rose at 2 mm y−1 over the last 104 years while the highest part of the terrace was uplifted at 5–6 mm y−1 (Bruthans et al. Reference Bruthans, Filippi, Geršl, Zare, Melková, Pazdur and Bosák2006). Seven out of the eight local rise rates constrained for the Hormuz Island salt and all the local rates on Namakdan fit well with the parabolic curves expected for the extrusion of Newtonian viscous fluids (Fig. 4) from a cylindrical channel with a central maximum of 7 ± 1 mm y−1 (Bruthans et al. Reference Bruthans, Filippi, Geršl, Zare, Melková, Pazdur and Bosák2006). Notably, this finding is contrary to the plug-like velocity profiles expected for non-Newtonian fluids flowing through cylindrical channels (Turcotte & Schubert, Reference Turcotte and Schubert2002). It is also contrary to the previously envisaged non-Newtonian flow of dry salt of diapirs at shallow depths (cf. Heard, Reference Heard, Heard, Borg, Carter and Raleigh1972; Carter et al. Reference Carter, Horseman, Russell and Handin1993; Talbot & Jarvis, Reference Talbot and Jarvis1984; Jackson & Talbot, Reference Jackson and Talbot1986; Rischbieter, Reference Rischbieter, Hardy and Langer1988; Hunsche & Hampel, Reference Hunsche and Hampel1999 and references therein; Massimi et al. Reference Massimi, Quarteroni, Saleri and Scrofany2007; Chemia & Koyi, Reference Chemia and Koyi2008).

Figure 4. Uplift rates of the Hormuz and Namakdan diapirs plotted against locations. A Newtonian viscous behaviour of the salts is shown by broken lines. The zone for the pseudoplastic behaviour of the salt is at the right hand side. Reproduced with permission from Bruthans, J. et al. Reference Bruthans, Filippi, Geršl, Zare, Melková, Pazdur and Bosák2006. Holocene marine terraces on two salt diapirs in the Persian Gulf, Iran: age, depositional history and uplift rates. Journal of Quaternary Science 21, 843–57, Wiley-Blackwell.

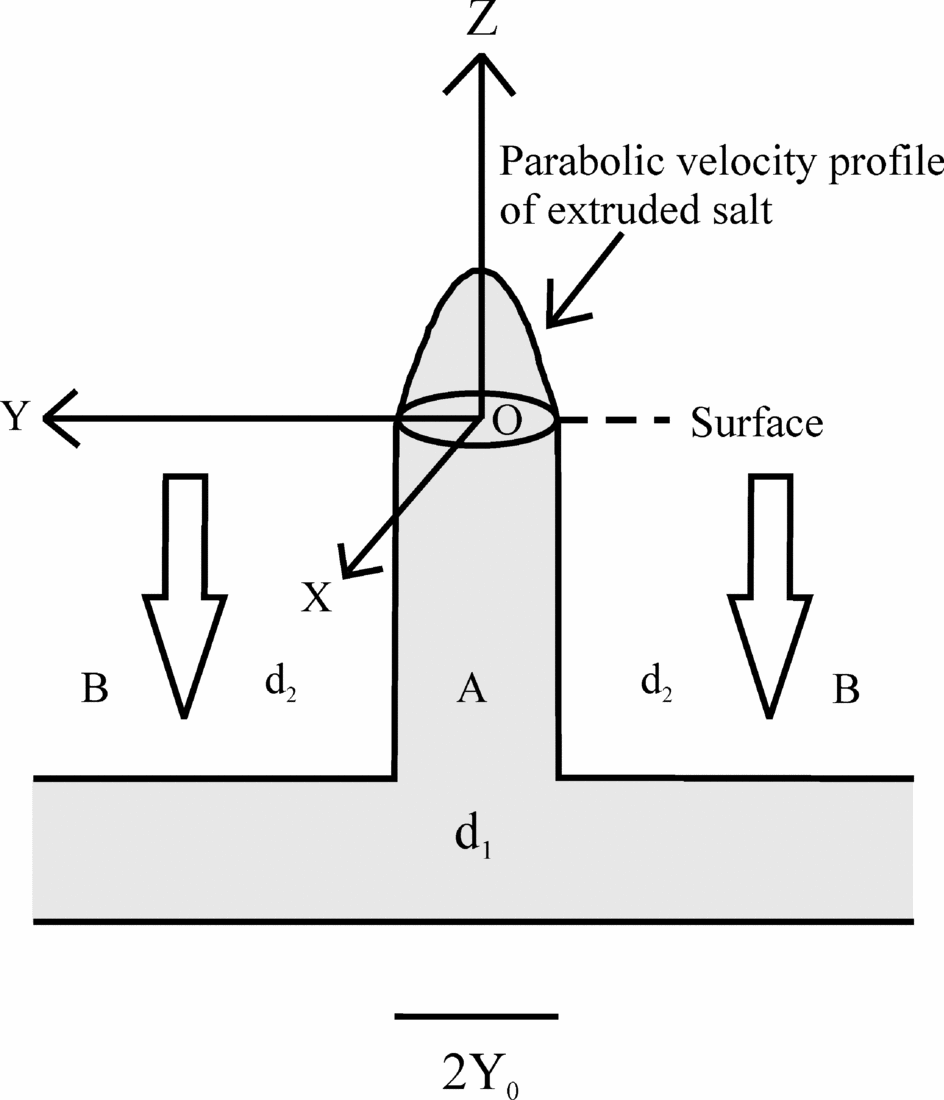
Figure 5. Our mechanical model of an extruding salt diapir in a vertical cross-section and its terminology. ‘A’ is a vertical channel or stem of length ‘H’ through the country rocks of carbonates. The cross-section of the stem ‘A’ for Hormuz Island is elliptical with major and minor axes of lengths ‘2a’ and ‘2b’ along the ‘X’ (east–west) and the ‘Y’ (north–south) axes, respectively. On the other hand, the cross-section for the Namakdan diapir is taken as circular with diameter ‘2a'or ‘2b’. In both cases ‘A’ is connected at the base to a horizontal channel (or source layer), and both of them are filled with an incompressible Newtonian viscous fluid with a density d1. The horizontal channel is under compression (hollow arrows) by an overburden fluid ‘B’, with a density d2 (> d1). The fluid is driven upward through ‘A’ and extrudes into air with a velocity profile that is parabolic and distinctive of Newtonian fluids.
Gravity spreading of the salt extruded from the diapirs of Namakdan and Hormuz Island in the last 104 years is unlikely, because the maximum heights reached by the extruded terraces are only 20 m and 27 m, respectively, above sea level over 1 km from the salt contacts (Bruthans et al. Reference Bruthans, Filippi, Geršl, Zare, Melková, Pazdur and Bosák2006) We judge these heights as too low to induce gravitational spreading. Any gravity spreading should have taken part of the salt outside the line that traces the boundary of the stem in the vertical direction (e.g. Ramberg, Reference Ramberg1981; Talbot & Aftabi, Reference Talbot and Aftabi2004 and references therein). Most importantly, had the extruded salt undergone significant gravity spreading in the last 104 years, the velocity profile of extrusion should have not have matched with the parabolic profile of the Poiseuille flow of salt with Newtonian or any non-Newtonian rheology. Thus the present parabolic profiles of the Hormuz and the Namakdan diapirs indicate not only their Newtonian rheology, as already established by Bruthans et al. (Reference Bruthans, Filippi, Geršl, Zare, Melková, Pazdur and Bosák2006), but also the fact that they have undergone insignificant gravity spreading.
Depending on the vegetation and the weathered materials that protect the diapirs from temporarily varying low rainfall in the arid setting, the (vertical) denudation rates of the Hormuz diapir vary from 20 to 50 mm y−1 and that of the Namakdan diapir from 7 to 50 mm y−1 (Bruthans et al. Reference Bruthans, Asadi, Filippi, Vilhelm and Zare2008, Reference Bruthans, Filippi, Asadi, Zare and Churáčková2009). Inserting data for the extrusion rates at specific locations on these diapirs, as calculated by Bruthans et al. (Reference Bruthans, Filippi, Geršl, Zare, Melková, Pazdur and Bosák2006), into the equations of velocity profiles deduced in this work, we constrain ranges of viscosities of these diapiric salts. We then compare our results with salt viscosities previously reported in different contexts.
2. Extrusion model of salt diapirs and their viscosity estimation
Following Bruthans et al. (Reference Bruthans, Filippi, Geršl, Zare, Melková, Pazdur and Bosák2006), the pressure exerted by the Phanerozoic limestones (with some Palaeozoic and Cenozoic siliciclastic rocks) with a density higher than that of the subjacent Neoproterozoic–Cambrian salt is taken as the extrusion mechanism of the Hormuz and Namakdan salt diapirs (Fig. 2) (also see Mouthereau, Lacombe & Meyer, Reference Mouthereau, Lacombe and Meyer2006; Jenyon, Reference Jenyon1986 and references therein; Weinberger et al. Reference Weinberger, Lyakhovsky, Baer and Begin2006 for Mount Sedom in Dead Sea; analogue models by Talbot & Aftabi, Reference Talbot and Aftabi2004). We model parabolic profiles of these extrusions (Bruthans et al. Reference Bruthans, Filippi, Geršl, Zare, Melková, Pazdur and Bosák2006) as the flow of an incompressible Newtonian viscous salt through smooth-walled vertical channels with uniform cross-sections that are either elliptical or circular. The channel is comparable with the diapiric stem. For modelling purposes, we assume (1) these simple channel geometries, and (2) a single viscosity value for each of the diapirs independent of depth, and therefore of temperature. This approach is similar to that adopted by Weinberger et al. (Reference Weinberger, Lyakhovsky, Baer and Begin2006) for the salt in the Mount Sedom salt structure beside the Dead Sea. Whereas Weinberger et al. (Reference Weinberger, Lyakhovsky, Baer and Begin2006) considered the cross-section of the Sedom salt diapir to be a rectangle defined by parallel walls of the stem or the channel, we consider the channel to have either an elliptical (Eqs 20 and 22 in the Appendix) or circular (Eqs 23 and 24 in the Appendix) cross-section, as is the natural case for the Hormuz and the Namakdan diapir, respectively. In the study case of Weinberger et al. (Reference Weinberger, Lyakhovsky, Baer and Begin2006), the distance between the channel walls is one of the parameters that define the extrusion profile. In our case, the lengths of the major and the minor axes (Eq. 22) and the radius (Eq. 23) act as some of the few controlling parameters. In our calculation, we considered the salt as an incompressible material, following Warren (Reference Warren2006) and Hudec & Jackson (Reference Hudec and Jackson2007).
In our model, a deep-seated horizontal bed of salt acts as the source layer for the extruding salt. The salt rises up through a connected vertical cylindrical channel and extrudes out of a vent in the horizontal surface. Such extrusion is driven by a constant upward pressure through the vertical channel exerted by a higher density overburden onto the horizontal bed. Such simplistic models have been common, for example, in Price & Cosgrove (Reference Price and Cosgrove1990), Talbot & Aftabi (Reference Talbot and Aftabi2004), Bruthans et al. (Reference Bruthans, Filippi, Geršl, Zare, Melková, Pazdur and Bosák2006) and Weinberger et al. (Reference Weinberger, Lyakhovsky, Baer and Begin2006), and assume salt with a constant viscosity to extrude through a vertical stem, although in a different context, thermal plumes in a mantle consisting of fluids with temperature dependent viscosities also form stems (Lin & van Keken, Reference Lin and van Keken2006). So far we do not have any report of flaring-upwards morphology of the Hormuz and the Namakdan diapirs, therefore it is reasonable to model their extrusion via vertical stems. In order to maintain the extrusion of salt diapirs in our case, the upward pressure that drives the extrusion has to remain higher than the temporally increasing downward pressure exerted by the emergent salt. The downward pressure exerted by the overburden on the source layer is expressed in terms of (i) the acceleration due to gravity, (ii) time elapsed since extrusion initiated, (iii) the density difference between the overburden and the salt, (iv) the length of the diapiric stem, (v) the viscosity of the salt, and (vi) the major and the minor axes of the elliptical cross-section (Eq. 21 in the Appendix). The extrusion rate at any point in the elliptical cross-section is additionally dependent on (vii) the coordinate of that point (Eq. 22 in the Appendix). For a circular cross-section, the aforementioned parameters (vi) and (vii) are substituted by (vi′) the radius of the cross-section, and (vii′′) the distance of the location of known extrusion rate from the centre (Eq. 23 in the Appendix).
These derivations are based on the following constraints: (1) The source layer of salt is originally horizontal. In reality, however, it could have been folded and faulted. (2) The extruded salt does not undergo gravitational spreading, as documented by field studies (Bruthans et al. Reference Bruthans, Filippi, Asadi, Zare and Churáčková2009). In other words, the extruded salt rises but does not flow laterally into an overhang. This means that the weight of the extruded salt acts downward only on the stem. (3) Erosion/dissolution of the diapiric salt is neglected. (4) The denser overburden that drove the extrusion of the diapir is taken solely to be limestone. The presence of other less dense rocks might have reduced the density, thereby leading to a range of possible density values of the overburden. The maximum and minimum possible differences in densities between the salt and the carbonate country rocks, dmax diff and dmin diff, are taken from Mizutani (Reference Mizutani, Uemura and Mizutani1984). The uplift rates, Uz(x,y,t) and Uz(y1,t), used to calculate viscosities in this work are obtained from the seven data points for the Hormuz and the six data points for the Namakdan diapir, from figures 9a and b of Bruthans et al. (Reference Bruthans, Filippi, Geršl, Zare, Melková, Pazdur and Bosák2006). An alternative and more accurate (but less tractable) way of constraining the viscosity of the diapiric salts could be to consider the three-dimensional Poiseuille flow for the range of viscosities by matching the best fit paraboloid of revolution obtained from Bruthans et al.'s (Reference Bruthans, Filippi, Geršl, Zare, Melková, Pazdur and Bosák2006) data.
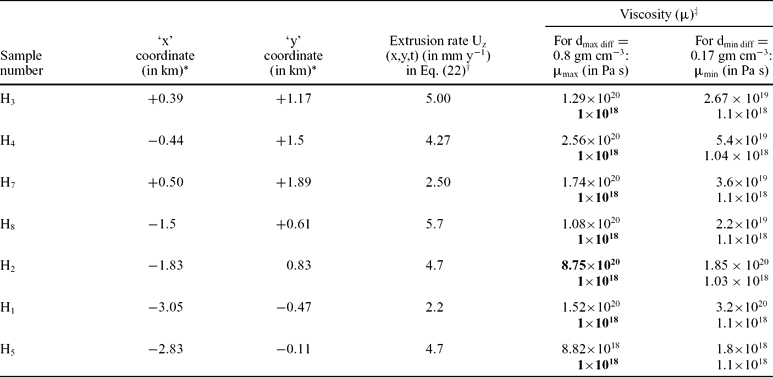
The viscosity (μ) of the salt of the Hormuz diapir is estimated from Eq. 22 in the Appendix which considers the diapiric cross-section to be elliptical (Table 1). The centre of the ellipse through which its major and minor axes pass is given in figure 9a of Bruthans et al. (Reference Bruthans, Filippi, Geršl, Zare, Melková, Pazdur and Bosák2006). The coordinate axes, X and Y, chosen in this work are coincident with the W–E major and the N–S minor axes of the cross-section. The east and the north directions are taken as positive. The seven locations on this cross-section where Bruthans et al. (Reference Bruthans, Filippi, Geršl, Zare, Melková, Pazdur and Bosák2006) obtained uplift rates are converted into (x,y) coordinates in Table 1. Negative values of some of the ‘x’ (or ‘y’) coordinates indicate that those points are west (or south) of the centre of the diapir.
Table 1. Calculation of the viscosity of the Hormuz diapir

*Calculated from figure 2 of Bruthans et al. (Reference Bruthans, Filippi, Geršl, Zare, Melková, Pazdur and Bosák2006)
†Calculated from figure 9a of Bruthans et al. (Reference Bruthans, Filippi, Geršl, Zare, Melková, Pazdur and Bosák2006)
‡Calculation of viscosity (μ) using Eq. (22)
Calculation of viscosity (μ) of salt of the Hormuz diapir, taking into account (1) its elliptical cross-section with the length of the major and minor axes, ‘X’ and ‘Y’, along the east–west and the north–south directions, as ‘2a’ = 8.5 km and ‘2b’ = 6 km, respectively (Bruthans et al. Reference Bruthans, Filippi, Geršl, Zare, Melková, Pazdur and Bosák2006); (2) the rate of salt extrusion Uz(x,y,t); (3) the respective coordinates (x,y); and (4) the maximum (dmax diff = 0.8 gm cm−3) and the minimum (dmin diff = 0.17 gm cm−3) density differences between the salt and the surrounding limestone. Eq. (22) is used to calculate ‘μ’. The parameters Uz(x,y,t) and (x,y) are obtained from figures 2 and 9a, respectively, of Bruthans et al. (Reference Bruthans, Filippi, Geršl, Zare, Melková, Pazdur and Bosák2006). Out of 28 calculated viscosity values, the maximum and the minimum values (8.75 × 10²⁰ Pa s ~ 1021 Pa s and 1018 Pa s) are shown in bold.
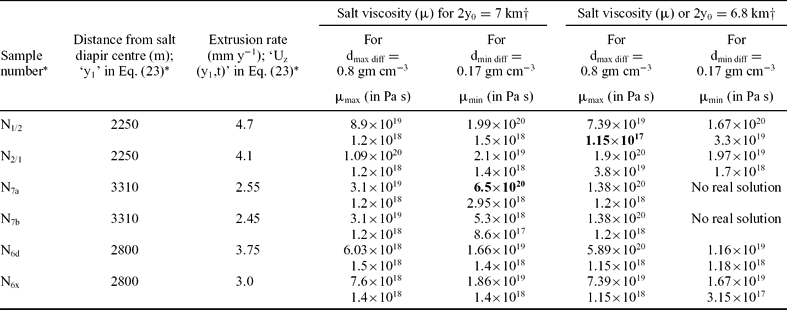
In their figure 9b, Bruthans et al. (Reference Bruthans, Filippi, Geršl, Zare, Melková, Pazdur and Bosák2006) did not show the centre of the Namakdan diapir. This prevented locating the coordinate axes on its cross-section, transforming locations of known uplift rates into coordinates, and in effect, estimating the viscosity considering the more precise geometry of the cross-section. However, Bruthans et al. (Reference Bruthans, Filippi, Geršl, Zare, Melková, Pazdur and Bosák2006, fig. 10) did locate uplift rates from the centre. Alternately, therefore, the viscosity of the Namakdan diapir is estimated (Table 2) taking its cross-section to be circular, using Eq. 23 in the Appendix. In this calculation, the equation requires only the distances of sample locations from the centre (the ‘y1’ parameters) and not the location of the centre. We note that the cross-section is actually sub-circular with a very low ellipticity e = m n−1 = 1.03 (m = 7 km and n = 6.8 km: Bruthans et al. Reference Bruthans, Filippi, Geršl, Zare, Melková, Pazdur and Bosák2006). This indicates that the viscosity calculated assuming a circular cross-section tentatively holds good for the elliptical geometry.
Table 2. Calculation of the viscosity of the Namakdan diapir

*From figure 9b of Bruthans et al. (Reference Bruthans, Filippi, Geršl, Zare, Melková, Pazdur and Bosák2006); †salt viscosity (μ) calculated using Eq. (23).
Calculation of viscosity (μ) of salt of the Namakdan diapir considering (1) its sub-circular cross-section as circular and taking the major (7 km) and minor axes (6.8 km) as diameters in two sets of calculations; (2) the ‘y1’ values as obtained from figure 9b of Bruthans et al. (Reference Bruthans, Filippi, Geršl, Zare, Melková, Pazdur and Bosák2006), these are presented here in a column; and (3) the density values, dmax diff and dmin diff, as per caption of Table 1. Eq. (23) is used to calculate ‘μ’. The maximum and the minimum of 44 calculated viscosities (6.5 × 10²⁰ Pa s ~1021 Pa s and 1.15 × 10¹⁷ Pa s ~1017 Pa s), are shown in bold in the table.
3. Results and conclusions
The equations of velocity profiles involve the previously mentioned (Section 2) parameters (i) to (vii) for the elliptical cross-section (Eq. 22) of the Hormuz diapir, and (i) to (v) and (vi′) and (vii′′) for the circular cross-section of the Namakdan diapir (Eq. 23). These profiles are the quadratic equations of salt viscosity. Therefore, for a single set of these parameters at each sample point, two possible values of viscosities can be obtained. In total, the maximum and minimum values of density difference between the salt and the limestone for the Hormuz diapir give rise to four probable values bracketing ranges of salt viscosity (Table 1). In the case of the Namakdan diapir, the viscosity of the salt is estimated additionally using the two possible values of the radius of the cross-section, thus giving rise to a total of eight possible values for viscosities at each sample point (Table 2). We chose a range in densities for the salt and limestone from the literature because (1) their absolute values for the diapirs in the Persian Gulf are not available, and (2) their values may be affected by ‘small proportions of impurities’ (cf. Bruthans et al. Reference Bruthans, Asadi, Filippi, Vilhelm and Zare2008) and/or extraneous rock fragments (Kent, Reference Kent1958). Thus, the variation in our list of calculated viscosities arises intrinsically from Eqs (22) and (23) in the Appendix and from the rather wide range of parameters inserted into these equations. Our model results are not meant to represent any spatial variation of viscosity within either diapir, but instead show the possible variation in estimates of a single representative value. We also note that rock salts may deform maintaining a power-law rheology on scales smaller than kilometres (e.g. Critescu & Hunsche, Reference Critescu and Hunsche1998). However, our estimation took no account of power-law rheology. Our treatment here has been essentially the first order approach of assigning a single viscosity to the whole salt sequence based on the simple parabolic extrusion profiles deduced for both diapirs by Bruthans et al. (Reference Bruthans, Filippi, Geršl, Zare, Melková, Pazdur and Bosák2006). This is a common practice in the literature of salt tectonics, especially in analogue modelling and numerical modelling (e.g. Talbot & Jarvis, Reference Talbot and Jarvis1984; Poliakov et al. Reference Poliakov, Podladchikov, Dawson, Talbot, Alsop, Blundell and Davison1996; Talbot et al. Reference Talbot, Medvedev, Alavi, Shahrivar, Heidari, Blundell and Scott2000; Schultz-Ela & Walsh, Reference Schultz-Ela and Walsh2002; Talbot, Reference Talbot, Cristescu, Hardy and Simionescu2002; Schultz-Ela, Reference Schultz-Ela2003; Mouthereau, Lacombe & Meyer, Reference Mouthereau, Lacombe and Meyer2006; Chemia & Koyi, Reference Chemia and Koyi2008).
The dynamic viscosity of the salt in the Hormuz diapir lies in the range of 1018–1021 Pa s considering its extrusion through an elliptical cross-section (Table 1; no. 38 of Table 3). The viscosity of the salt in the Namakdan diapir has been estimated by considering its sub-circular cross-section as circular. The calculated range of viscosity is 1017–1021 Pa s (Table 2; no. 39 of Table 3).
Table 3. A review of salt viscosities

Thirty-seven values of salt viscosities presented by other authors after they surveyed the literature are tabulated in rows 1–37. The ranges of viscosities for the Hormuz and Namakdan diapirs calculated in this work are presented in rows 38 and 39.
A concise review of viscosity of salts is made in Table 3 in numbers 1 to 37. We excluded viscosity values of salts in a bi-viscous medium as given by Zulauf et al. (Reference Zulauf, Zulauf, Bornemann, Kihm, Peinl and Zanella2008). The range of viscosities calculated for the salts of the Hormuz and Namakdan diapirs broadly matches earlier values reported for flowing salt (Table 3, no. 32). The estimated ranges are broader than that for Newtonian salts (Table 3, no. 19), higher than that for the average value of salt (Table 3, no. 21) and also that for salts at room temperature (Table 3, no. 26). On the other hand, the deduced ranges match with the viscosity values for other salt diapirs (Table 3, nos 3, 5, 11, 27 and 33), though not with all of them (Table 3, no. 10). Further, matches with some of the previously estimated viscosities (Table 3, nos 2, 17, 18 and 20) suggest that the salt in these diapirs might have a broad range in grain-size. Interestingly, while the reported grain sizes of Hormuz salts range from > 10 mm up to 15 mm or even 4 cm, those in the Namakdan diapir vary from 3 to 8 mm (Bruthans et al. Reference Bruthans, Asadi, Filippi, Vilhelm and Zare2008, table 3; Talbot, Aftabi & Chemia, Reference Talbot, Aftabi and Chemia2009). This crudely matches with the predicted wide range of grain sizes of salts. The estimated range of viscosities of these two diapirs can be useful in their tectonic modelling.
Acknowledgements
SM acknowledges a 2005–2006 ‘Guest Scholarship’ at Uppsala University from the Swedish Institute to initiate this work and a ‘Seed Grant’ (Spons/GS/SM-1/2009) from the Indian Institute of Technology Bombay to finish the work. HAK was supported by the Swedish Research Council. Conscientious criticism by Jiri Mls (Charles University) of an earlier version and two anonymous reviewers of Geological Magazine led us to clarify the model further. Jiri Bruthans (Charles University) updated us about salt diapirs in the Persian Gulf.
Appendix
The Poisson equation of rectilinear flow of an incompressible Newtonian viscous fluid in the Z-direction, in an infinitely long parallel-wall inclined channel, is given by:
Eq. (1) is the same as equation 6.190 of Papanastasiou, Georgiou & Alexandrou (Reference Papanastasiou, Georgiou and Alexandrou2000) but with our choice of symbols (see Fig. 5). Here ‘X’ and ‘Y’ are the mutually perpendicular axes, both of which are perpendicular to the ‘Z’ direction. ‘X’ and ‘Y’ lie on the cross-section of the channel. ‘Uz’: velocity of the fluid in the Z-direction. μ: dynamic viscosity of the fluid. (∂P/∂x): pressure gradient in the fluid along the X-direction. d1: density of the fluid. g: acceleration due to gravity. θ: inclination of the channel.
Referring to Figure 5, we now consider that (1) the channel is very long so as to develop a channel flow but of finite length (= 10 km and 8 km for the two diapirs); (2) the channel is vertical; (3) the fluid rises up the channel due to pressure exerted by the surrounding overburden of higher density on the horizontal source layer; and (4) the cross-section of the channel is elliptical with ‘X’ and ‘Y’ as the major and the minor axes with lengths ‘2a’ and ‘2b’, respectively. From constraint (2), d1 g Sinθ = d1 g. Applying this and constraint (3), (∂P/∂x) = [d2 g − Pout(t) H−1], where Pout(t) stands for the pressure exerted by the extruded fluid. Therefore, the resultant pressure gradient acting vertically upward on the fluid channel ‘A’ at depth H, that is, the expression [(∂P/∂x) − d1 g Sinθ] in Eq. (1), is equal to [g (d2 − d1) − Pout(t) H−1]. Thus, Eq. (1) becomes
Let Uz(x,y,t) be the velocity of the extruding fluid at coordinate (x,y) at an instant in time ‘t’. Considering the channel walls to be static during the fluid flow, the boundary condition is Uz(x,y,t) = 0 at
A dependent variable U′z is introduced such that
Here ‘c1’ and ‘c2’ are non-zero constants and are to be solved so that: (1) U′z(x, y, t) satisfies the Laplace equation, and (2) U′z(x, y, t) is constant on the wall at a particular instant ‘t’. Substituting Eq. (4) into Eq. (2),
U′z(x) will satisfy the Laplace Equation:
if
From the boundary condition (Eq. 3),
Writing
U′z(x, y, t) is constant at the channel boundary at a particular instant ‘t’:
According to the maximum principle for the Laplace equation, U′z(x, y, t) has both its minimum and maximum values on the boundary of the domain. This means that U′z(x, y, t) is constant over the whole domain at a particular time:
Putting Eq. (11) into Eq. (4), and using Eq. (9):
or
The constant ‘c1’ is obtained from Eq. (7) and Eq. (9):
Putting the ‘c1’ value of Eq. (14) into Eq. (13):
Integrating the velocity profile given by Eq. (15) over the elliptical cross-section gives the volumetric flow rate:
In Eq. (16) and onwards, we assume that no part of the extruded salt flows outside the cross-section. Dividing Q(t) by the area of the elliptical cross-section (A=π a b) gives the volumetric flow rate per unit area as follows:
Equating Q′(t) with the pressure buildup in extrusion gives
The solution of Eq. (18) with the boundary condition P(0) = 0 is
where the ‘characteristic time’ (τ) (cf. Weinberger et al. Reference Weinberger, Lyakhovsky, Baer and Begin2006) has the following form:
Expanding the exponential series, neglecting terms higher than the second order, Eq. (19) becomes
Substituting this value of Pout(t) from Eq. (21) into Eq. (15), and neglecting the negative sign on the right hand side, the absolute value of the velocity, Uz (x,y,t), is obtained as
For a circular cross-section, putting a = b = y0, the radius of the circle; and y1 = (x2 + y2)0.5, the distance of the centre; the velocity profile, given by Eq. (22), simplifies to
The ‘characteristic time’ (Weinberger et al. Reference Weinberger, Lyakhovsky, Baer and Begin2006), in this case, simplifies to
Until Eq. (15), our derivations follow steps similar to Papanastasiou, Georgiou & Alexandrou (Reference Papanastasiou, Georgiou and Alexandrou2000), and derivations from Eq. (16) until Eq. (22) follow Weinberger et al. (Reference Weinberger, Lyakhovsky, Baer and Begin2006) while maintaining the physical boundary conditions appropriate for our problem. The extrusion parameters and the channel geometry of the diapirs are equated with the above fluid mechanical model as follows:
(x,y): coordinates of locations of known uplift rates on elliptical cross-section. These coordinates have been used in Eq. (22) and in Table 1.
Uz(x,y,t): velocity of the extruded salt at the coordinate (x,y) at instant ‘t’, for extrusion through an elliptical cross-section. Symbol used in Eq. (22) and in Table 1.
τ: the ‘characteristic time’ of salt extrusion (see Weinberger et al. Reference Weinberger, Lyakhovsky, Baer and Begin2006 for definition), for the cases of both the elliptical and circular cross-sections of the diapir.
Symbols used in Eqs (20) and (24), respectively:
2a, 2b: length of the major and minor axes of the elliptical cross-section of the diapir; 8.5 km and 6.8 km, respectively, for the Hormuz salt diapir (Bruthans et al. Reference Bruthans, Filippi, Geršl, Zare, Melková, Pazdur and Bosák2006); symbols used in Eq. (22) and in Table 1.
2y0: diameter of the circular cross-section. Symbol used in Eq. (23) and in Table 2. For the two diapirs, the diameters are considered as the major and minor axes of the elliptical cross-section of the Namakdan diapir: 2y0 = 7 km and 6.8 km.
Uz (y1,t): velocity of the extruded salt at a distance y1 from the centre of the diapir and at instant ‘t’, for extrusion through a circular cross-section. Symbol used in Eq. (23) and in Table 2.
μ: dynamic viscosity of the salts of the two diapirs; symbol used in Eqs (20) to (24) and in Tables 1 and 2.
d1, d2: density of salt and that of the limestone, whose natural ranges are between 2.0–2.2 gm cm−3 and 2.37–2.8 gm cm−3, respectively (Mizutani, Reference Mizutani, Uemura and Mizutani1984). This gives dmax diff = (d2 − d1)max = 0.8 gm cm−3. (for d1 = 2 gm cm−3, d2 = 2.8 gm cm−3) and dmin diff = (d2 − d1)min = 0.17 gmcm−3 (for d1 = 2.2 gm cm−3, d2 = 2.37 gm cm−3). These values of ‘dmax diff’ and ‘dmin diff’ are used in (d2 − d1) in Eqs (22) to (24), and in Tables 1 and 2 in calculating the ‘μ’ of salts.
H: length of the stem of the diapir; H = 10 km and 8 km for the Hormuz and Namakdan diapirs, respectively (Koop & Stonely, Reference Koop and Stonely1982; Bahroudi & Talbot, Reference Bahroudi and Talbot2003).
t: span of diapirism for the Hormuz and Namakdan diapirs. t = 104 yrs (Bruthans et al. Reference Bruthans, Filippi, Geršl, Zare, Melková, Pazdur and Bosák2006).


