


1. Introduction
The eastern North China Craton (NCC) has experienced extensive lithosphere thinning since the Late Mesozoic (Wu et al. Reference Wu, Lin, Wilde, Zhang and Yang2005; Li, Reference Li2010; J. W. Li et al. Reference Li, Bi, Selby, Chen, Vasconcelos, Thiede, Zhou, Zhao, Li and Qiu2012; Zhang, Reference Zhang2012; Zhu et al. Reference Zhu, Jiang, Zhang and Chen2012 a; Zheng, Xiao & Zhao, Reference Zheng, Xiao and Zhao2013; Qiu et al. Reference Qiu, Zuo, Chang and Li2014, Reference Qiu, Zuo, Xu, Li, Chang and Zhu2016; Zhai, Reference Zhai2014; He, Reference He2015). Several studies have provided various lines of evidence for lithosphere thinning in the eastern NCC including the geochronology and petrogenesis of magmatic suites (Gao et al. Reference Gao, Rudnick, Yuan, Liu, Liu, Xu, Ling, Ayers, Wang and Wang2004; Cai et al. Reference Cai, Fan, Santosh, Liu, Hu, Yang, Lan, Yang and Liu2013; Yang & Santosh, Reference Yang and Santosh2015; Dai, Zheng & Zhao, Reference Dai, Zheng and Zhao2016), high-resolution seismic wave tomographic modelling of crust and mantle (Huang & Zhao, Reference Huang and Zhao2006; Santosh, Reference Santosh2010; Zhu et al. Reference Zhu, Chen, Wu and Liu2011, Reference Zhang2012 b), gravity, geoid and topographic data (Xu et al. Reference Xu, Zeyen, Hao, Santosh, Li, Huang and Xing2016), and identification of crustal extensional deformation including metamorphic core complex, detachment fault and rift basin (S. Z. Li et al. Reference Li, Bi, Selby, Chen, Vasconcelos, Thiede, Zhou, Zhao, Li and Qiu2012 a; Charles et al. Reference Charles, Augier, Gumiaux, Monie, Chen, Faure and Zhu2013; Zhu et al. Reference Zhu, Chen, Jiang and Lin2015). It has been suggested that the most intense lithosphere thinning occurred in the Early Cretaceous, as evidenced by the widely developed magmatic suites and extensional structures (Wu et al. Reference Wu, Xu, Gao and Zheng2008; Zhang et al. Reference Zhang, Zhao, Davis, Ye and Wu2014). Because Late Cretaceous magmatic rocks are scarce, it was considered that the lithosphere thinning of the NCC was accomplished before the Late Cretaceous (Zhang et al. Reference Zhang, Sun, Zhou, Zhou, Fan and Zheng2003 a; Ying et al. Reference Ying, Zhang, Kita, Morishita and Shimoda2006; Wu et al. Reference Wu, Xu, Gao and Zheng2008). Nevertheless, the occurrence of Early Cretaceous intrusive rocks suggests that a later uplift might have occurred after the formation of the intrusions. Information from sedimentations such as those from the Bohai Bay Basin, the North Yellow Sea Basin and South Yellow Sea Basin also confirmed that the lithosphere thinning continued after the Late Cretaceous (Yoon et al. Reference Yoon, Lee, Han, Yoo, Han, Choi and Lee2010; Guo, Santosh and Li, Reference Guo, Liu, He, Song, Wang, Hao and Wang2012; S. Z. Li et al. Reference Li, Zhao, Dai, Liu, Zhou, Santosh and Suo2012 b; W. Y. Li et al. Reference Li, Bi, Selby, Chen, Vasconcelos, Thiede, Zhou, Zhao, Li and Qiu2012). Owing to the coal and hydrocarbon potentialities, the evolution and tectonic settlement of these basins have been well constrained (Allen et al. Reference Allen, MacDonald, Zhao, Vincent and Brouet-Menzies1997; Guo et al. Reference Guo, Liu, He, Song, Wang, Hao and Wang2012; S. Z. Li et al., Reference Li, Bi, Selby, Chen, Vasconcelos, Thiede, Zhou, Zhao, Li and Qiu2012 a; Chen et al. Reference Chen, Li, Dong, Pang, Wang, Ren and Zhang2016). However, the timing and extent of crustal uplift in the mainland of the eastern NCC remain equivocal.
The Jiaodong gold province, located within the eastern NCC, hosts several world-class gold deposits and is currently the largest gold producer in China, with a total gold endowment of >3000 t (>3×10⁶ kg) (Goldfarb & Santosh, Reference Goldfarb and Santosh2014; Song et al. Reference Song, Li, Santosh, Zhao, Yu, Yi, Cui, Lv, Xu, Song and Zhou2015; Deng & Wang, Reference Deng and Wang2016). The gold mineralization depths estimated from the trapping pressure of fluid inclusions remain controversial (Groves & Santosh, Reference Groves and Santosh2016). Previous studies show a large range in the depths of gold mineralization, such as 4–8 km for the Sanshandao deposit (Fan et al. Reference Fan, Zhai, Xie and Yang2003), 2–6 km for the Taishang deposit (Yang et al. Reference Yang, Deng, Guo, Wang, Li and Li2016 a) and 2.6–7 km for the Xincheng deposit (Yang et al. Reference Yang, Deng, Guo, Wang, Li and Li2016 b). In contrast, Wen et al. (Reference Wen, Fan, Santosh, Hu, Pirajno and Yang2015) proposed a greater depth range of 8.4–12.5 km for the Linglong deposit. In order to evaluate this controversy and constrain the depths of formation for these world-class gold deposits, the denudation history in the Jiaodong Peninsula was considered in this study.
We carried out fission track (FT) analysis of zircon and apatite grains from the major Mesozoic intrusive suites in Jiaodong, to evaluate the crustal uplift history and constrain the mineralization depth. The FT in apatite has been shown to be stable at temperatures below ~60°C. In the temperature interval between 60°C and 120°C (partial annealing zone; PAZ), it is only partially retained with a mean closure temperature at 110±10°C (Green & Duddy, Reference Green and Duddy1989). The zircon FT has a closure temperature of ~250°C (Yamada et al. Reference Yamada, Tagami, Nishimura and Ito1995) and a PAZ temperature of 140–300°C (Guedes et al. Reference Guedes, Hadler, Iunes, Oliveira, Moreira and Tello2005). Therefore, a combined FT analysis on zircon and apatite from the same samples could provide a robust means to reconstruct the time–temperature history in the Jiaodong gold province.
2. Geological background
East Asia is marked by large-scale continental extension during the Late Mesozoic and constitutes a wide rift system (Charles et al. Reference Charles, Augier, Gumiaux, Monie, Chen, Faure and Zhu2013). The eastern NCC is characterized by thin lithosphere (60–120 km) and high heat flow, with numerous Early Cretaceous magmatic suites (Wu et al. Reference Wu, Lin, Wilde, Zhang and Yang2005; J. W. Li et al. Reference Li, Bi, Selby, Chen, Vasconcelos, Thiede, Zhou, Zhao, Li and Qiu2012; Guo, Santosh & Li, Reference Guo, Santosh and Li2013), rift basins and metamorphic core complexes (Zhu et al. Reference Zhu, Jiang, Zhang and Chen2012 a; Zhang et al. Reference Zhang, Zhao, Davis, Ye and Wu2014). However, peridotite xenoliths from Middle Ordovician kimberlites confirmed that the NCC had a thick (~200 km), ancient and refractory lithosphere root in the Early Paleozoic (Fan et al. Reference Fan, Zhang, Baker, Jarvis, Mason and Menzies2000; Deng & Wang, Reference Deng and Wang2016), implying that the lithosphere has experienced extensive thinning since then. It has been suggested that the peak of lithosphere thinning in the eastern NCC occurred during the Early Cretaceous, accompanied by asthenosphere upwelling, extensive magmatism, and crust extension (Wu et al. Reference Wu, Lin, Wilde, Zhang and Yang2005; Zhang et al. Reference Zhang, Zhao, Davis, Ye and Wu2014). Various mechanisms have been proposed to explain the lithosphere thinning in the Early Cretaceous, such as a thermo-chemical erosion model (Xu et al. Reference Xu, Huang, Ma, Wang, Iizuka, Xu, Wang and Wu2004), delamination of the lower crust and lithospheric mantle (Gao et al. Reference Gao, Rudnick, Yuan, Liu, Liu, Xu, Ling, Ayers, Wang and Wang2004; Wu et al. Reference Wu, Lin, Wilde, Zhang and Yang2005), and tectonic extension (Liu et al. Reference Liu, Shen, Ji, Guan, Zhang and Zhao2013; Ji et al. Reference Ji, Liu, Hu, Shen and Guan2015). The driving force of lithosphere thinning during this period was suggested to be the rollback of the Pacific plate (Li & Li, Reference Li and Li2007; Jiang et al. Reference Jiang, Jiang, Dai, Liao, Zhao and Ling2009; Kiminami & Imaoka, Reference Kiminami and Imaoka2013), which subducted at the end of the Early Jurassic or the beginning of the Middle Jurassic (~180 Ma) (Jiang et al. Reference Jiang, Jiang, Ling and Ni2010; Ma et al. Reference Ma, Jiang, Hofmann, Dai, Hou, Zhao, Chen, Li and Jiang2014).
The Jiaodong gold province is located along the southeastern margin of the NCC and surrounded by several Mesozoic–Cenozoic rift basins (Fig. 1). The province is composed of the Northwest Jiaodong and Sulu belt which formed during the Triassic collision between the NCC and South China Block (Charles et al. Reference Charles, Augier, Gumiaux, Monie, Chen, Faure and Zhu2013; Zhao et al. Reference Zhao, Liu, Pan and Zhou2015). The gold mineralization occurred at ~120 Ma and is associated with fault-controlled pyrite–quartz veins and stockworks that occur mainly within Mesozoic granitic plutons (Deng et al. Reference Deng, Wang, Wei, Wang, Sun and Yang2004, Reference Deng, Wang, Wan, Liu, Yang and Zhang2011; Wang et al. Reference Wang, Deng, Wan, Yang and Gong2007; Guo, Santosh & Li, Reference Guo, Santosh and Li2013; Yang et al. Reference Yang, Santosh, Shen and Li2014). The metamorphic core complexes and magmatic suites within the Jiaodong gold province and the extensional sedimentary basins to the southeast are considered to have resulted from large-scale rifting during the Late Jurassic – Early Cretaceous (S. Z. Li et al. Reference Li, Bi, Selby, Chen, Vasconcelos, Thiede, Zhou, Zhao, Li and Qiu2012 a; Zhu et al. Reference Zhu, Jiang, Zhang and Chen2012 a). Charles et al. (Reference Charles, Augier, Gumiaux, Monie, Chen, Faure and Zhu2013) performed 40Ar/39Ar analysis on the metamorphic core complex, and constrained its cooling and deformation ages at ~143–128 Ma. The Late Jurassic to Early Cretaceous granitic plutons in Jiaodong show a remarkable decrease in Sr/Y and Nb/Ta ratios, suggesting a conspicuous crust denudation in the Early Cretaceous (Goss et al. Reference Goss, Wilde, Wu and Yang2010; Zhang et al. Reference Zhang, Zhao, Zheng and Dai2010; Zhao et al. Reference Zhao, Wang, Liu, Wang and Pan2016).

Figure 1. Geological map of North China Craton and adjacent regions. The data of low temperature thermochronology from Hu et al. (Reference Hu, Hao, Fu, Wu and Wang2005), Liu et al. (Reference Liu, Weber, Glasmacher, Xu and Wanger2009), Cao et al. (Reference Cao, Li, Xu, Guo, Liu, Zhao, Liu and Dai2015), Wu et al. (Reference Wu, Monie, Wang, Lin, Ji, Bonno, Munch and Wang2016), and references therein. The age data of basaltic rocks from Dong et al. (Reference Dong, Xiao, Zhou, Du, Zhang, Xiang, Wang, Zhao and Huang2010), Li, Huang & Guo (Reference Li, Huang and Guo2014), Zhang et al. (Reference Zhang, Zhao, Davis, Ye and Wu2014), Meng et al. (Reference Meng, Gao, Niu, Liu and Wang2015), and references therein. Modified from Tang, Zhang & Ying (Reference Tang, Zhang and Ying2006), Yoon et al. (Reference Yoon, Lee, Han, Yoo, Han, Choi and Lee2010), Zhu et al. (Reference Zhu, Jiang, Zhang and Chen2012 a) and Zhang et al. (Reference Zhang, Zhao, Davis, Ye and Wu2014).
A number of Cretaceous–Neogene basins formed around the eastern margin of the NCC, including the Bohai Bay Basin and North Yellow Sea Basin in the north and the South Yellow Sea Basin in the south (Fig. 1) (Shinn, Chough & Hwang, Reference Shinn, Chough and Hwang2010). Subsidence in the Late Cretaceous – Paleogene basins is well documented on the basis of sedimentary records (Yoon et al. Reference Yoon, Lee, Han, Yoo, Han, Choi and Lee2010; Guo et al. Reference Guo, Liu, He, Song, Wang, Hao and Wang2012; S. Z. Li et al. Reference Li, Bi, Selby, Chen, Vasconcelos, Thiede, Zhou, Zhao, Li and Qiu2012 b; W. Y. Li et al. Reference Li, Bi, Selby, Chen, Vasconcelos, Thiede, Zhou, Zhao, Li and Qiu2012). The Bohai Bay Basin is an extensional and superimposed Meso-Cenozoic basin, and its rifting began in the Late Cretaceous and continued until the Late Paleogene (Chen et al. Reference Chen, Li, Dong, Pang, Wang, Ren and Zhang2016; Liu et al. Reference Liu, He, Huang and Zhang2016). The basin experienced Paleocene – Early Eocene rifting which resulted in the deposition of the Kongdian Formation and the lower members of the Shahejie Formation (Allen et al. Reference Allen, MacDonald, Zhao, Vincent and Brouet-Menzies1997). The North Yellow Sea Basin shows the most conspicuous subsidence history during the Paleogene (W. Y. Li et al. Reference Li, Bi, Selby, Chen, Vasconcelos, Thiede, Zhou, Zhao, Li and Qiu2012). The South Yellow Sea Basin initially rifted during Late Jurassic – Cretaceous and was filled with a thick (~6000 m) Cretaceous to Paleogene nonmarine succession (Shinn, Chough & Hwang, Reference Shinn, Chough and Hwang2010; Yoon et al. Reference Yoon, Lee, Han, Yoo, Han, Choi and Lee2010).
3. Sampling and analytical methods
Thirteen samples were collected from surface exposures and they are all fresh granite or granodiorite from Jurassic–Cretaceous intrusions in the Jiaodong gold province (Fig. 2). The samples were crushed for separating zircon and apatite by conventional heavy-liquid and magnetic techniques. The zircon and apatite grains were mounted in epoxy and PFA Teflon respectively, and were polished to expose the internal grain surface. The zircons were etched in NaOH/KOH (=1:1) eutectic for about 25 h at 210°C. The apatite spontaneous tracks were exposed by 5.5 N HNO3 for 20 s at 21°C. All samples were irradiated in a thermalized neutron flux in the Reactor at Beijing. Neutron fluence was monitored using the CN2 and CN5 uranium dosimeter glasses for zircon and apatite respectively. Low-uranium muscovite close contacting with these measured grains served as an external detector and was etched in 40% HF for 20 min at 25°C after irradiation (Yuan et al. Reference Yuan, Bao, Dong, Guo and Deng2007). Ages calculated using the zeta calibration method and the zeta constant (ζ) are 94.5±3.2 and 410±17.6 for zircon and apatite, respectively. The χ 2 test was used to quantify the homogeneity of all age grains analysed.

Figure 2. (a) Simplified geological map of the Jiaodong Peninsula, identifying the sample locations with zircon and apatite FT ages. AS: Aishan, GJL: Guojialing, GS: Gushan, HY: Haiyang, KYS: Kunyushan, LL: Linglong, WDS: Weideshan, YS: Yashan. The geochronology of fault activity from Deng et al. (Reference Deng, Liu, Wang and Pan2015 b) and references therein; ill: illite, ms: muscovite, bt: biotite. (b) Simplified geological section showing the location of measured samples. (c) Line chart showing the zircon and apatite FT ages, including the age–depth evolution lines of representative samples which were estimated according to the time–temperature histories in Figure 6.
Apatite composition was monitored using a combination of etch pit dimensions (Dpar) and absolute measurement by electron microprobe analysis using a JEOL electron microprobe, with an accelerating voltage of 15 kV, a beam current of 29 nA, and a 20 Am defocused electron beam to avoid problems associated with apatite decomposition (Yuan et al. Reference Yuan, Carter, Dong, Bao, An and Guo2006). Most samples were shown to be fluorapatites with chlorine below detection levels. The apatite FT ages and the confined track length data were used to reconstruct the thermal histories of the study area with the HeFTy software program (Ketcham, Reference Ketcham2005).
4. Analytical results
The samples with P(χ 2) >5%, representing normal single grain age distribution or convergent ages with a single peak (Galbraith, Reference Galbraith1981), yield central ages from 64.3±3.3 to 90.9±4.4 Ma for zircon (Table 1) and from 32.8±1.9 to 50.9±7.8 Ma for apatite (Table 2). In contrast, samples with P(χ 2) <5% represent mixed distributions or divergent ages with two or more peaks. In order to discriminate the different age groups from divergent ages, the binomial peak-fitting method was used to decompose the observed age distributions with the Binomfit software (Brandon, Reference Brandon2002) (Figs 3, 4). The zircon and apatite FT data of convergent ages and decomposed divergent ages collectively show two groups: 60–80 and 30–50 Ma (Fig. 5). The ages display minor differences between the Northwest Jiaodong and Sulu belt (Fig. 2). These age peaks are similar to the time of greatest sediment thickness and most rapid settlement of the surrounding basins (Fig. 5).
Table 1. Zircon fission track dating for granitoids in the Jiaodong gold province

N s: fossil track numbers; N i: induced track numbers; N d: standard track numbers; ρ s, ρ i and ρ d are the track densities corresponding to N s, N i and N d; P(χ 2): χ 2 test probability.
Table 2. Apatite fission track dating for granitoids in the Jiaodong gold province

Abbreviations are the same as in Table 1. Dpar: mean etch pit diameter parallel to the c-axis for age grains; N 1 and N 2: number of measured track lengths and Dpar, respectively.

Figure 3. Radial plots of single zircon grain ages for the granitic samples from Jiaodong.

Figure 4. Radial plots of single apatite grain ages for the granitic samples from Jiaodong.
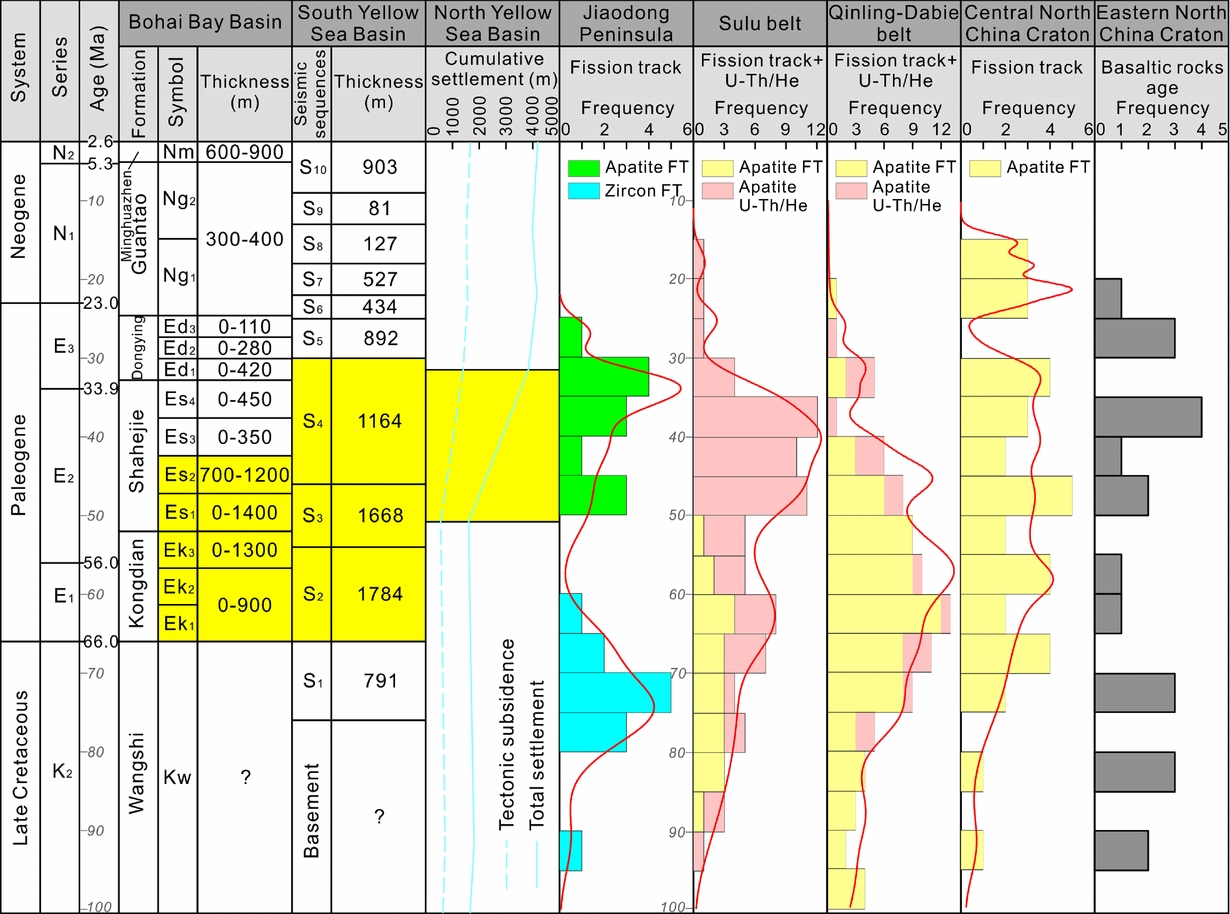
Figure 5. A summary of Late Cretaceous – Cenozoic basin development, regional uplift and basaltic magmatism in the eastern NCC. Modified after Guo et al. (Reference Guo, Liu, He, Song, Wang, Hao and Wang2012), Yoon et al. (Reference Yoon, Lee, Han, Yoo, Han, Choi and Lee2010) and W. Y. Li et al. (Reference Li, Bi, Selby, Chen, Vasconcelos, Thiede, Zhou, Zhao, Li and Qiu2012). Source of the age data is the same as in Figure 1.
The apatite Dpar values vary from 1.26 to 1.68 μm (<1.75 μm) (Table 2), and are generally considered fast-annealing in typical calcian-fluoro apatites (Donelick, O'Sullivan & Ketcham, Reference Donelick, O'Sullivan and Ketcham2005). The apatite mean track lengths range between 12.1±2.2 and 13.9±1.9 μm (Table 2), and mainly show unimodal and symmetric track-length frequency distribution (Fig. 6). During time–temperature modelling, the parameters were set according to the maximal single apatite grain FT age at 130°C, and the present surface temperature was set at 20°C (Yuan et al. Reference Yuan, Carter, Dong, Bao, An and Guo2006, Reference Yuan, Bao, Dong, Guo and Deng2007). The representative inverse modelling of time–temperature evolution is shown in Figure 6. The cooling paths of samples with maximal age older than 60 Ma exhibit a fairly similar cooling history, starting with a Late Cretaceous (~80 Ma) cooling event which brought the granitoids into the apatite PAZ (~110±10°C), followed by a period of relatively quick cooling during 80–30 Ma, then a stage of rapid cooling at ~20 Ma. The time–temperature evolution of samples with an age maximum at c. 60 Ma also reveals similar cooling history, starting with a Paleocene (~60 Ma) cooling event which brought the granitoids into the apatite PAZ (~110±10°C), followed by a period of relatively quick cooling during 60–30 Ma, and a stage of rapid cooling at ~20 Ma (Fig. 6). This quick cooling time of 30–80 Ma is consistent with the peaks in age data histograms for zircon and apatite FT ages (Fig. 5).

Figure 6. Time–temperature histories calculated by inverse modelling of the measured apatite FT parameters with the HeFTy program, based on the annealing model (Ketcham, Reference Ketcham2005). The measured track length distributions are shown as a histogram, and the modelled one for the most probable thermal history as a line. The Kolmogorov–Smirnov test was used to determine similarity between the measured and modelled apatite FT age and length parameters (Yuan et al. Reference Yuan, Bao, Dong, Guo and Deng2007). For each of these statistics, the ‘good’ and ‘acceptable’ results correspond to goodness-of-fit (GOF) values of higher than 0.50 and 0.05, respectively.
5. Discussion
5.a. Lithospheric evolution process since Late Cretaceous
It is widely considered that lithospheric destruction of the NCC reached its peak in the Early Cretaceous, with extensive magmatism, development of metamorphic core complex and extensional basins, as well as gold mineralization (Gao et al. Reference Gao, Rudnick, Yuan, Liu, Liu, Xu, Ling, Ayers, Wang and Wang2004; Deng et al. Reference Deng, Su, Niu, Liu, Zhao, Zhao, Zhou and Wu2007; Yang et al. Reference Yang, Wu, Wilde, Belousova and Griffin2008; Xu et al. Reference Xu, Yang, Gao, Pei and Yu2010; Zhu et al. Reference Zhu, Chen, Wu and Liu2011, Reference Zhu, Xu, Zhu, Zhang, Xia and Zheng2012 b; J. W. Li et al. Reference Li, Bi, Selby, Chen, Vasconcelos, Thiede, Zhou, Zhao, Li and Qiu2012; Zhang et al. Reference Zhang, Zhao, Davis, Ye and Wu2014). However, the timing of cessation of this event remains controversial. Some workers suggested that the dramatic lithosphere thinning of the NCC was accomplished before the Late Cretaceous (Zhang et al. Reference Zhang, Sun, Zhou, Zhou, Fan and Zheng2003 a; Ying et al. Reference Ying, Zhang, Kita, Morishita and Shimoda2006; Wu et al. Reference Wu, Xu, Gao and Zheng2008). In contrast, others proposed that the continuous lithosphere thinning in NCC lasted until the Early Cenozoic (Xu et al. Reference Xu, Li, Pang and He2009; Li, Huang & Guo, Reference Li, Huang and Guo2014, Qiu et al. Reference Qiu, Zuo, Chang and Li2014, Reference Qiu, Zuo, Xu, Li, Chang and Zhu2016; He, Reference He2015; Li et al. Reference Li, Guo, Xu, Somerville, Cao, Yu, Wang, Suo, Liu and Zhao2015).
The igneous activity, especially asthenospheric mantle-derived magmatism, and basin evolution can constrain the timescale of lithosphere thinning and decratonization in the NCC. The Late Cretaceous basaltic rocks mainly distributed in Liaoning Province (70.1–92.5 Ma) (Zhang et al. Reference Zhang, Xu, Ge and Ma2006; Kuang et al. Reference Kuang, Wei, Hong, Ma, Pang, Zhong, Zhao and Xu2012), Shandong Province (73.5 Ma) (Yan et al. Reference Yan, Chen, Xie and Zhou2003) and Bohai Bay Basin (71.5 Ma) (Zhang et al. Reference Zhang, Ma, Liao, Zhang and She2011) in the eastern NCC (Fig. 1). The Cenozoic basaltic rocks were reported in Liaoning Province (36.3–60.1 Ma) (Kuang et al. Reference Kuang, Wei, Hong, Ma, Pang, Zhong, Zhao and Xu2012; Meng et al. Reference Meng, Gao, Niu, Liu and Wang2015) and Bohai Bay Basin (23.3–46.9 Ma) (Dong et al. Reference Dong, Xiao, Zhou, Du, Zhang, Xiang, Wang, Zhao and Huang2010; Li, Huang & Guo, Reference Li, Huang and Guo2014). There basaltic rocks are characterized by low SiO2, high MgO contents, enrichment of light rare earth elements and large ion lithophile elements, no depletion of high field strength elements, low initial 87Sr/86Sr ratios and various Ɛ Nd(t) values. These characters indicate a derivation from depleted asthenospheric mantle with minor contamination by enriched lithospheric mantle (Zhang et al. Reference Zhang, Zhao, Davis, Ye and Wu2014), implying the Cenozoic craton destruction and lithosphere thinning were associated with convective asthenosphere upwelling and lithosphere thermal structure modification (Xu et al. Reference Xu, Li, Pang and He2009).
The shallow tectonics of denudation and sedimentation were coupled with the deep-seated tectonic processes of lithosphere thinning and magma underplating. Late Cretaceous – Paleogene basins occur widely in the eastern NCC and neighbouring area (Fig. 1). The rifting of Bohai Bay Basin began at the Late Cretaceous and continued until the Late Paleogene (Chen et al. Reference Chen, Li, Dong, Pang, Wang, Ren and Zhang2016; Liu et al. Reference Liu, He, Huang and Zhang2016), and thick sedimentary rocks of the Kongdian and Shahejie formations (~42–66 Ma) formed in this basin. The South Yellow Sea Basin rifted during the Late Jurassic – Cretaceous and it also filled with thick nonmarine succession of the Kongdian and Shahejie formations (~30–66 Ma) (Shinn, Chough & Hwang, Reference Shinn, Chough and Hwang2010; Yoon et al. Reference Yoon, Lee, Han, Yoo, Han, Choi and Lee2010). The North Yellow Sea Basin has the most conspicuous subsidence during ~30–50 Ma, corresponding to the Shahejie Formation (W. Y. Li et al. Reference Li, Bi, Selby, Chen, Vasconcelos, Thiede, Zhou, Zhao, Li and Qiu2012) (Fig. 5).
The FT results in this study indicate that the Jiaodong gold province has undergone two periods of rapid uplift during ~60–80 and ~30–50 Ma (Fig. 5). The Late Cretaceous uplift (~60–80 Ma) is almost synchronized with the basaltic magmatism in the eastern NCC (~60.1–92.5 Ma), and is in accordance with Late Cretaceous (68–83 Ma) faulting in the Jiaodong gold province (Fig. 2; Deng et al. Reference Deng, Liu, Wang and Pan2015 b). The Early Cenozoic uplift (~30–50 Ma) is nearly consistent with the remarkable basaltic magmatism in the eastern NCC (~23.3–58.4 Ma) and the rapid settlement in the ambient rift basins (~30–66 Ma) (Fig. 5). The thermal modelling presented in this study also shows a similar trend and exhibits a period of quick cooling during ~30–80 Ma. In addition, there is a stage of rapid cooling at ~20 Ma (Fig. 6).
Previous low-temperature thermochronology studies also suggest analogous cooling periods in the orogenic belt next to extensional basins (Fig. 1; Hu et al. Reference Hu, Hao, Fu, Wu and Wang2005; Liu et al. Reference Liu, Weber, Glasmacher, Xu and Wanger2009; Wu et al. Reference Wu, Monie, Wang, Lin, Ji, Bonno, Munch and Wang2016). In the Sulu belt situated between the Bohai Bay Basin and South Yellow Sea Basin, there are two peaks of ~40 and ~65 Ma for apatite U–Th/He and FT dating (Hu et al. Reference Hu, Hao, Fu, Wu and Wang2005; Wu et al. Reference Wu, Monie, Wang, Lin, Ji, Bonno, Munch and Wang2016). In the central NCC, west of the Bohai Bay Basin, the apatite FT ages show a wide range of ~30–70 Ma (Liu et al. Reference Liu, Weber, Glasmacher, Xu and Wanger2009). In the Qinling–Dabie orogenic belt, southwest of the Hefei Basin, there are two peaks of ~45 and ~60 Ma for apatite U–Th/He and FT dating (Hu et al. Reference Hu, Hao, Fu, Wu and Wang2005) (Fig. 1). In summary, the apatite U–Th/He and FT dating in the eastern NCC collectively reveals two peaks (Late Cretaceous and Paleogene), which are synchronized with the development of surrounding basins (Fig. 5). During the Late Cretaceous – Early Cenozoic, there is obvious mountain-basin – magmatism coupling in the eastern NCC.
5.b. Geodynamic control
There are two possible tectonic drives for the Jiaodong gold province uplift and nearby basin development in the Late Cretaceous – Cenozoic: the subduction of the Pacific plate underneath the NCC (Northrup, Royden & Burchfiel, Reference Northrup, Royden and Burchfiel1995; Zhu et al. Reference Zhu, Jiang, Zhang and Chen2012 a; Deng et al. Reference Deng, Liu, Wang and Pan2015 a,b), and the far-field effects of collision between the India plate and Eurasian plate commencing at ~55 Ma (White & Lister, Reference White and Lister2012; Iaffaldano, Bodin & Sambridge, Reference Iaffaldano, Bodin and Sambridge2013). The direction of regional maximum extension in the eastern NCC rotated clockwise from WNW–ESE in the earliest–middle Early Cretaceous to NW–SE in the latest Early Cretaceous, then N–S in the Late Cretaceous – Paleogene (Zhu et al. Reference Zhu, Jiang, Zhang and Chen2012 a). Motion of the Pacific plate changed to northward during 30–90 Ma (Sager, Reference Sager2006; Beaman et al. Reference Beaman, Sager, Acton, Lanci and Pares2007). It was shown that the principal extension directions were synchronized with the subduction direction of the Pacific plate (Zhu et al. Reference Zhu, Jiang, Zhang and Chen2012 a). The ~20 Ma rapid uplift in Jiaodong is consistent with the opening of the back-arc Japan Sea (15–21 Ma) (Yamamoto & Hoang, Reference Yamamoto and Hoang2009). The spreading direction of the Japan Sea is roundly N–S to NNE–SSW, consistent with the Miocene stretching direction in the eastern NCC (Zhang et al. Reference Zhang, Sun, Zhou, Zhou, Fan and Zheng2003 b). The temporal and directional coincidence imply the genetic relationship between the Miocene extension in the eastern NCC and the opening of the Japan Sea. We prefer to interpret the rapid crust denudation at 30–80 and ~20 Ma as a result of back-arc extension associated with the Pacific plate subduction (Northrup, Royden & Burchfiel, Reference Northrup, Royden and Burchfiel1995; Zhu et al. Reference Zhu, Jiang, Zhang and Chen2012 a; Deng et al. Reference Deng, Wang, Bagas, Carranza and Lu2015 b).
Our FT data verify the synchronicity between the uplift in the Jiaodong gold province and the subsidence in neighbouring basins during the Cretaceous–Paleogene (Figs 5, 6). The metamorphic core complexes in the Jiaodong gold province and the surrounding extensional sedimentary basins are considered to have resulted from large-scale rifting during the Late Jurassic – Early Cretaceous (S. Z. Li et al. Reference Li, Bi, Selby, Chen, Vasconcelos, Thiede, Zhou, Zhao, Li and Qiu2012 a; Zhu et al. Reference Zhu, Jiang, Zhang and Chen2012 a). They belong to the same horst–graben system in the eastern NCC, and share a similar tectonic setting. It was further inferred that, as a result of continuing lithosphere thinning, the pattern of the horst–graben system in the eastern NCC and its vicinity initiated in the Late Cretaceous and took shape in the earliest Paleogene.
5.c. Constraints on the depth of mineralization
The FT data suggest that the Jiaodong gold province experienced extensive crust exhumation after the Early Cretaceous. The high consistency of time–temperature evolution of granitic samples from different locations implies a holistic uplift in the gold province (Fig. 6). The present-day geothermal gradient in Jiaodong is ~30°Ckm−1 (heat flow: ~64 mWm−2; Lv, Reference Lv2006; He, Reference He2015). In terms of vitrinite reflectance and apatite FT data, the paleogeothermal gradient in Bohai Bay Basin was estimated to be 42–56°Ckm−1 during the Early Paleogene (He, Reference He2015). The gradient and heat flow in the craton are lower than those in the rift basin. Assuming a gradient in craton ranging from 30°Ckm−1 to 40°Ckm−1 and an arbitrary surface temperature of 20°C, the 110°C isotherm (apatite closure temperature; Green & Duddy, Reference Green and Duddy1989) would be at depths between 2 and 3 km, and the 250°C isotherm (zircon closure temperature; Yamada et al. Reference Yamada, Tagami, Nishimura and Ito1995) would be between 6 and 8 km. This implies that a 6–8 km thick crustal section has been removed by erosion since the Late Cretaceous. Considering the continuation of gold mineralization in Jiaodong has been approved at a depth of <3 km (Wen et al. Reference Wen, Fan, Hu, Liu, Yang, Sun and Sun2016), we propose that the formation depth of gold deposits was c. 6–11 km.
6. Conclusions
The FT data revealed the Late Cretaceous – Paleogene crustal denudation in the Jiaodong gold province driven by subduction of the Pacific plate. The eastern NCC, including the Jiaodong Peninsula, has experienced two stages of lithosphere thinning, in the Late Cretaceous (~60–80 Ma) and Paleogene (~30–50 Ma). The pattern of the horst–graben system in the eastern NCC and its vicinity initiated in the Late Cretaceous and took shape in the earliest Paleogene. The mineralization depth in the Jiaodong gold province is suggested to be c. 6–11 km.
Acknowledgement
This research was financially supported by the National Natural Science Foundation of China (Nos. 41230311, 41172295, 40872068).
Declaration of interest
The authors declare no conflict of interest related to this article.


