1. Introduction
The Norwegian margin contains several major oil and gas fields and is therefore of great interest for hydrocarbon exploration. Sedimentary rocks on the Norwegian margin were deposited during multiple rift events through the late Palaeozoic to the Paleogene, before the opening of the northern Atlantic Ocean in the Paleogene (e.g. Brekke et al. Reference Brekke, Dahlgren, Nyland, Magnus, Fleet and Boldy1999). Understanding these rift events, and especially their sediment fill, in space and time is crucial for hydrocarbon exploration. Five different sand types (termed MN1, MN2, MN3, MN4 and MN5) have been distinguished in the Jurassic–Paleocene strata of the Norwegian margin and East Greenland on the basis of variations in specific conventional heavy mineral ratios, mineral geochemistry and detrital zircon ages (Morton, Whitham & Fanning, Reference Morton, Whitham and Fanning2005; Morton et al. Reference Morton, Hallsworth, Strogen, Whitham and Fanning2009). Heavy mineral ratios that best reflect provenance characteristics are apatite:tourmaline, garnet:zircon, rutile:zircon, monazite:zircon and chrome spinel:zircon, which are expressed as index values ATi, GZi, RuZi, MZi and CZi respectively (Morton & Hallsworth, Reference Morton and Hallsworth1994). The MN4 sand type, which has been identified in parts of the Jurassic succession, has especially distinctive features, with high rutile:zircon indices (RuZi > 60), high monazite:zircon indices (MZi > 8) and high abundances of high-Mg, low-Ca garnet (Morton et al. Reference Morton, Hallsworth, Strogen, Whitham and Fanning2009). MN4 sandstones are also characterized by high abundances of granulite-facies rutile, which, in conjunction with the other heavy mineral characteristics, suggests derivation from granulite-facies metasedimentary rocks (Morton & Chenery, Reference Morton and Chenery2009). Detrital zircons have Archaean, early Palaeoproterozoic, Mesoproterozoic and early Palaeozoic ages (Morton et al. Reference Morton, Hallsworth, Strogen, Whitham and Fanning2009). Based on the available data, the source for the MN4 sand type is suggested to lie in central East Greenland (Morton & Chenery, Reference Morton and Chenery2009; Morton et al. Reference Morton, Hallsworth, Strogen, Whitham and Fanning2009).
Rutile is similar to zircon in that it is chemically and physically stable, and is therefore not prone to destruction during the sedimentary cycle. Consequently, it can provide important information about source area lithologies even in sandstones that have undergone severe modification during both surficial weathering and burial diagenesis. Since the studies of Zack, Moraes & Kronz (Reference Zack, Moraes and Kronz2004) and Zack, von Eynatten & Kronz (Reference Zack, von Eynatten and Kronz2004), rutile has received much attention regarding its application in sedimentary provenance analysis, as outlined by Meinhold (Reference Meinhold2010).
In the present study, we analysed detrital rutiles from two Jurassic sandstone samples with MN4 characteristics (Fig. 1) to obtain further constraints on their provenance. Trace-element geochemistry was used to distinguish rutile derived from metamafic and metapelitic rocks. Zr-in-rutile geothermometry was applied to calculate formation crystallization temperatures (Watson, Wark & Thomas, Reference Watson, Wark and Thomas2006). Finally, the main focus was given to U–Pb rutile geochronology in order to constrain the time of formation of the high-temperature rutile grains. This study is the first to present detrital rutile U–Pb ages from Mesozoic sediments on the Norwegian margin.
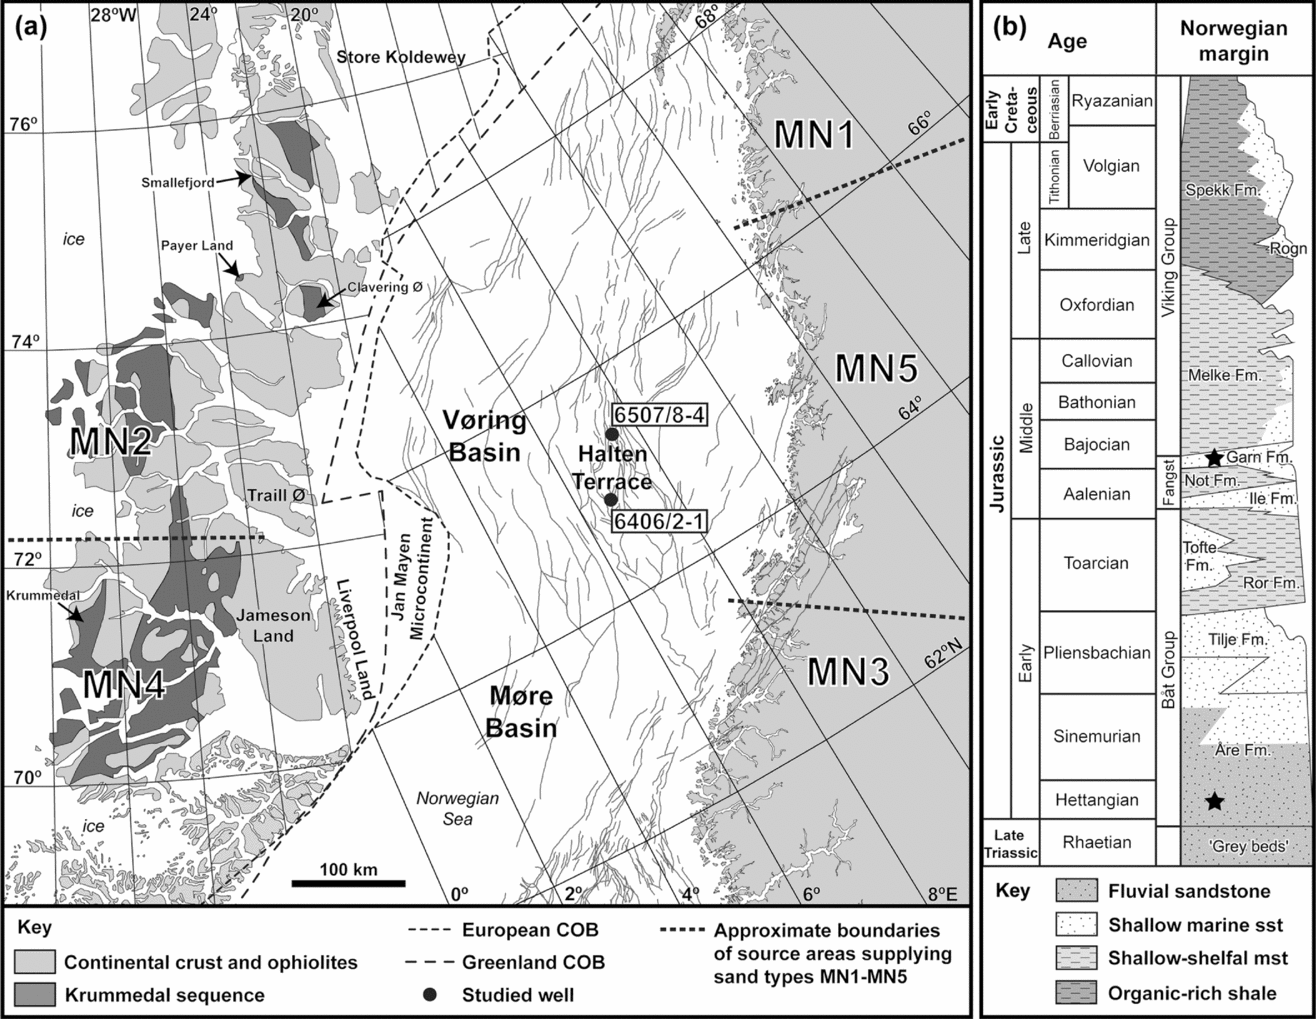
Figure 1. (a) Best-fit reconstruction of the Norwegian margin prior to final opening of the northeast Atlantic (magnetic anomaly 24), adapted from Scott (Reference Scott2000), showing the location of the two wells discussed in this paper. Data source for distribution of the Krummedal sequence in East Greenland is Thrane (Reference Thrane2002). Note that the Payer Land paragneisses and the Smallefjord metasedimentary sequence may be an equivalent of the Krummedal sequence (e.g. Strachan, Nutman & Friderichsen, Reference Strachan, Nutman and Friderichsen1995; Gilotti & Elvevold, Reference Gilotti and Elvevold2002). Metamorphic facies distribution for the East Greenland Caledonides is discussed in Gilotti, Jones & Elvevold (Reference Gilotti, Jones, Elvevold, Higgins, Gilotti and Smith2008). The inferred source areas for sand types MN1 to MN5 are according to Morton, Whitham & Fanning (Reference Morton, Whitham and Fanning2005), Morton & Chenery (Reference Morton and Chenery2009), Morton et al. (Reference Morton, Hallsworth, Strogen, Whitham and Fanning2009) and results of this study. Note that this map does not take Jurassic and Cretaceous extension on the Norwegian margin into account. COB – continent–ocean boundary. (b) Jurassic stratigraphy of the Halten Terrace on the Norwegian margin (after Dalland, Worsley & Ofstad Reference Dalland, Worsley and Ofstad1988). The black stars indicate the stratigraphic location of the samples.
2. Sample description
The two samples used in this study come from the Jurassic succession on the Halten Terrace (Fig. 1), which comprises the main hydrocarbon reservoir in this part of the Norwegian margin (e.g. Martinius et al. Reference Martinius, Ringrose, Brostrøm, Elfenbein, Næss and Ringås2005).
Sample 1 is a fine–medium-grained sandstone from the Åre Formation (Hettangian) at 2258.95 m depth in well 6507/8–4 (Fig. 1). The Åre Formation was deposited in a fluvial to deltaic environment (Dalland, Worsley & Ofstad, Reference Dalland, Worsley and Ofstad1988). The provenance-sensitive heavy mineral ratios of this sample are ATi ~ 0, GZi ~ 88, RuZi ~ 75, MZi ~ 13, and CZi ~ 1, and the garnet population is dominated by high-Mg, low-Ca types (Morton et al. Reference Morton, Hallsworth, Strogen, Whitham and Fanning2009). The detrital zircon age spectrum in a different Åre Formation sample from 6507/8–4 has major clusters in the early Palaeozoic (500 to 350 Ma), Neoproterozoic to late Palaeoproterozoic and Archaean (Morton et al. Reference Morton, Hallsworth, Strogen, Whitham and Fanning2009).
Sample 2 is a medium-grained sandstone from the Garn Formation (Bajocian–Bathonian) at 4429.85 m depth in well 6406/2–1 (Fig. 1). The Garn Formation was deposited in fluvial, delta top and shallow marine environments (Dalland, Worsley & Ofstad, Reference Dalland, Worsley and Ofstad1988). The provenance-sensitive heavy mineral ratios of this sample are ATi ~ 37, GZi ~ 94, RuZi ~ 59, MZi ~ 9, and CZi ~ 2 and the garnet population is dominated by high-Mg, low-Ca types. The detrital zircon age spectrum in a Garn Formation sample from 6507/8–1 has major clusters in the early Palaeozoic (500 to 400 Ma), early Mesoproterozoic to late Palaeoproterozoic and Archaean (Morton et al. Reference Morton, Hallsworth, Strogen, Whitham and Fanning2009).
3. Analytical methods
3.a. Sample preparation
Samples were gently disaggregated by use of a pestle and mortar, immersed in water and by using an ultrasonic probe so that any clay adhering to grain surfaces was dispersed and removed. The samples were then washed through a 63 μm sieve and re-subjected to ultrasonic treatment until no more clay passed into suspension, followed by wet sieving through the 125 and 63 μm sieves. The resulting > 125 μm and 63–125 μm fractions were dried in an oven at 80 °C. The 63–125 μm fraction was placed in bromoform with a measured specific gravity of 2.8. Heavy minerals were allowed to separate under gravity, with frequent stirring to ensure complete separation. Rutile was separated from the heavy mineral concentrate by hand picking under a binocular microscope, mounted in epoxy resin on a glass slide, sectioned and polished.
3.b. Rutile geochemistry
Rutile grains were analysed for Ti, Zr, Nb, Cr, Fe and Si with an electron microprobe (EMP) Cameca SX100 at the Department of Earth Sciences, University of Cambridge, UK. Natural and synthetic standards were used. Operating conditions were 40 kV acceleration voltage with a beam current of 100 nA and a beam diameter of 5 μm. The exception was Ti, which was analysed with a beam current of 40 nA. The counting times for the various elements were 50 s (Ti, Si), 100 s (Fe, V), 150 s (Al), 200 s (Zr, Cr) and 300 s (Nb). The detection limits for the various elements were 650 ppm (Ti), 75 ppm (Zr), 70 ppm (Nb), 65 ppm (Cr), 85 ppm (Fe) and 45 ppm (Si). Areas devoid of cracks or inclusions were chosen for spot analyses.
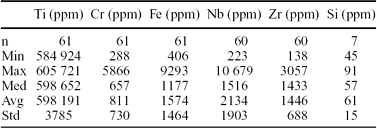
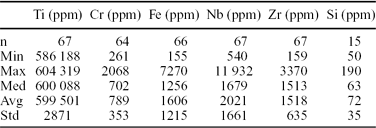
The rutile grains were geochemically discriminated into those derived from metamafic and metapelitic rocks (see review by Meinhold, Reference Meinhold2010), based on their Cr and Nb concentrations (Fig. 2). The formation temperature of each rutile grain was calculated by applying Zr-in-rutile geothermometry (Fig. 3), based on the fact that incorporation of Zr into rutile coexisting with zircon or other Zr-rich phases has a strong dependence on temperature (Zack, Moraes & Kronz, Reference Zack, Moraes and Kronz2004; Watson, Wark & Thomas, Reference Watson, Wark and Thomas2006). Tomkins, Powell & Ellis (Reference Tomkins, Powell and Ellis2007) have clearly demonstrated that pressure also has an effect on the uptake of Zr in rutile. However, their geothermometer is applicable only if the pressure during rutile crystallization is known, which is generally not the case for detrital rutile. Therefore, we follow Meinhold (Reference Meinhold2010) and use here the Zr-in-rutile geothermometer of Watson, Wark & Thomas (Reference Watson, Wark and Thomas2006), which is based on experimental data and constrained by natural rutiles from metamorphic rocks. Summarized EMP data are given in Tables 1 and 2. Full sets of EMP data referred to in this paper are given in online Appendix Tables A1 and A2 at http://www.cambridge.org/journals/geo.

Figure 2. Cr–Nb plots and relative abundance of metamafic and metapelitic rutiles (pie charts) showing rutile provenance in the two MN4 sandstone samples discussed in this paper. Discrimination of metamafic and metapelitic rutile follows Meinhold et al. (Reference Meinhold, Anders, Kostopoulos and Reischmann2008). n = number of rutile grains analysed. Note that in the pie charts pale grey and dark grey colours represent metapelitic and metamafic grains, respectively.

Figure 3. Frequency histograms (bin width = 50 °C) showing rutile formation temperatures for the two MN4 sandstone samples, calculated using the Zr-in-rutile geothermometer of Watson, Wark & Thomas (Reference Watson, Wark and Thomas2006). Note that the Zr content of one metamafic grain from the Garn Formation is below the detection limit of the EMP, and thus this grain is not included here. Pale grey and dark grey colours represent metapelitic and metamafic grains, respectively.
Table 1. Summary of EMP results for detrital rutile from the Garn Formation (6406/2–1, 4429.85 m)

n – number of data; Min – minimum value; Max – maximum value; Med – median; Avg – average (arithmetic mean); Std – standard deviation (1σ).
Table 2. Summary of EMP results for detrital rutile from the Åre Formation (6507/8–4, 2258.95 m)

n – number of data; Min – minimum value; Max – maximum value; Med – median; Avg – average (arithmetic mean); Std – standard deviation (1σ).
3.c. Rutile geochronology
Zircon is the major accessory mineral that is refractory and so U–Pb dating of detrital grains is commonly used in sedimentary provenance analysis (e.g. Fedo, Sircombe & Rainbird, Reference Fedo, Sircombe, Rainbird, Hanchar and Hoskin2003). U–Pb ages can also be determined for rutile, but is not widely used owing to the low U concentration and relatively high common Pb. Detrital metamorphic rutile is also a candidate for U–Pb dating and several studies have shown that metamorphic rutile incorporates uranium in the crystal lattice (e.g. Mezger, Hanson & Bohlen, Reference Mezger, Hanson and Bohlen1989; Mezger et al. Reference Mezger, Rawnsley, Bohlen and Hanson1991; Möller, Mezger & Schenk, Reference Möller, Mezger and Schenk2000; Vry & Baker, Reference Vry and Baker2006). A few studies have already shown the successful application of U–Pb geochronology on detrital rutile, as outlined by Meinhold (Reference Meinhold2010). Most of these studies were performed by laser ablation inductively coupled plasma mass spectrometry (LA–ICP–MS) (e.g. Allen & Campbell, Reference Allen and Campbell2007; Birch et al. Reference Birch, Barron, Magee and Sutherland2007; Taylor, Reference Taylor2008). Applications using secondary ion mass spectrometry (SIMS) have been presented by Sircombe (Reference Sircombe1995, unpub. Ph.D. thesis, Austral. Nat. Univ. Canberra, 1997; as discussed in Williams, Reference Williams, McKibben, Shanks and Ridley1998 and Ireland & Williams, Reference Ireland, Williams, Hanchar and Hoskin2003) and Harrison et al. (Reference Harrison, Trail, Schmitt and Watson2007).
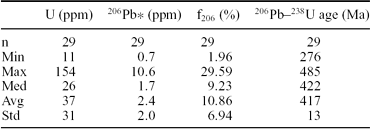
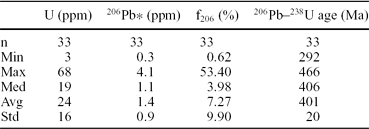
For this study, we used the sensitive high-resolution ion microprobe (SHRIMP RG) facility at the Research School of Earth Sciences, The Australian National University, Canberra, Australia. The analysis concentrated on those rutile grains with formation temperatures exceeding 750 °C in order to constrain the timing of granulite-facies metamorphism in the sediment source region. Each analysis consisted of six scans through the mass range, with a reference rutile MTP analysed for every four unknown rutile analyses. The SHRIMP analytical method is similar to that described in Williams (Reference Williams, McKibben, Shanks and Ridley1998, and references therein). The data have been reduced using the SQUID Excel Macro of Ludwig (Reference Ludwig2001). The U–Pb ratios have been normalized relative to a value of 0.0728 for the MTP reference rutile, equivalent to an age of 453 Ma (C. M. Fanning, unpub. TIMS data). Correction for common Pb for the U–Pb data has been made using the measured 238U–206Pb and 207Pb–206Pb ratios following Tera & Wasserburg (Reference Tera and Wasserburg1972) as outlined in Williams (Reference Williams, McKibben, Shanks and Ridley1998). Concordia diagrams and combined probability density distribution–histogram plots were produced using the Isoplot/Ex (Ludwig, Reference Ludwig2003) and AgeDisplay (Sircombe, Reference Sircombe2004) programs respectively. Ages reported in the text are given at the 1-sigma level. Summarized isotopic data are given in Tables 3 and 4. Full sets of isotopic data referred to in this paper are given in online Appendix Tables A3 and A4 at http://www.cambridge.org/journals/geo.
Table 3. Summary of SHRIMP U–Pb analytical data for detrital rutiles from the Garn Formation (6406/2–1, 4429.85 m)

f206 – percentage of 206Pb that is common Pb; n – number of data; Min – minimum value; Max – maximum value, Med – median; Avg – average (arithmetic mean); Std – standard deviation (1σ).
Table 4. Summary of SHRIMP U–Pb analytical data for detrital rutiles from the Åre Formation (6507/8–4, 2258.95 m)

f206 – percentage of 206Pb that is common Pb; n – number of data; Min – minimum value; Max – maximum value; Med – median; Avg – average (arithmetic mean); Std – standard deviation (1σ).
An important factor to be considered when interpreting rutile geochronology data is the closure or ‘blocking’ temperature for Pb diffusion in rutile, which is strongly dependent on grain size (Mezger et al. Reference Mezger, Rawnsley, Bohlen and Hanson1991; Cherniak, Reference Cherniak2000). For example, Mezger, Hanson & Bohlen (Reference Mezger, Hanson and Bohlen1989) analysed Archaean and Proterozoic high-grade metamorphic rocks in North America and recognized that within a single hand specimen, larger rutile grains give older ages than do smaller ones. They explained this observation as being due to a direct relationship between volume diffusion and dimensions of the rutile crystal. The closure temperature is around 600 °C for rutile grains larger than about 0.2 mm in diameter (Cherniak, Reference Cherniak2000; Vry & Baker, Reference Vry and Baker2006). Although this is much higher than previously thought (370–500 °C: Mezger, Hanson & Bohlen, Reference Mezger, Hanson and Bohlen1989), it is about 300 °C less than for zircon.
4. Results
4.a. Rutile geochemistry
In total, 128 detrital rutiles from the two MN4 sand samples were analysed by EMP, 67 from sample 1 (Åre Formation) and 61 from sample 2 (Garn Formation). In both samples, the rutiles vary in colour from yellowish to reddish-brown.
In the Garn Formation sample, Cr and Nb concentrations range from 288 to 5866 ppm and 406 to 9293 ppm, respectively (Fig. 2). One rutile grain has a Nb value below the detection limit of the EMP. According to the Cr–Nb discrimination diagram of Meinhold et al. (Reference Meinhold, Anders, Kostopoulos and Reischmann2008), about 11 % of the rutiles were derived from metamafic and 89 % from metapelitic rocks. Zr concentrations in the metapelitic rutiles range from 295 to 2967 ppm. Zr-in-rutile geothermometry using the equation of Watson, Wark & Thomas (Reference Watson, Wark and Thomas2006) reveals rutile formation temperatures ranging from 641 to 877 °C (Fig. 3), with a mean value of 784 °C. About 83 % of the metapelitic rutile grains of the Garn Formation sample were formed above 750 °C.
In the Åre Formation sample, Cr and Nb concentrations range from 261 to 2068 ppm and 540 to 11932 ppm, respectively (Fig. 2). Three rutile grains have Cr concentrations below the detection limit of the EMP. According to the Cr–Nb discrimination diagram of Meinhold et al. (Reference Meinhold, Anders, Kostopoulos and Reischmann2008), about 15 % of the rutiles were derived from metamafic and 85 % from metapelitic rocks. Zr concentrations in the metapelitic rutiles range from 159 to 3370 ppm. Zr-in-rutile geothermometry using the equation of Watson, Wark & Thomas (Reference Watson, Wark and Thomas2006) reveals rutile formation temperatures ranging from 594 to 893 °C, with a mean value of 789 °C. About 84 % of the metapelitic rutile grains of the Åre Formation sample were formed above 750 °C.
4.b. Rutile geochronology
In total, 62 rutile grains from the two MN4 sand samples were used for U–Pb SHRIMP analysis. This includes 60 grains of the identified high-temperature (T > 750 °C) rutile population (55 metapelitic and 5 metamafic rutiles) and two rutile grains with T < 750 °C. The latter comprises a metamafic rutile (grain no. 116) from the Åre Formation sample (T ~ 673 °C) and a metapelitic rutile (grain no. 29) from the Garn Formation sample (T ~ 694 °C).
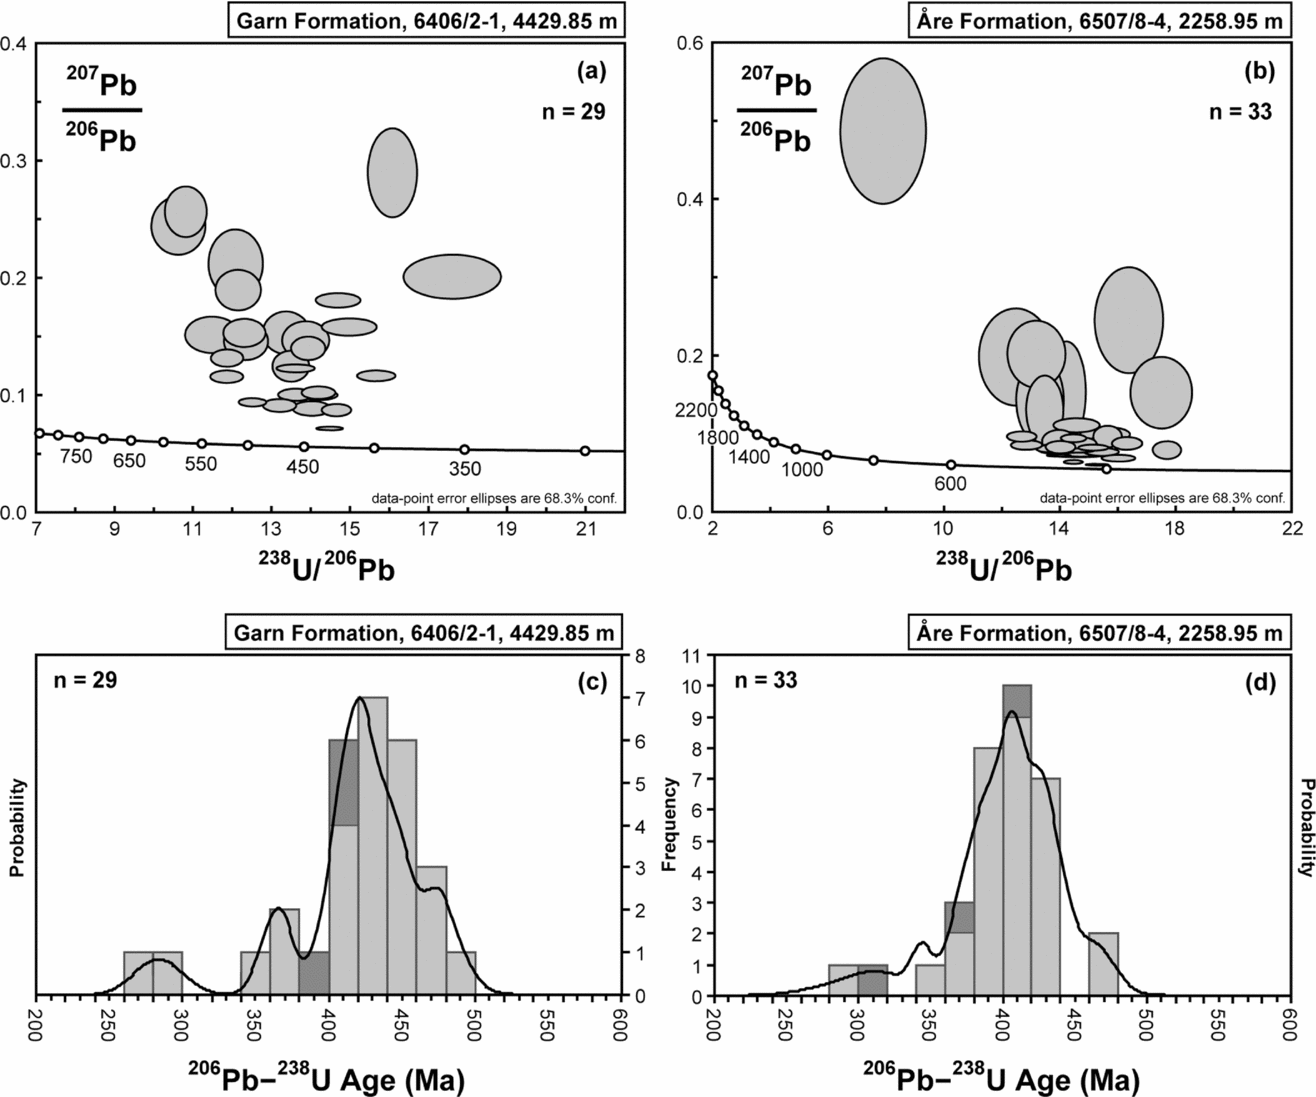
The 29 rutiles from the Garn Formation sample analysed by SHRIMP show U contents ranging from 11 to 154 ppm (Fig. 4). The 206Pb–238U ages range from ~ 485 to 275 Ma (Fig. 5), with the main cluster between 480 and 400 Ma. Rutiles from the Åre Formation sample show similar results. The 33 analysed grains have U contents of 3 to 68 ppm (Fig. 4) and the 206Pb–238U ages range from ~ 465 to 290 Ma (Fig. 5), with the main cluster between 440 and 380 Ma. Combining both samples gives a main rutile population between 450 and 380 Ma. Note that the 206Pb–238U ages do not show any relationship with the type of rutile, although the few analysed metamafic rutiles have ages less than 415 Ma. The analysed rutiles have relatively high common Pb. About 7 % of the measured 206Pb in the Garn Formation sample and 11 % in the Åre Formation sample is common Pb; a few higher values were also observed (see online Appendix Tables A3 and A4 at http://www.cambridge.org/journals/geo).

Figure 4. Frequency histograms (bin width = 10 ppm) showing uranium contents of the rutile grains from the MN4 sandstone samples used for U–Pb rutile geochronology. Pale grey and dark grey colours represent metapelitic and metamafic grains, respectively.

Figure 5. (a, b) Tera-Wasserburg and (c, d) probability density distribution and frequency histogram plots (bin width = 20 Ma) for the set of U–Pb analytical rutile data from the MN4 sandstone samples of the Norwegian margin. Pale grey and dark grey colours represent metapelitic and metamafic grains, respectively. n = number of rutile grains analysed.
5. Discussion and conclusions
The rutile geochemical data of this study fit well with those of a previous study by Morton & Chenery (Reference Morton and Chenery2009), which was undertaken on the same samples by LA–ICP–MS. EMP analysis indicates that 85–89 % of the rutiles were derived from metapelitic rocks, compared with 76–89 % determined by LA–ICP–MS. EMP data indicate that 83–84 % of the rutiles were formed under high-grade metamorphism (temperatures exceeding 750 °C), compared with 84–89 % as determined by LA–ICP–MS. The data suggest derivation from a felsic metasedimentary source that experienced granulite-facies metamorphism. Because rutile is mainly formed in metamorphic rocks, U–Pb rutile geochronology can yield the age of metamorphism. The analysed rutiles have 206Pb–238U ages ranging from ~ 485 to 290 Ma, with a major cluster between 450 and 380 Ma. Together with the rutile geochemical data and provenance data from previous studies (Morton & Chenery, Reference Morton and Chenery2009; Morton et al. Reference Morton, Hallsworth, Strogen, Whitham and Fanning2009), it is suggested that the detrital rutiles were predominantly derived from metasedimentary rocks that experienced granulite-facies metamorphism at about 450–380 Ma. However, the large spread of the 206Pb–238U ages does not necessarily mean that granulite-facies metamorphism persisted over 70 Ma. The age range may simply reflect the cooling history of each individual rutile grain. Larger rutile grains give older ages than do smaller ones (e.g. Mezger et al. Reference Mezger, Rawnsley, Bohlen and Hanson1991; Cherniak, Reference Cherniak2000).
Regardless of the large spread of the 206Pb–238U ages, the rutiles formed during the Caledonian Orogeny, which records the destruction of the Iapetus Ocean mainly from Ordovician to Early Devonian times, the final closure of this ocean being associated with continental collision of Laurentia, Baltica and Avalonia (e.g. McKerrow, Mac Niocaill & Dewey, Reference McKerrow, Mac Niocaill and Dewey2000, and references therein). Potential source rocks for the MN4 sandstones are found in the Krummedal supracrustal sequence of central East Greenland (Fig. 1a). Here, sedimentary rocks have undergone first high-grade metamorphism and anatectic melting about 930 Ma ago and later experienced Caledonian high-temperature metamorphism at 450–400 Ma (Kalsbeek et al. Reference Kalsbeek, Thrane, Nutman and Jepsen2000). Another source may have been Payer Land paragneisses of central East Greenland, which record granulite-facies metamorphism at 410–370 Ma (Gilotti & Elvevold, Reference Gilotti and Elvevold2002; McClelland & Gilotti, Reference McClelland and Gilotti2003; Gilotti, Jones & Elvevold, Reference Gilotti, Jones, Elvevold, Higgins, Gilotti and Smith2008). Together with the Smallefjord sequence, they may be an equivalent of the Krummedal sequence (e.g. Strachan, Nutman & Friderichsen, Reference Strachan, Nutman and Friderichsen1995; Gilotti & Elvevold, Reference Gilotti and Elvevold2002). Granulite-facies rocks of Clavering Ø (e.g. Gilotti, Jones & Elvevold, Reference Gilotti, Jones, Elvevold, Higgins, Gilotti and Smith2008) may also be a potential sediment source. Therefore, it is suggested that metasedimentary rocks of the Krummedal sequence and its equivalent rocks may have supplied prominent amounts of detritus for the Jurassic MN4 sandstones. Besides a primary input of granulite-facies detritus, there is also the possibility of sediment recycling from post-Caledonian (Devonian–Triassic) strata, which were likely derived from high-grade metamorphic rocks of the East Greenland Caledonides. However, sediment provenance data are still lacking from the Devonian–Triassic strata, and thus future work is necessary to test the recycling hypothesis. Note that the present-day distribution of basement exposure in East Greenland is a young (Cenozoic) feature and thus does not reflect the distribution of basement exposure during Jurassic time.
Although granulite-facies metasediments are found locally within the Caledonian Nappe Domain of Norway and Sweden, derivation of sandstones with MN4 characteristics from the Scandinavian margin can be ruled out on the basis of contrasts in detrital garnet compositions and zircon age data (Morton et al. Reference Morton, Hallsworth, Strogen, Whitham and Fanning2009).
In conclusion, the present study shows that U–Pb dating of detrital rutile is a potentially important tool in sedimentary provenance analysis, since it enables determination of the age of high-grade metamorphism and facilitates the tracing of ancient orogenic events in the detrital record.
Acknowledgements
Sponsors of the CASP Norwegian Sea Provenance Project (BP, Chevron, ConocoPhillips, Dong, ENI, ExxonMobil, Shell, StatoilHydro and Total) are gratefully thanked for their support and permission to use the samples discussed in this paper. Chiara Petrone is thanked for her help with EMP analyses. Reviews by two anonymous referees and editorial handling by Mark Allen are appreciated.


