1. Introduction
Flood basalt sequences are found on volcanic rifted margins where the positions of mantle melting anomalies are coincident with the rifted margin (such as the North Atlantic Igneous Province, Paranã-Etendeka: e.g. Jerram & Widdowson, Reference Jerram and Widdowson2005). They are significant, as the provinces contain enormous volumes of lava; for instance, the North Atlantic Igneous Province (NAIP), is estimated to have a volume of 1.8 × 10⁶ km3 covering an area of 1.3 × 10⁶ km2 (Eldholm & Grue, Reference Eldholm and Grue1994), with a significant amount of the lava sequences being found offshore. Additionally, the flood basalts may cover pre-existing sedimentary basins, and in many cases these basins have proven hydrocarbon reserves in areas not covered by basalt where conventional geophysical exploration methods can be used (e.g. Naylor et al. Reference Naylor, Bell, Jolley, Durnall, Fredsted, Fleet and Boldy1999). Interest shown in such basins has focused on volcanic passive margins, particularly the Faroe Islands, Rockall and Vøring areas and the distribution and characterization of sub-surface volcanic successions (e.g. Fliedner & White, Reference Fliedner and White2003; White et al. Reference White, Smallwood, Fliedner, Boslaugh, Maresh and Fruehn2003). An understanding of the internal facies relationships within the lavas will provide valuable information on how the provinces built up through time and may also help quantify the extent of hyaloclastites and sedimentary sequences beneath, which are notoriously difficult to image seismically due to their flood basalt cover (Jerram, Reference Jerram, Menzies, Klemperer, Ebinger and Baker2002; Spitzer et al. Reference Spitzer, White and iSIMM2005).
In order to understand better the 3D distribution of the significant lava sequences offshore, flood basalt facies schemes and 3D mapping have been developed from seismic studies (e.g. Planke, Alvestad & Skogseid, Reference Planke, Alvestad and Skogseid1999; Planke et al. Reference Planke, Symonds, Alvestad and Skogseid2000, Reference Planke, Rasmussen, Rey, Myklebust, Doré and Vining2005; Thomson, Reference Thomson2005) and detailed field studies of onshore successions of flood basalts and their associated sediments (e.g. Jerram, Mountney & Stollhofen, Reference Jerram, Mountney, Holzförster and Mountney1999; Mountney et al. Reference Mountney, Howell, Flint and Jerram1999; Jerram et al. Reference Jerram, Mountney, Mountney, Cameron, Bate and Clure1999; Jerram, Reference Jerram, Menzies, Klemperer, Ebinger and Baker2002; Single & Jerram, Reference Single and Jerram2004). Recent research interest has focused on being able to understand the 3D facies distribution of the lavas using their geophysical properties (Planke, Alvestad & Skogseid, Reference Planke, Alvestad and Skogseid1999; Nelson et al. Reference Nelson, Jerram, Single and Hobbs2009). To improve sub-basalt imaging, research has focused on studies using long offset data (Fliedner & White, Reference Fliedner and White2003), low frequencies (e.g. Ziolkowski et al. Reference Ziolkowski, Hanssen, Gatcliff, Jakubowicz, Dobson, Hampson, Li and Liu2003), the construction of complex 2D and 3D models (e.g. Martini et al. Reference Martini, Hobbs, Bean and Single2005), the application of additional imaging techniques such as magnetotelluric inversion (Hautot et al. Reference Hautot, Single, Watson, Harrop, Jerram, Tarits, Whaler and Dawes2007) and the development of multi-method schemes such as joint inversion of gravity, magnetotelluric and seismic data (e.g. Jegen-Kulcsar & Hobbs, Reference Jegen-Kulcsar and Hobbs2005).
In this contribution, we have used known onshore volcanic facies from flood basalt sequences to interpret the offshore flood basalt sequence in a case study from the Faroe–Shetland Basin (the GFA 99 seismic data-set). Firstly, we briefly introduce the onshore geology of the Faroe Islands Basalt Group with examples of the types of volcanic facies preserved. The interpretation of the offshore sequence is then presented concentrating on the key volcanic sequences. These sequences are constrained using a combination of seismic facies and gravity modelling. The final model highlights the facies distribution of the key volcanic horizons and sheds light upon their evolution through time, with a significant portion of the sequences represented by hyaloclastites erupted into a deep water body which must have been present during the onset of flood volcanism.
2. The geology of the Faroe Islands Basalt Group
The location of the Faroe Islands and the significant offshore distribution of the lava cover in the Faroe–Shetland Basin are given in Figure 1. The sub-volcanic plays here are considered to be prospective and worthy of exploration (e.g. Waagstein, Reference Waagstein, Morton and Parson1988; Laier, Jørgensen & Isaksen, Reference Laier, Jørgensen and Isaksen1997; Ziska & Andersen, Reference Ziska, Andersen, Ziska, Warming and Bloch2005), and hence have attracted seismic acquisition over the offshore parts of the lava cover, and drilling in the onshore lava sequence (e.g. Boldreel, Reference Boldreel, Chalmers and Waagstein2006).

Figure 1. (a) The pre-Palaeogene structural framework of the area of the GFA-99 seismic dataset. The postulated extent of the Faroe Islands Basalt Group in the Faroe–Shetland Basin is also shown (modified after Ellis et al. Reference Ellis, Bell, Jolley, O'Callaghan, Jolley and Bell2002). Location of the Amerada Hess Flare-10 line is also displayed across the GFA-99 area. (b) Distribution of the Faroe Islands Basalt Group on the Faroe Islands and the stratigraphy compiled from onshore data and the Lopra-1/1A (1981 & 1996) borehole drilled on the island of Suðuroy. The wells of Vesmanna-1 (1980) and Glyvursnes-1 (2003) are also located (after Ellis et al. Reference Ellis, Bell, Jolley, O'Callaghan, Jolley and Bell2002). (c) Schematic log and approximate thickness of the stratigraphy on the Faroe Islands, including the Lopra-1/1A information.
The igneous succession in the Faroe Islands was erupted during Palaeogene times prior to the opening of the NE Atlantic (e.g. Jolley, Reference Jolley2009 and references therein). The lavas are all geochemically tholeiitic, which suggests that their eruption was coincident with a high degree of partial melting of the mantle (Waagstein, Reference Waagstein, Morton and Parson1988). The group consists of seven formations (see Passey & Bell, Reference Passey and Bell2007), of which four formations are composed of significant thicknesses of volcanic rocks (Fig. 1): (1) Enni Formation, (2) Malinstindur Formation, (3) Beinisvørð Formation and (4) Lopra Formation.
The additional formations are related to relatively thin sedimentary and volcaniclastic interbeds (Passey & Bell, Reference Passey and Bell2007), which unusually occur high up in the lava sequence in the Faroe Islands (Fig. 1), whereas elsewhere, sedimentary interlayers are often restricted to the basal part of flood basalt sequences observed in many onshore examples (e.g. Jerram & Stollhofen, Reference Jerram and Stollhofen2002; Petry et al. Reference Petry, Jerram, de Almeida and Zerfass2007), where the active sedimentary environment gets invaded and overtaken by the volcanic system (Jerram et al. Reference Jerram, Mountney, Howell, Long and Stollhofen2000).
The gross thickness of the volcanic succession in the Faroe Islands is thought to be 6500–7000 m, of which 3000 m are observed above sea-level (Ellis et al. Reference Ellis, Bell, Jolley, O'Callaghan, Jolley and Bell2002; Passey & Bell, Reference Passey and Bell2007). The onshore distribution of the formations is shown in Figure 1b. The Faroe Islands Basalt Group is considered to have erupted between c. 60.56 and 57.5 Ma (Ellis et al. Reference Ellis, Bell, Jolley, O'Callaghan, Jolley and Bell2002), however, the dating is poorly constrained above the Beinisvørð Formation. The Beinisvørð Formation is overlain by the Prestfjall Formation (previously termed the coal-bearing sequence), which consists of coal-bearing sedimentary units and was originally dated at around 57.5 Ma (Ellis et al. Reference Ellis, Bell, Jolley, O'Callaghan, Jolley and Bell2002). The most recent review of the dates for the onset and cessation of the Faroe Islands lava field, however, places the Prestfjall Formation at about 55 Ma (see Jolley, Reference Jolley2009) with errors of ± 0.5 Ma, and suggests an onset of volcanism more likely around 57 Ma based on correlations across the NAIP.
2.a. The onshore succession
The onshore succession of the Faroe Islands Basalt Group is exposed throughout the archipelago (Fig. 2) and has been sampled to considerable depth through the Lopra 1/1A borehole. Based on the detailed borehole data through the Faroe Islands Basalt Group from the water-borne volcaniclastics observed deep in the Lopra-1/1A borehole to the Enni Formation observed onshore on Streymoy and Eysturoy, the two largest islands of the Faroe Islands chain, it is possible to construct a schematic facies section through the whole Faroes lava sequence (Fig. 3). This succession is highlighted below:

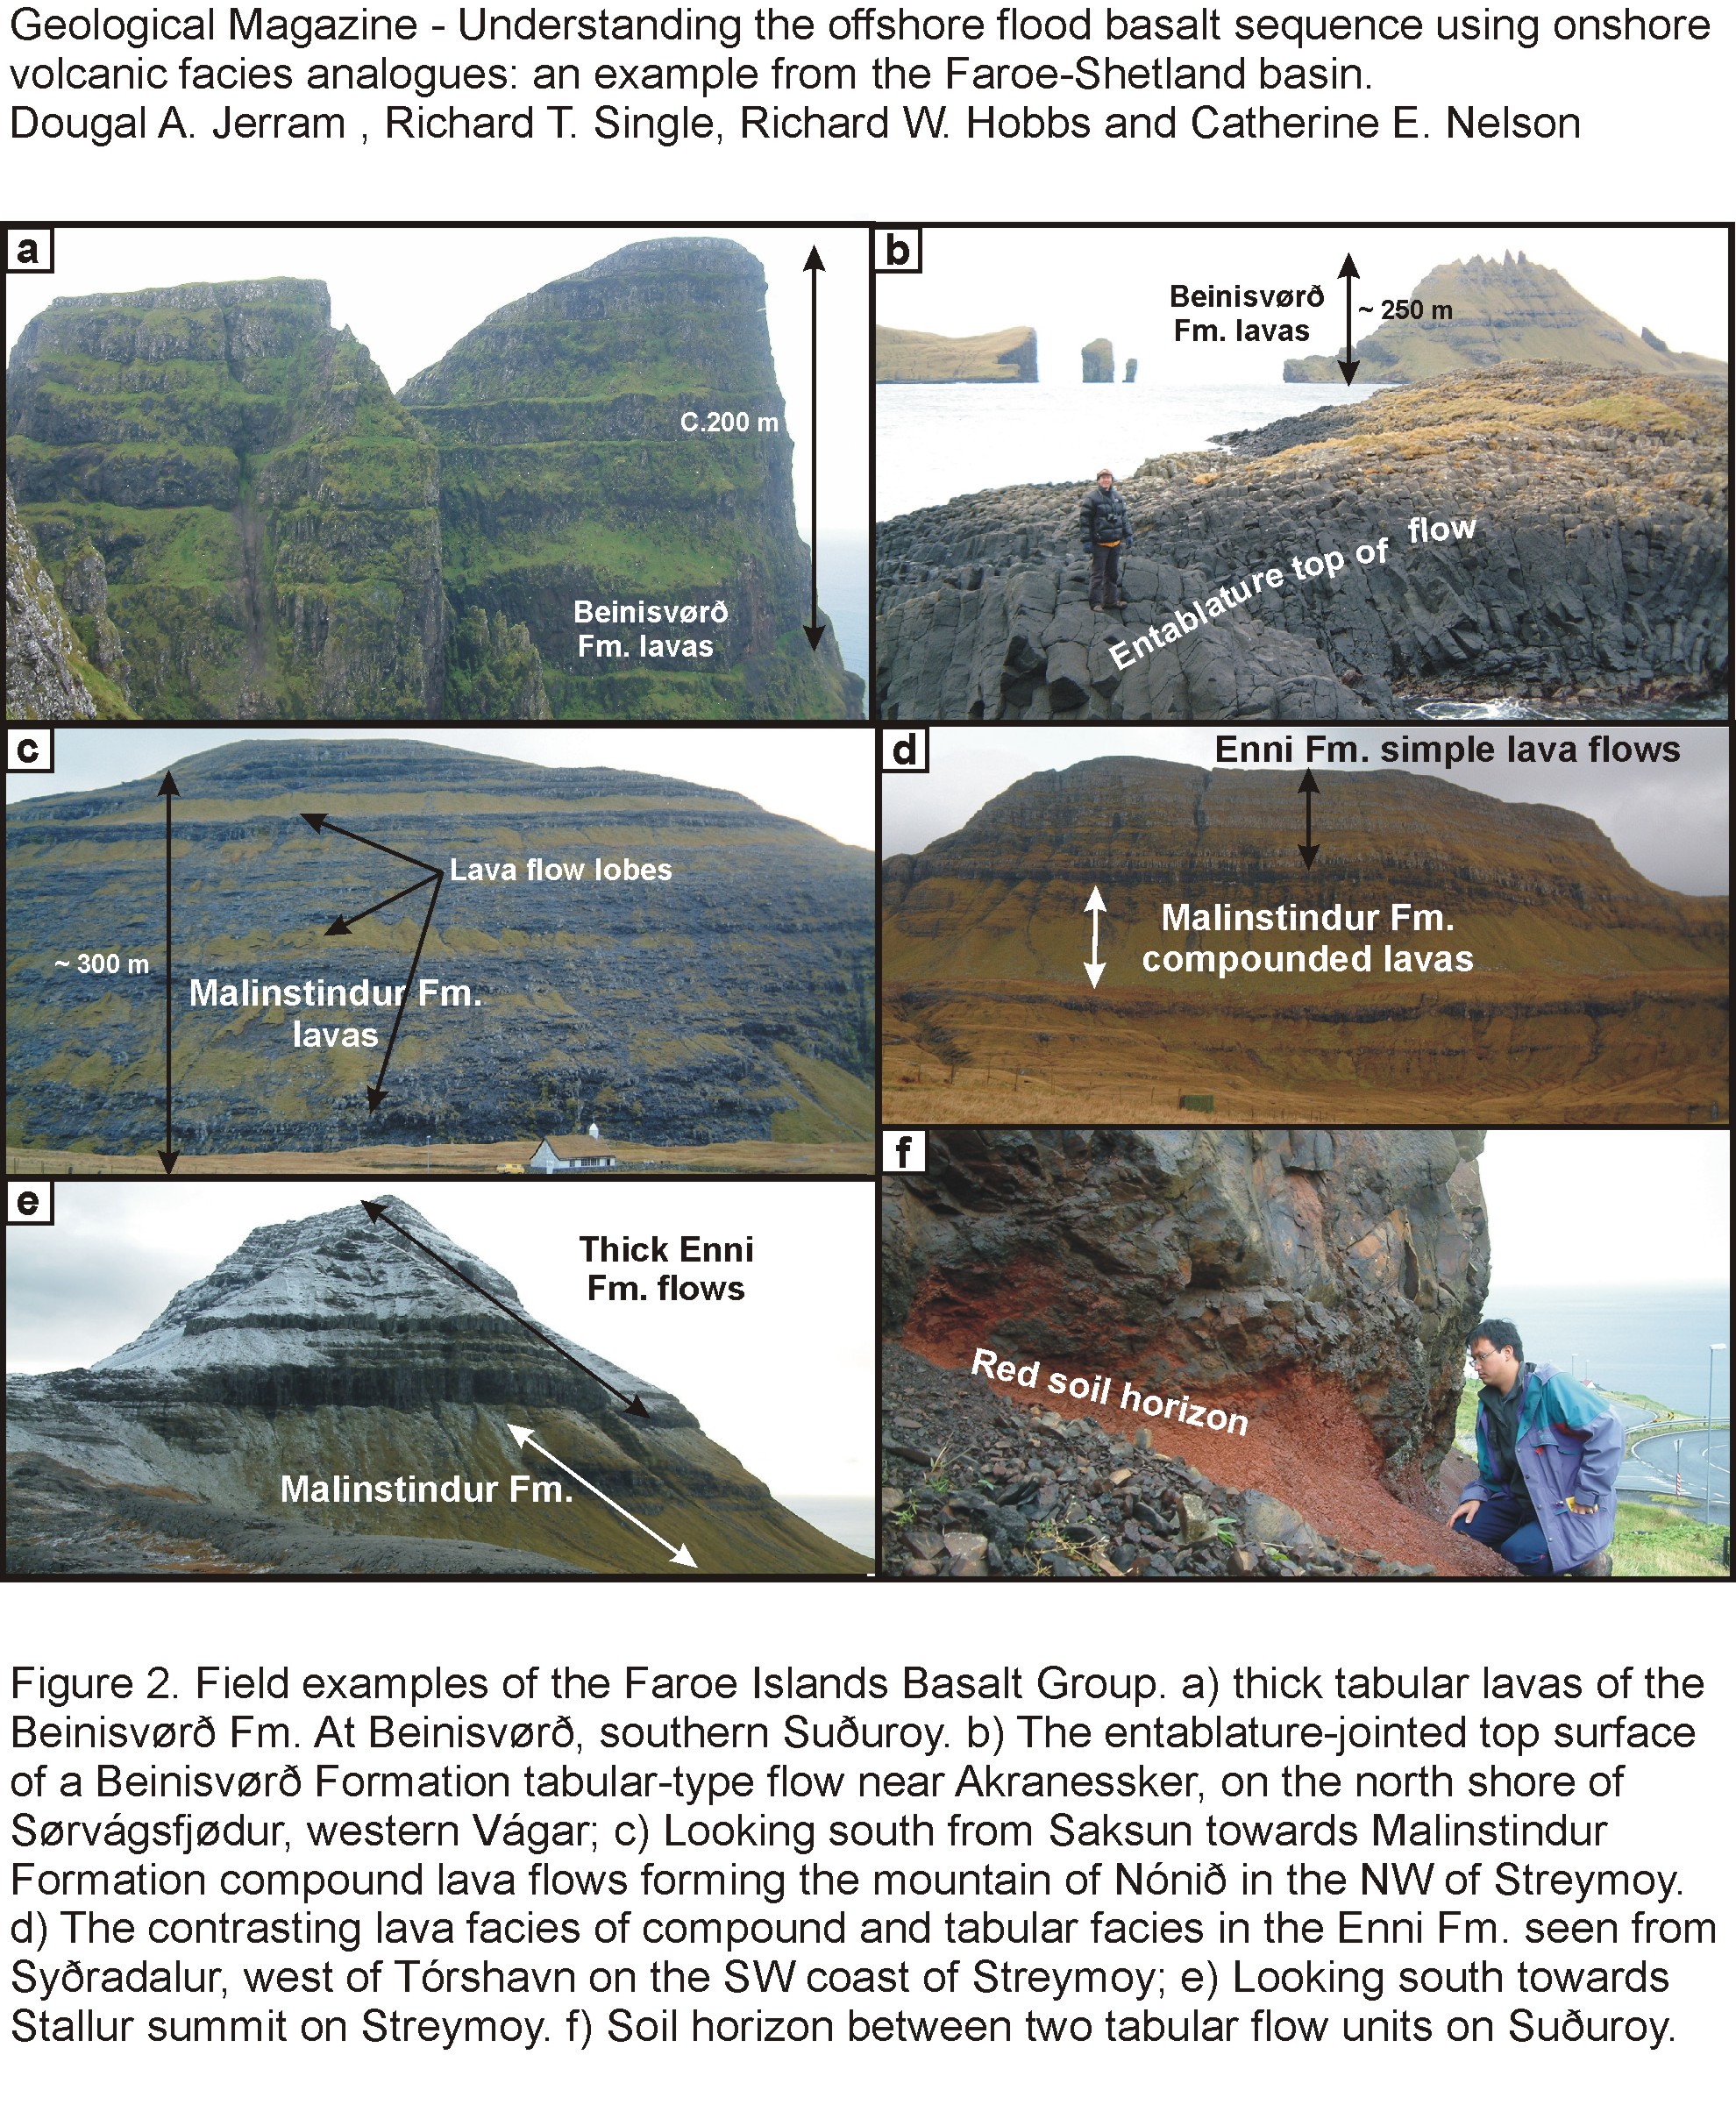
Figure 2. Field examples of the Faroe Islands Basalt Group. (a) Thick tabular lavas of the Beinisvørð Formation, at Beinisvørð, southern Suðuroy. (b) The entablature-jointed top surface of a Beinisvørð Formation tabular-type flow near Akranessker, on the north shore of Sørvágsfjødur, western Vágar. (c) Looking south from Saksun towards Malinstindur Formation compound lava flows forming the mountain of Nónið in the NW of Streymoy. (d) The contrasting lava facies of compound and tabular facies in the Enni Formation seen from Syðradalur, west of Tórshavn on the SW coast of Streymoy. (e) Looking south towards Stallur summit on Streymoy. (f) Soil horizon between two tabular flow units on Suðuroy. See http://journals.cambridge.org/geo for a colour version of this figure.

Figure 3. Schematic diagram of the facies in the onshore Faroe Islands succession constructed using existing studies (e.g. Passey & Bell, Reference Passey and Bell2007), as well as field observations by the authors, and information/interpretation from the Lopra-1/1A borehole (e.g. Waagestein, Guise & Rex, Reference Waagstein, Guise, Rex, Jolley and Bell2002).
The Beinisvørð Formation and Lopra Formation represent the oldest volcanic rocks in the sequence. The Beinisvørð Formation has a thickness of over 900 m onshore and occurs on the islands of Mykines, Suðuroy and Vágar (see Fig. 1). On Suðuroy the Lopra-1/1A borehole failed to reach the base of the lava succession at a drilling depth of 3565 m (Hald & Waagstein, Reference Hald, Waagstein, Berthelsen, Noe-Nygaard and Ramussen1984). On the Faroe Islands, the top of the Beinisvørð Formation is marked by a sedimentary sequence: the Prestfjall Formation. This hiatus in the eruptive activity is represented by the deposition of lacustrine sediments and the development of a thick coal sequence which has been mined. This zone is approximately 10 m in thickness, but has been noted to be locally up to 15 m (Rasmussen & Noe-Nygaard, Reference Rasmussen, Noe-Nygaard and Henderson1970). The formation has been geochronologically constrained by the use of combined palynological and isotopic dating to the age range c. 60.56–57.5 Ma by Jolley, Clarke & Kelley (Reference Jolley, Clarke and Kelley2002), and some of the deepest lavas drilled in Lopra-1/1A have been constrained by Waagstein, Guise & Rex (Reference Waagstein, Guise, Rex, Jolley and Bell2002) at c. 58.8 ± 0.5 Ma (1σ) by Ar/Ar whole rock dating. These dates may be slightly younger when regional correlations are used (Jolley, Reference Jolley2009).
The Malinstindur Formation volcanic rocks have a thickness of about 1350 m estimated from onshore outcrop on the Faroe Islands (Passey & Bell, Reference Passey and Bell2007). The complete succession may be seen from its base on the island of Vágar in the west, to Eysturoy and other islands in the east. It starts with olivine–phyric compound lava flows and passes upwards to plagioclase–phyric compound flows (e.g. Figs 2b, 3). Additionally, within the olivine flows, two different olivine–phyric suites can be identified geochemically (low-TiO2 and high-TiO2) (see Waagstein, Reference Waagstein, Morton and Parson1988; Rasmussen & Noe-Nygaard, Reference Rasmussen, Noe-Nygaard and Henderson1970).
The Enni Formation consists of a mixture of simple and compound lava flows, with a remnant thickness of 900 m with a few hundred metres removed due to erosion (Ellis et al. Reference Ellis, Bell, Jolley, O'Callaghan, Jolley and Bell2002; Passey & Bell, Reference Passey and Bell2007) (Figs 2e, 3). The Enni Formation is considered to have erupted during magnetic chron C24R (Waagstein, Reference Waagstein, Morton and Parson1988), which places this activity into a cycle of eruptive activity which occurred prior to the opening of the NE Atlantic Ocean.
3. Seismic interpretation of offshore volcanic sequence
In this study, the offshore succession was interpreted using the character and geometry of the seismic reflections, combined with the understanding of facies architectures of flood volcanic rocks developed from studies of onshore exposures from key flood basalt sequences, such as the NAIP and the Etendeka province of Namibia (Planke, Alvestad & Skogseid, Reference Planke, Alvestad and Skogseid1999; Jerram, Reference Jerram, Menzies, Klemperer, Ebinger and Baker2002; Single & Jerram, Reference Single and Jerram2004; Jerram & Widdowson, Reference Jerram and Widdowson2005; Nelson et al. Reference Nelson, Jerram, Single and Hobbs2009). Precise identification of boundaries is difficult on seismic reflection data because of the complex scattering and absorption of the seismic energy by the heterogeneous basalts. Figure 4a highlights an example of the well-log data available through lava sequences and the information that we can gain in terms of rock properties (Fig. 4b) for the different volcanic facies that occur in flood basalts (Nelson et al. Reference Nelson, Jerram, Single and Hobbs2009). The velocity range of different internal facies within flood basalt lava sequences is given in Figure 4b, and this has been used to guide the velocity models used in this contribution; for the lava flows (tabular and compound) we use a velocity of 4000 m s−1, and for hyaloclastites we use 3500 m s−1.

Figure 4. Flood basalt rock properties. (a) Example of wireline log information from offshore sequences of lava flows exhibiting different facies types (data from ODP Hole 642E; Eldholm et al. Reference Eldholm, Thiede and Taylor1987). (b) Ranges of velocities for different internal lava flow facies, used to guide velocity estimates (adapted from Nelson et al. Reference Nelson, Jerram, Single and Hobbs2009). Units: ZDEN is bulk density (g cm−3); Vp is P-wave velocity in km s−1; GR is natural gamma ray; API is American Petroleum Units (standard for use in wireline logs).
In this study we will use the following terminology to describe the major lava sequences that we can identify in the GFA 99 data from the Faroe–Shetland basin: (1) Lava sequence 1 – the uppermost lavas as identified by characteristic seismic signatures; (2) Lava sequence 2 – the middle section of lavas as identified by characteristic seismic signatures; (3) Lava sequence 3 – lowermost volcanic rocks identified using seismic and gravity, and (4) Hyaloclastite apron – representing a large palaeo-waterbody found in the eastern side of the offshore data identified using pro-grading foresets on seismic data. The interpretation and modelling of the facies of the Faroe Islands Basalt Group offshore in this study is concentrated across the area of the commercial GFA-99 seismic data which lies approximately 60 km SE of the Faroe Islands in the Faroe–Shetland Basin (Fig. 1).
Geological interpretation of the GFA-99 2D seismic dataset has covered several iterations through mapping observed structure then checking the candidate interpretation with gravity anomaly data. The main focuses of the study are the volcanic sequences in the data. The sedimentary overburden has been grouped into the upper sediments, equivalent to post-Oligocene overburden, and the lower sediments, equivalent to an Eocene–Oligocene package (e.g. Davies et al. Reference Davies, Cloke, Cartwright, Robinson and Ferrero2004); this is indicated on the figures and aids in the gravity modelling. The following section studies the offshore interpretation of the volcanic rocks through the GFA-99 dataset: how the sequence is recognized in the seismic data, the facies interpretations and the estimated thicknesses present within this part of the NAIP flood basalts. To aid the description of the volcanic rocks, three interpreted sections through lines 105, 107, 109 are presented in Figure 5.

Figure 5. Geological interpretations of GFA-99 lines: (a) 105, (b) 107, (c) 109. Line locations are given on inset maps (see also Fig. 1).
3.a. Lava sequence 1
The top of the lava sequence 1 is recognized by a laterally extensive reflection. This reflection starts at about 1580 ms TWT in the west of seismic line 105 and at a similar time in each of the other W–E seismic lines of 107 and 109. The reflection is characterized by being the strongest amplitude reflection below that of the sea bed, and by the rugose nature of its top surface. The top lava sequence 1 pick is heavily affected by the Eocene to Miocene compressional phases associated with changes in the spreading dynamics of the NE Atlantic (Boldreel & Andersen Reference Boldreel, Andersen and Parker1993), and the surface is faulted in much of the GFA-99 area. A characteristic feature of the top lava sequence 1 is the presence of thrust faults that pierce the surface and the presence of associated thrust-tip folds (e.g. see Fig. 5a).
The gently dipping lava sequence 1 volcanic rocks cover over 9.4 × 10³ km2 of the dataset area and follow the general structural dip towards the SE into the Corona Basin where they pinch out. The Faroe Islands Basalt Group is at its shallowest in the north of the GFA-99 area where the lava sequence 1 is interpreted to be close to the sea floor.
3.a.1. Thickness
The lava sequence 1 succession maintains a reasonably constant thickness of about 1000 m (500 ms TWT) across most of the study area, apart from where the formation feathers out towards the south and east. The interval is mainly composed of parallel, laterally persistent reflections, except for in the southwest, where a divergent reflection sequence is observed to dip down into the region of the Corona Basin. In the north and west of the lines, the entire thickness of the lava sequence 1 succession consists of parallel, laterally continuous reflections. Towards the SE, many of these reflections pinch out and appear to downlap shallowly as the lavas thin above dipping, divergent sequences. This thinning provides an indication of the maximum extent of the lava sequence 1 distal to the Faroe Islands. The character of the sequence suggests that the lavas pinch out close to the east end of GFA-99. This notion is supported by the observations of Ellis et al. (Reference Ellis, Bell, Jolley, O'Callaghan, Jolley and Bell2002).
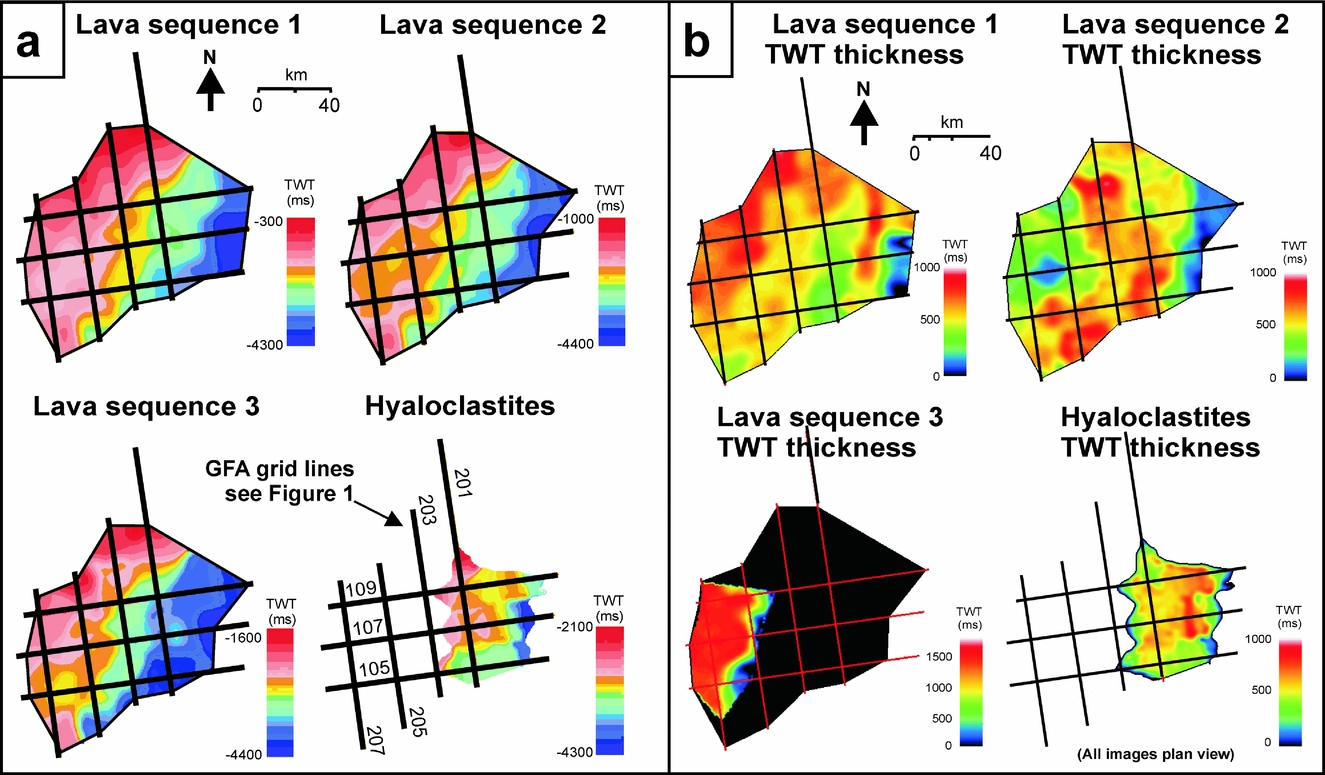
Mapping the various reflections from the volcanic sequence generates the TWT thickness maps shown in Figure 6. Using the interval velocity of 4000 m s−1 it is then possible to calculate the thickness of these sequences and their variations across GFA-99 (Fig. 7). The formation is at its thickest (about 1900 m) in the north and the west, which is more proximal to the source region for the volcanic sequences, however, about 1400 m is calculated to be present where the interpretation of the GFA-99 data is reliable and multiples are at a minimum. As stated, the preserved onshore thickness of the Enni Formation is about 900 m, with the top of the formation missing due to erosion. If the lava sequence 1 units were equivalent to the onshore units it would suggest that up to about 500 m of lavas may be missing from the onshore exposures on the Faroe Islands. This is in close agreement with previous estimates of erosion of the onshore sequence of a few hundred metres (e.g. Ellis et al. Reference Ellis, Bell, Jolley, O'Callaghan, Jolley and Bell2002).

Figure 6. (a) Depth maps to volcanic horizon picks interpolated and represented as 2D surfaces in Two-Way-Time (TWT). GFA-99 grid is shown for location purposes. Note that the depth to the top of all of the interpolated reflectors increases towards the SE as the succession dips into the Corona Basin, east of the East Faroes High. Artefacts of interpolation are apparent in the diamonding effects observed between the 20 km spaced 2D seismic lines. (b) Two-way-time (TWT) thicknesses of the volcanic horizons of the Faroe–Shetland succession in the GFA-99 data.

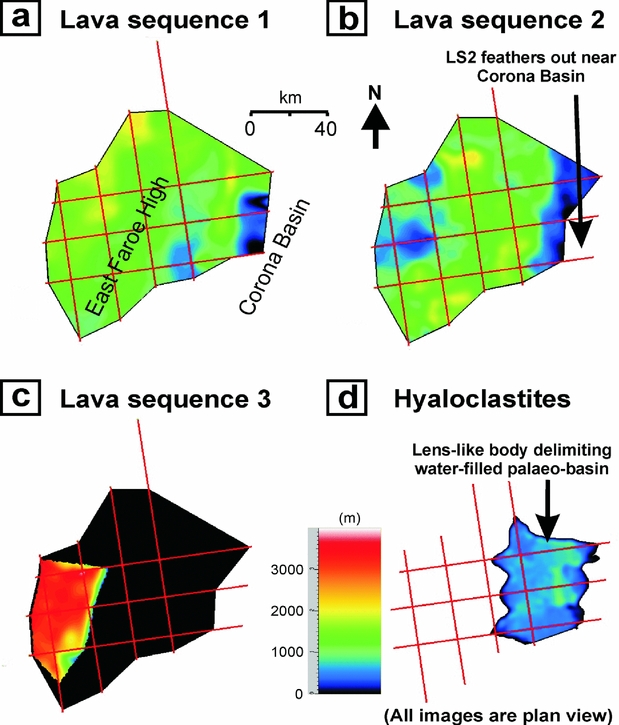
Figure 7. Isopach maps of the calculated thicknesses of the volcanic horizons of the Faroe–Shetland succession in the GFA-99 data in metres.
3.a.2. Facies interpretation
The seismic reflections in the NW and upper parts of the lava sequence 1 interpretation have strong amplitudes and are laterally persistent. Individual high amplitude reflections may be picked over tens of kilometres (Fig. 8a). This simple character and the lateral extent of the reflections suggest that the volcanic rocks in these parts of the lava sequence 1 may be of tabular-type facies (e.g. Jerram, Reference Jerram, Menzies, Klemperer, Ebinger and Baker2002). From onshore studies, the Enni Formation volcanic rocks have been shown to be composed of simple type flows of about 10 m mean thickness (Ellis et al. Reference Ellis, Bell, Jolley, O'Callaghan, Jolley and Bell2002), intercalated with zones of thin compound flows (Passey & Bell, Reference Passey and Bell2007) (e.g. Fig. 8b). Between many of the flows, sedimentary intervals are developed similar in character and thickness to those seen in the Skye Lava Field successions on the Isle of Skye. The lava sequence 1 rocks are dominated by plagioclase–phyric flows in the central Faroes (e.g. Ellis et al. Reference Ellis, Bell, Jolley, O'Callaghan, Jolley and Bell2002 and references therein), and have been interpreted to represent volcanism similar to the plains volcanism (Snake River Plain) of Greeley (Reference Greeley1982) (Passey & Bell, Reference Passey and Bell2007). Studies on other sequences in the NAIP such as Skye have shown that more evolved lava types such as the hawaiites and mugearites (basaltic–andesites) which are often found in the upper parts of NAIP lava sequences, tend to develop more simplistic internal and external morphologies due to their increased erupted viscosities and inflated modal silica contents (Single & Jerram, Reference Single and Jerram2004). Given the very clear reflectors, much of the lava sequence 1 may be considered to be akin to these typical trap-like tabular lava sequences. The south and eastern areas of GFA-99 show the tabular lava sequences are linked with a prograding sequence of reflections interpreted to be hyaloclastites. We will discuss the detail of this facies in the hyaloclastite apron section below.

Figure 8. An onshore analogue from the Faroe Islands for the transition from lava sequence 1 tabular flows to the lava sequence 2 compound-braided flows. The tabular lavas form laterally extensive thick flows (~ 10 m thick average) that may be correlated over hundreds of metres to several kilometres. (a) A section of GFA-99 line 207 showing the characteristics of this architectural facies transition. (b) Cliff section looking NE down Kollafjørður on the east coast of Streymoy at about 300 m thickness of Enni Formation tabular-type lava flows (intercalated with poorly exposed compound units). Six obvious tubular lava flow basal contacts have been indicated on this particular mountainside section. Note the poor exposure of the Malinstindur Formation in comparison.
3.b. Lava sequence 2
The interpretation in this part of the Faroe Islands Basalt Group is more difficult than the lava sequence 1 due to a loss in seismic resolution. This is caused by the greater depth of the lava sequence 2, the dispersive and high acoustic impedance properties of the overlying lava sequence 1 volcanic rocks, and also the different internal facies architecture of the lava sequence 2, probably due to more compound-braided flow units such as those noted for the Malinstindur Formation in the onshore exposures on the Faroe Islands.
3.b.1. Horizon interpretation and distribution
Whereas the top of the lava sequence 1 is a distinct, high amplitude reflection beneath the lower sediments (due to the high acoustic impedance contrast over the sediment/lava interface), the intra-volcanic contrasts are minor, unless seismically significant facies changes occur within the succession. In much of the lava sequence 1/lava sequence 2 interface offshore, there is no obvious seismic boundary, and arbitrary boundaries are inferred. The two formations are usually referred to together in most of the literature due to the arbitrary nature of the boundary interpreted in seismic studies. In this interpretation, the top of the lava sequence 2 is taken as the highest amplitude TWT pick which sits approximately 600–1000 ms beneath the top lava sequence 1 pick, which is thought to represent the lowest continuous simple flow reflection before a thick sequence of predominantly compound flows of the lava sequence 2. It should be noted that if the boundary between lava sequence 1 and lava sequence 2 was the same as that between the Malinstindur Formation and the Enni Formation, onshore, then this horizon would be separated by a thin sequence of volcanic sandstones and breccias as in the Sneis Formation (Passey & Bell, Reference Passey and Bell2007). Given the lack of a clear reflection, if such a transition existed offshore, then the interval must be too thin and/or not of significant velocity contrast to be imaged.
In the SE of the GFA-99 area, the base of the lava sequence 2 is interpreted to be the series of high amplitude broken reflections deep in the volcanic succession. These are interpreted to be sill complexes at the base of the volcanic succession and form zones of over 1000 ms TWT of strong, lozenge-like reflections. The convergence of downlapping reflections is also taken as a base-succession marker in this part of the data. The lava sequence 2 is present across the entire GFA-99 area, but thins to a minimum in the eastern extremity of the dataset, as in the case of the lava sequence 1, which could be due to the distance from the eruptive source for these units.
3.b.2. Thickness
Thickness of the lava sequence 2 varies considerably through the 2D seismic grid studied. The maximum thickness of the formation is about 1900 m (~ 950 ms) and the lavas pinch out entirely to the southeast. Errors associated with these values may be mainly attributed to the difficulties of interpretation of the lava sequence 2 base, and to a lesser extent the lava sequence 2 top, as discussed above. The thickest part of the volcanic rocks lies through the centre of the dataset where a N–S swath of volcanic rocks has a mean thickness of about 1300 m (corresponding TWT maps are shown in Fig. 6b).
3.b.3. Facies interpretation
Much of the western part of the dataset contains broken, dispersed reflections that cannot be correlated over the large distances (kilometres) possible in the tabular-type lavas interpreted to be present in the lava sequence 1. This is attributed to the lavas being formed of mainly compounded lava flow sequences similar to other examples in the NAIP, such as onshore Faroes (e.g. Passey & Bell, Reference Passey and Bell2007) and those seen towards the base of the succession studied in the Skye Talisker Bay study area (Single & Jerram, Reference Single and Jerram2004). The stacking patterns are complex in the vertical section, but also laterally as the eruptive style of these flows form compound-braided systems in 3D (Jerram, Reference Jerram, Menzies, Klemperer, Ebinger and Baker2002). Both the lava sequence 2 and lava sequence 1 change laterally into large prograding reflections of the hyaloclastite apron discussed below.
3.c. Hyaloclastite apron (lava sequences 1 and 2)
In the south and east of the GFA-99 area, beyond N–S line 201, the tabular-type lavas of the western parts of the lava sequence 1 are noted to spill into a series of basinward-dipping reflections (e.g. Fig. 5a, b). These are interpreted to form a prograding hyaloclastite fan or apron in the Corona Basin region and dip down towards the ESE. Such prograding hyaloclastites that formed from lava flows into the sea were originally described by Moore et al. (Reference Moore, Phillips, Grigg, Peterson and Swanson1973) and have been previously described in the Faroe–Shetland region (e.g. Kjorboe, Reference Kjorboe, Fleet and Boldy1999). Good examples are also known from onshore Greenland in the NAIP (e.g. Pedersen et al. Reference Pedersen, Larsen, Pedersen and Hjortkjær1998). The reflection sequences in this part of the lava sequence 1 are clearest on the lines 105 and 107. Although the divergent nature of the reflections is clear, the boundaries of any particular sequence are less clearly defined. The hyaloclastites show complex internal morphology in comparison to the more simple lava types interpreted in the bulk of the lava sequence 1. The complexity of the internal morphologies of the lavas means that the distinction between the lava sequence 1 and the underlying lava sequence 2 is difficult to interpret, especially through the hyaloclastite zones. The interpretation of the presence of a lava sequence 1 hyaloclastite apron has been made by detailed picking of the volcanic internal reflections, paying particular attention to onlap, downlaps and pinch-out relationships seen within the formations. The presence of a hyaloclastite apron in the lava sequence 1 indicates that the Faroe Islands Basalt Group was filling a water-filled basin in the east of the GFA-99 area, lavas moving into this accommodation space from their eruptive source somewhere in the west. A more distinct boundary between the lava sequence 1 and the lava sequence 2 is observed in the north and west of the data area, where the interpreted hyaloclastites are not deemed to be present. Figure 5a displays a basic interpretation of the GFA-99 line 105, showing some of the more prominent tabular-type picks in the data, and also some of the downlapping features present in the hyaloclastite deltaic succession.
Hyaloclastites are also interpreted to form a large thickness of the lava sequence 2. The dipping reflections are observed to dip steeply towards the ESE and form a body which runs NNE–SSW through the study area. The spacing of the seismic lines is too great (20 km) to understand whether the hyaloclastites form individual deltas, but their widespread occurrence in the lava sequence 2 in lines 105, 107, 109 and 201 suggest the body to be more like an apron than individual deltas. The thickness of the hyaloclastites in the lava sequence 2 indicates the presence of a deep water body proximal to the subaerially erupted lavas; the hyaloclastites prograde basinward towards the Corona area and appear to be on a similar scale to hyaloclastite dipping successions in west Greenland (Fig. 9). Significantly, this accommodation space was present and being filled by both the lava sequence 2 and lava sequence 1, and provides important additional constraints on models used to look at the spatial and aerial extent of uplift prior to the onset of volcanism (e.g. Jones et al. Reference Jones, White, Clarke, Rowley, Gallagher, Doré, Cartwright, Stoker, Turner and White2002; Maclennan & Jones, Reference Maclennan and Jones2006).

Figure 9. Hyaloclastite facies. (a) The east section of GFA-99 line 109 where thick hyaloclastites are developed prograding towards the east of the section. (b) Onshore analogue hyaloclastite breccia deposited in the Naajat lake, west Greenland (from Pedersen et al. Reference Pedersen, Larsen, Pedersen and Hjortkjær1998).
Figure 7 shows a thickness map for the interpreted hyaloclastite volcanic rocks that are considered to be present in both the lava sequence 2 and the lava sequence 1. This body has a maximum thickness of about 1200 m (~ 700 m s−1), with most data points in the body clustering around the 400–600 m thick range (Fig. 7). This represents a massive thickness of fragmental volcaniclastic matrial that are interpreted to have been erupting into a substantial water body. The calculations of Ellis et al. (Reference Ellis, Bell, Jolley, O'Callaghan, Jolley and Bell2002) suggest the hyaloclastites form foresets between 150 and 500 m in thickness. The present study confirms a similar calculated-scale of hyaloclastite foresets.
3.d. Lava sequence 3
The depth at which the top lava sequence 3 volcanic rocks exist in the seismic data is difficult to interpret, because deeper structure is masked due to earth filtering of the seismic signal by the complex overburden succession. Its presence and structure is therefore ratified by the use of gravity data. An interpretation is now presented based on a combination of the seismic reflection characteristics and gravity models. Gravity models were built at ARK Geophysics Ltd prior to both the collection of Faroe Islands fieldwork data and before the seismic interpretations were finalized.
3.d.1. Horizon interpretation and distribution
It is not possible to interpret accurately the boundaries of the succession, or if the lava sequence 3 exists at all in more than just the three W–E lines of 105, 107 and 109. The lava sequence 3 must be also present in N–S line 207, but its interpretation is difficult to justify to the east of this particular line. The easterly extent of the formation is interpreted to be coincident with the East Faroe High. Base lava sequence 3 picks are represented in Figure 5, by a pick based on the interpretation of sills at the base of the succession as strong, bright seismic reflections, and the downlap of dipping reflections.
3.d.2. Thickness
The Lopra-1/1A borehole indicates the succession to be extremely thick beneath the Faroe Islands. The interpretation of the seismic data predicts a thickness of at least 3000 m (~ 1630 ms) (Fig. 6). The most reasonable estimate of lava sequence 3 thickness is made by combining the seismic interpretation with gravity data into a model. Along the profile of line 107 this modelling required a base-case model thickness in excess of 2700 m (Fig. 10). This is consistent with the observation from seismic studies and highlights the need for a multi-disciplinary approach to help solve basalt cover and sub-basalt imaging problems (Jegen-Kulcsar & Hobbs, Reference Jegen-Kulcsar and Hobbs2005; Hautot et al. Reference Hautot, Single, Watson, Harrop, Jerram, Tarits, Whaler and Dawes2007).

Figure 10. (a) Gravity model of GFA-99 line 107 (see Fig. 1 for location) built from seismic interpretation picks only. The above model is inaccurate in several areas, particularly in the centre of the line where mass-loss is required both within and beneath the volcanic succession. (b) Geological interpretation and model of the GFA-99 line 107 incorporating Bouguer gravity data. The observed gravity anomaly along line 107 requires a significant volume of low-density material to be present in the central portion of the line at a sub-volcanic level. The observed gravity profile strengthens the argument for a significant succession of LS3 hyaloclastite at the west end of the section where the density of the LS3 geological interpretation needs to be reduced at that level in the stratigraphy. The gravity profile interpretation is filtered to 45 km low-pass wavelength; at this wavelength, the gravity calculated from the model has a maximum deviation of 0.7 mgal from the observed Bouguer data.
3.d.3. Gravity based interpretation
The facies interpretation is based on observations of the geometries present within the possible lava sequence 3 succession, and by creating gravity models along the seismic W–E lines. An initial interpretation of line 107 is shown in Figure 10a. This gravity model is constructed over depth-converted seismic data and horizon interpretations (depth converted at ARK Geophysics), and it includes the hyaloclastite piles of the lava sequence 2, but the lava sequence 3 is missing entirely, and there is no sub-volcanic sedimentary succession. The densities assigned within particular stratigraphic packages are implemented from the ARK Field software database in combination with a volcanic rock property database developed as part of the SIMBA project (e.g. Fig. 4b; see Nelson et al. Reference Nelson, Jerram, Single and Hobbs2009). This provides an unsatisfactory interpretation of the regional gravity data.
An improved gravity model of line 107 is shown in Figure 10b. The reduction in density of the central portion has improved the calculated gravity response by adding sediment to the sub-volcanic part of the succession. This will be discussed in the next section. If we assume that the sediments do not extend to the western edge of the model, we need some additional mass loss to fit the observed gravity anomaly. In particular, line 107 shows dipping reflections that can be interpreted as part of a lava sequence 3 succession. This suggests that the lava sequence 3 may be represented by hyaloclastites and volcaniclastics similar to those seen more distal and basinward in the lava sequence 2 and lava sequence 1. By reducing the density of the interpretation of the lava sequence 3 in this model of line 107 to that of a hyaloclastite, a good fit between the observed and calculated gravity is achieved. The lava sequence 3 is known to form thick tabular-type lavas in the Lopra-1/1A section, but beneath these, the drilling was terminated in a thick pile of subaqueously deposited volcaniclastics/hyaloclastites (Ellis et al. Reference Ellis, Bell, Jolley, O'Callaghan, Jolley and Bell2002; Waagstein, Reference Waagstein, Chalmers and Waagstein2006). In the area of GFA-99, these are considered to be represented by the basinal progradational lava delta hyaloclastites suggested by gravity interpretation.
3.e. The sub-volcanic section
The sub-volcanic zone is the part of the dataset which has interested the petroleum industry enough to acquire seismic datasets such as GFA-99. The sub-volcanic section is considered to be a potential petroleum play (e.g. Ziska & Andersen, Reference Ziska, Andersen, Ziska, Warming and Bloch2005). The top part of the sub-volcanic rocks is marked by interpreted sill complexes.
3.e.1. Sills
Sill complexes are observed at the base of the lava sequences of Skye, in great thicknesses on the northern Trotternish Peninsula in particular, where over 50 m of sills sit beneath the base of the lava succession. Similarly, in the Etendeka flood basalts of Namibia, the substantial Huab Sills complex again fills a large volume of dense material at the base of the province lava sequences (Duncan et al. Reference Duncan, Newton, Van Den Berg and Reid1989). In the NAIP, sill complexes have been successfully imaged in some of the 3D seismic data sets (e.g. Thomson, Reference Thomson2005) and where limited or no significant lava cover exists (e.g. Hansen, Reference Hansen2006). In the Faroe–Shetland basin, significant sill complexes are known from seismic studies on the feather edge of the lavas (e.g. Smallwood & Maresh, Reference Smallwood, Maresh, Jolley and Bell2002). Therefore, there is significant evidence for offshore sill complexes in this region, and in many flood basalt examples exposed onshore there is a common relationship of sills intruding in and around the sediment/lava contact at the base of the lava pile. In the GFA-99 data, high amplitude reflections fill what is considered to be the basal zone of the lava field. Although individual reflections are rarely over 5 km long, they are interpreted to represent a series of sills in the Faroe–Shetland Sill Complex (Smallwood & Maresh Reference Smallwood, Maresh, Jolley and Bell2002) seated at the base of the succession across most of the GFA data. The sills are at their most prominent at the interpreted base of the lava sequence 2 beneath the hyaloclastite zones, and landward, beneath the interpreted compound lava types (Fig. 5).
3.e.2. Sedimentary rocks and basement
The presence of sub-volcanic sediments and the shape of the basement surface have been interpreted by the use of gravity data. Figure 10 presents 2D gravity models of the GFA line 107. These contain the greatest amount of vertical and lateral facies variability in the entire dataset. A simple, normally faulted basement is interpreted from Bouguer gravity data filtered to remove wavelengths longer than 350 km. On top of the basement a large thickness of sediment is modelled for a gravity data fit ratified to the 45 km high cut filter level; this filter allows accurate gravity interpretation as deep in the section as the top of the volcanic rocks. The sediment maximum thickness on top of this basement is estimated to be 6000 m. This is consistent with the total apparent sediment thickness estimated by Kimbell et al. (Reference Kimbell, Ritchie, Johnson, Gatliff, Doré and Vining2005) in this area, predicting localized depocentres with up to 10 km of sedimentary succession over basement.
4. Summary
The key volcanic facies that develop and their internal architectures are presented in Figure 11. In the present study we have introduced the facies variations that occur through the observed lava sequences on the Faroe Islands and presented a simplistic geological interpretation of the offshore lava sequences that are imaged in the GFA-99 dataset with the following observations and conclusions:
(1) Common lava facies that are found in the NAIP and particularly in the Faroe Islands succession include packages of Tabular Simple flows (individual flows ~ 20 m thick, Compound-Braided facies of lava lobes and flows (component flow lobes < 5 m thick) (e.g. Passey & Bell, Reference Passey and Bell2007), and subaqueously deposited Hyaloclastite facies (e.g. Fig. 11).
(2) The succession of volcanic rocks in the GFA-99 offshore data area potentially has a maximum thickness in excess of 6800 m, which is calculated in this study. This fits within the estimated ranges of preserved thickness of 6500–7000 m on the Faroes (Ellis et al. Reference Ellis, Bell, Jolley, O'Callaghan, Jolley and Bell2002; Passey & Bell, Reference Passey and Bell2007). Generally down to the top of the sub-volcanic sediments, or top lava sequence 3, where present, the succession has a thickness of about 2700 m across much of the area, again similar to estimates of up to ~ 3000 m (Fliedner & White, Reference Fliedner and White2003). A further 2700 m or more of lava sequence 3 may exist beneath this lava sequence 1–lava sequence 2 total thickness, as estimated from the combined gravity and seismic modelling to the north and west of the region. These thicknesses compare well with the estimates of Ellis et al. (Reference Ellis, Bell, Jolley, O'Callaghan, Jolley and Bell2002), who suggest the complete thickness of the extensive volcanic units discussed to be about 5550 m, combining data from the Faroe Islands and offshore data.
(3) The extrusive activity began with the emplacement of volcaniclastic material into a substantial water-body which lay in the environs of the present-day Faroe Islands. Their presence may be interpreted offshore to the SE of the islands. During the lava sequence 3, the volcanic rocks filled this former water-filled basin and erupted into the sub-aerial environment. Thick tabular-type lavas (flows ~ 20 m thick) formed a lava succession more than 900 m thick in the Faroes area and this eruptive phase waned. This process is likely to have taken place from c. 57 to 55 Ma (see Jolley, Reference Jolley2009).
(4) At c. 55 Ma, early in Chron24r, the lava sequence 2 blanketed the Faroe platform with thin flows of dominantly compound-braided facies architecture. These are similar in facies character to those seen in the Malinstindur Formation on the Faroes, and examples towards the base of the Skye Lava Field (Single & Jerram, Reference Single and Jerram2004). In the east of the offshore study area, these formed water-borne prograding hyaloclastite fans that grew into a slope-apron of foreset-bedded volcaniclastic material architecturally similar to the volcanic rocks seen in West Greenland (Pedersen et al. Reference Pedersen, Larsen, Pedersen and Hjortkjær1998) (Fig. 10). The convergence of the foreset-beds marks the base of the volcanic succession in the offshore data.
(5) The seismic response offshore suggests that the lava sequence 1 is dominated by laterally extensive simple flows and that the lava sequence 2 has a more complex internal architecture akin to compound units.
(6) The Hyaloclastite Apron indicates the presence of a significant body of water into which the lavas of the lava sequence 2 and lava sequence 1 prograded. This body, more than 500 m deep, must have been present at the onset of volcanism at c. 55 Ma, and may have been present but unfilled during the earlier volcanism.
Figure 11. (a) The development of a hyaloclastite apron pile as the lavas prograde into a substantial water body in the distal parts of the lava sequence 1/lava sequence 2 and potentially in the LLS, as interpreted from seismic, Bouguer gravity modelling and from Lopra 1/1A borehole interpretations. (b) Development of the lava field in the Faroe Islands Basalt Group lava sequence 1 and lava sequence 2.
Acknowledgements
The GFA 99 dataset was acquired by WesternGeco and made available to this project through the EU framework 5 project – SIMBA (ENK6-CT-2000–00075). We would like to thank the TOTAL GRC for funding parts of this work and for co-ordination of the EU SIMBA project. Specific thanks go to Paul Williamson, Claude Lafont of TOTAL, and ARK Geophysics for help with gravity modelling. This work was completed while DAJ was the TOTAL Lecturer at Durham University. RWH was funded as a NERC Advanced Fellow (NER/J/S/2002/00745). This contribution benefited greatly from reviews by John Smallwood and Simon Passey, editorial direction from David Pyle and Jane Holland, and additional discussion and comments from Richard Davies.